- In 2022, Great Britain’s road network spanned an estimated 245,100 miles (394,450 km), longer than a trip to the Moon. In April 2023, Northern Ireland’s road network spanned 16,067 miles or 25,858 km. (UK Department for Transport, July 2023; Department for Infrastructure (Northern Ireland), December 2023)
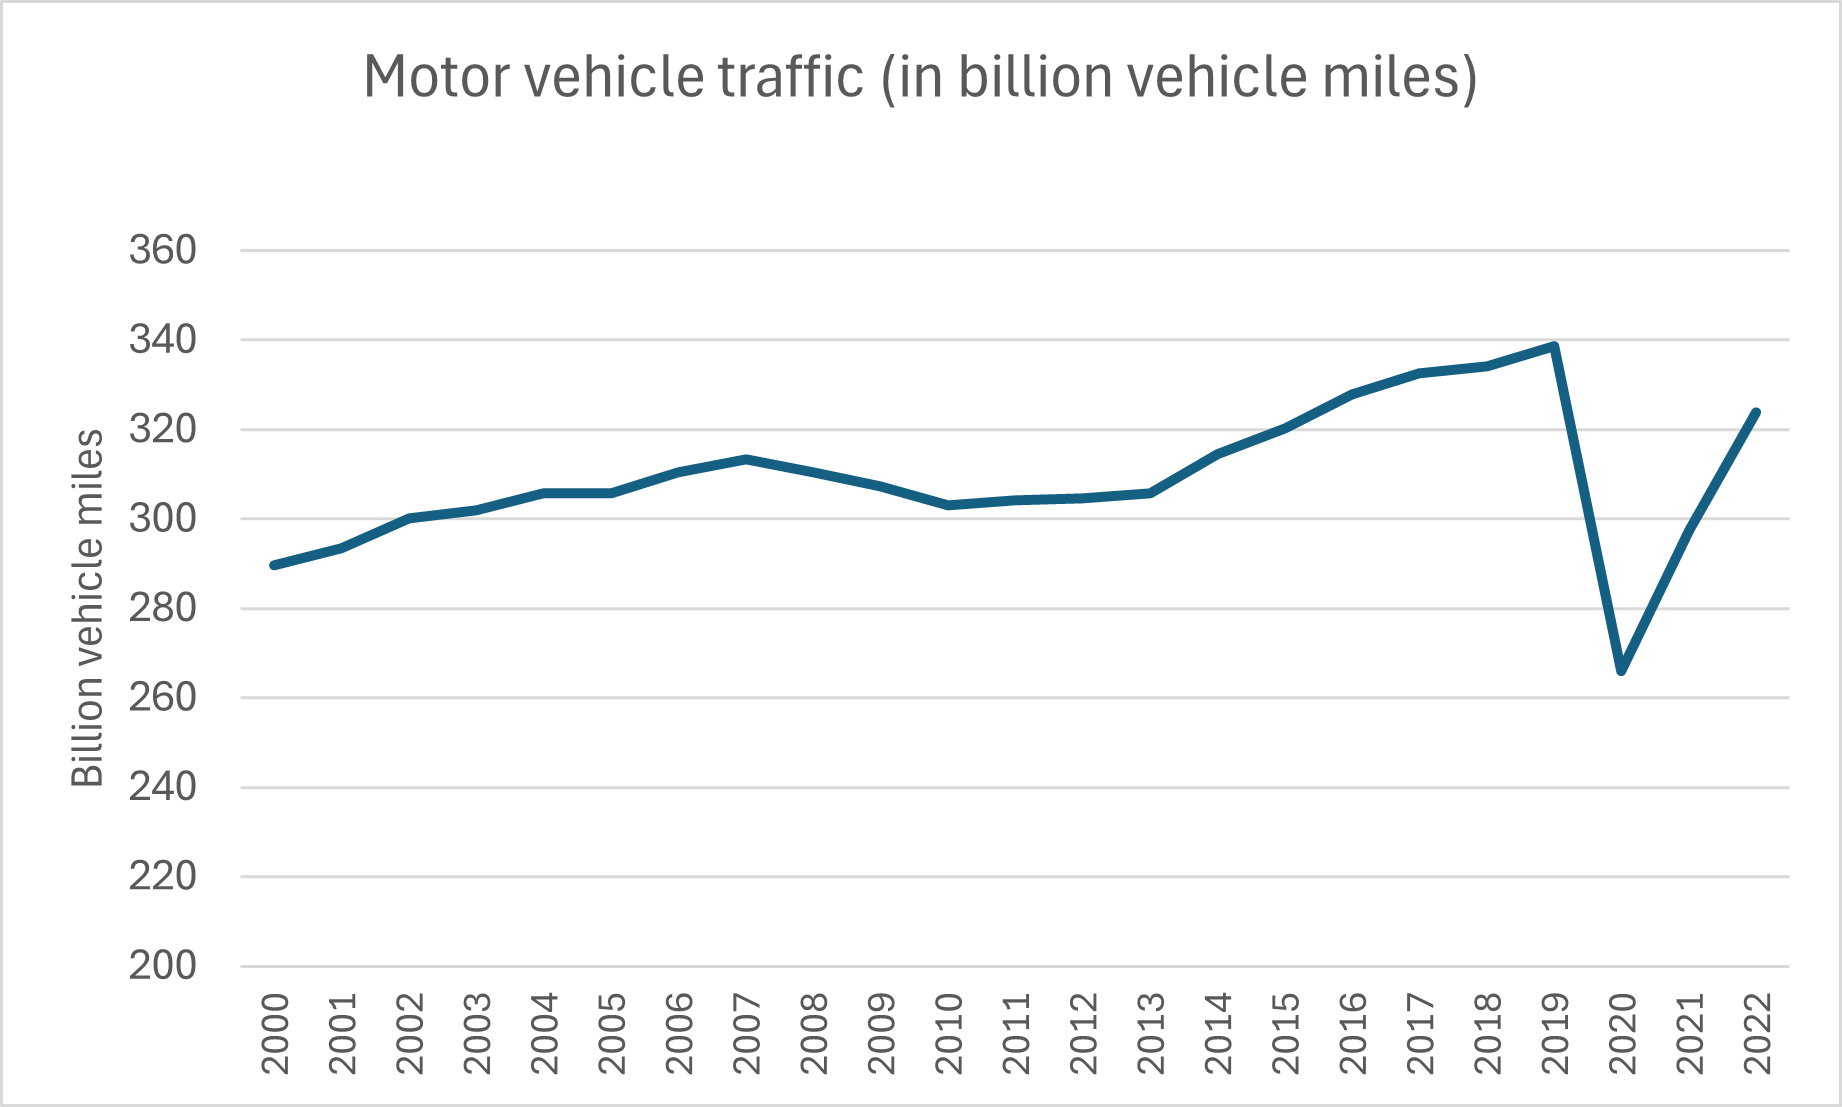
- In 2019, motor vehicle traffic hit a record high of 338.6 billion vehicle miles (bvm). By 2020, motor vehicle traffic had declined sharply to 265.9 bvm, likely caused by the COVID-19 pandemic and the measures used to fight it. In 2022, motor vehicle traffic had largely recovered to 323.8 bvm. See the following chart. (UK Department for Transport, July 2023)
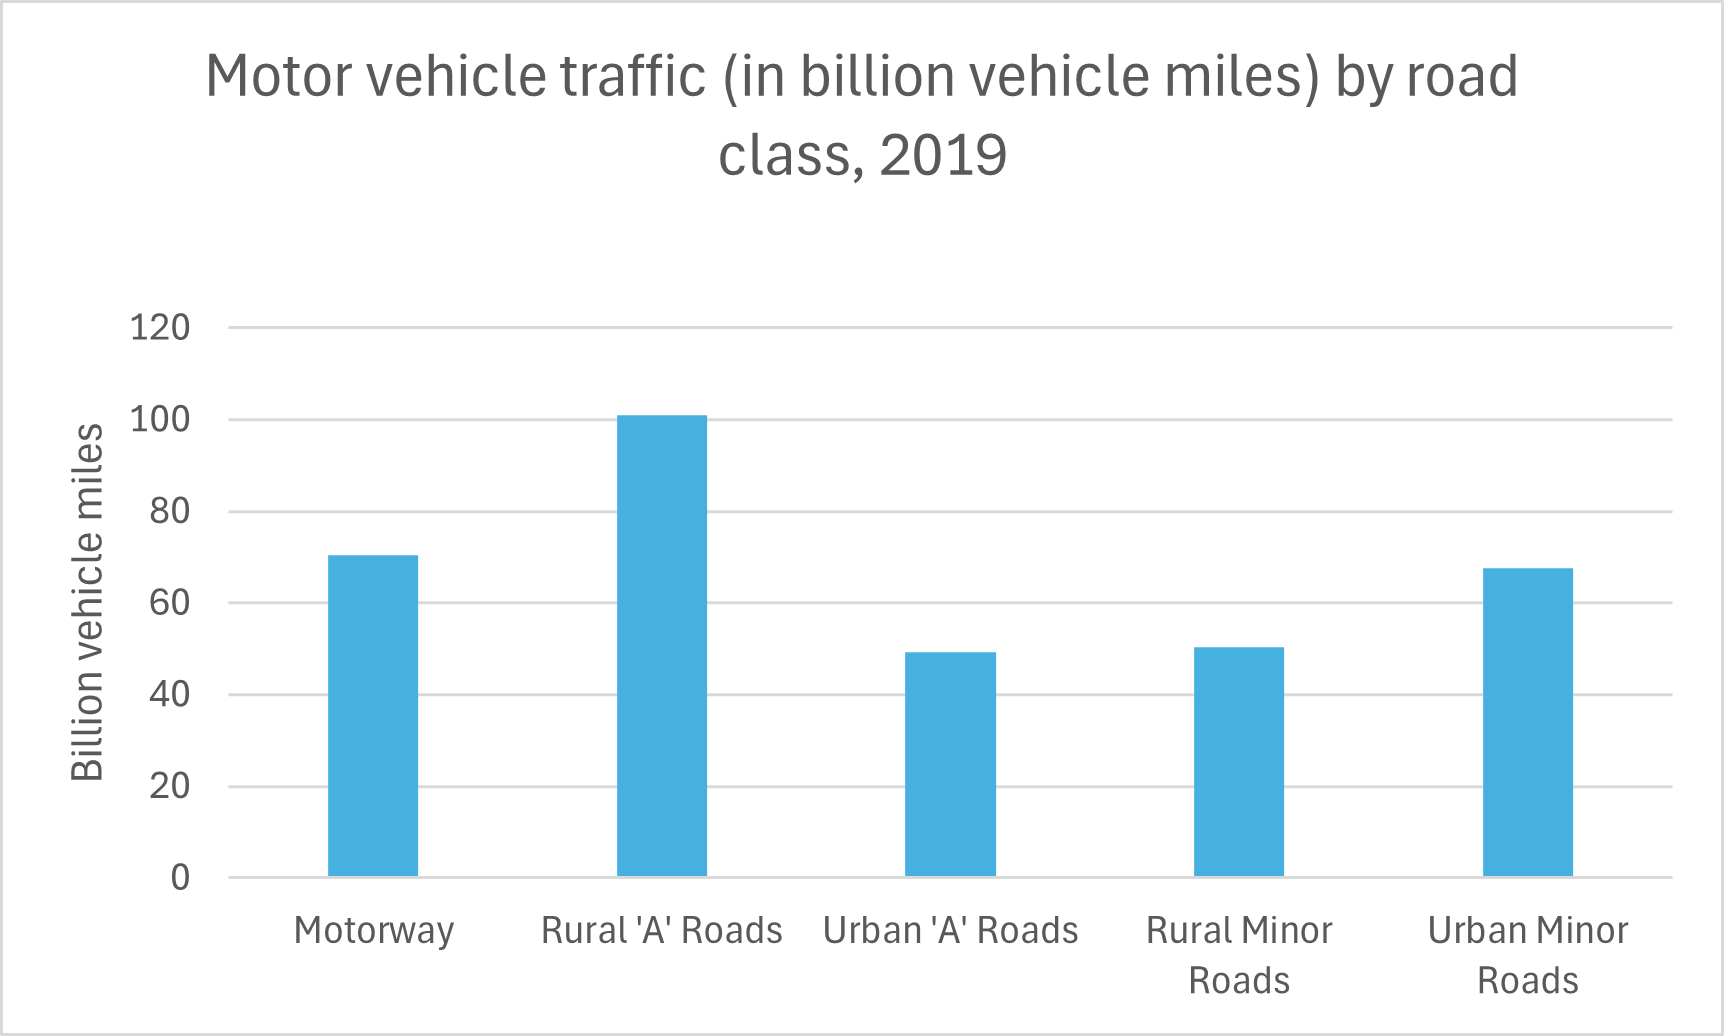
- The following chart breaks down motor vehicle traffic (in bvm) in 2019 (the last full year before the COVID pandemic) by road class. (UK Department for Transport, July 2023)
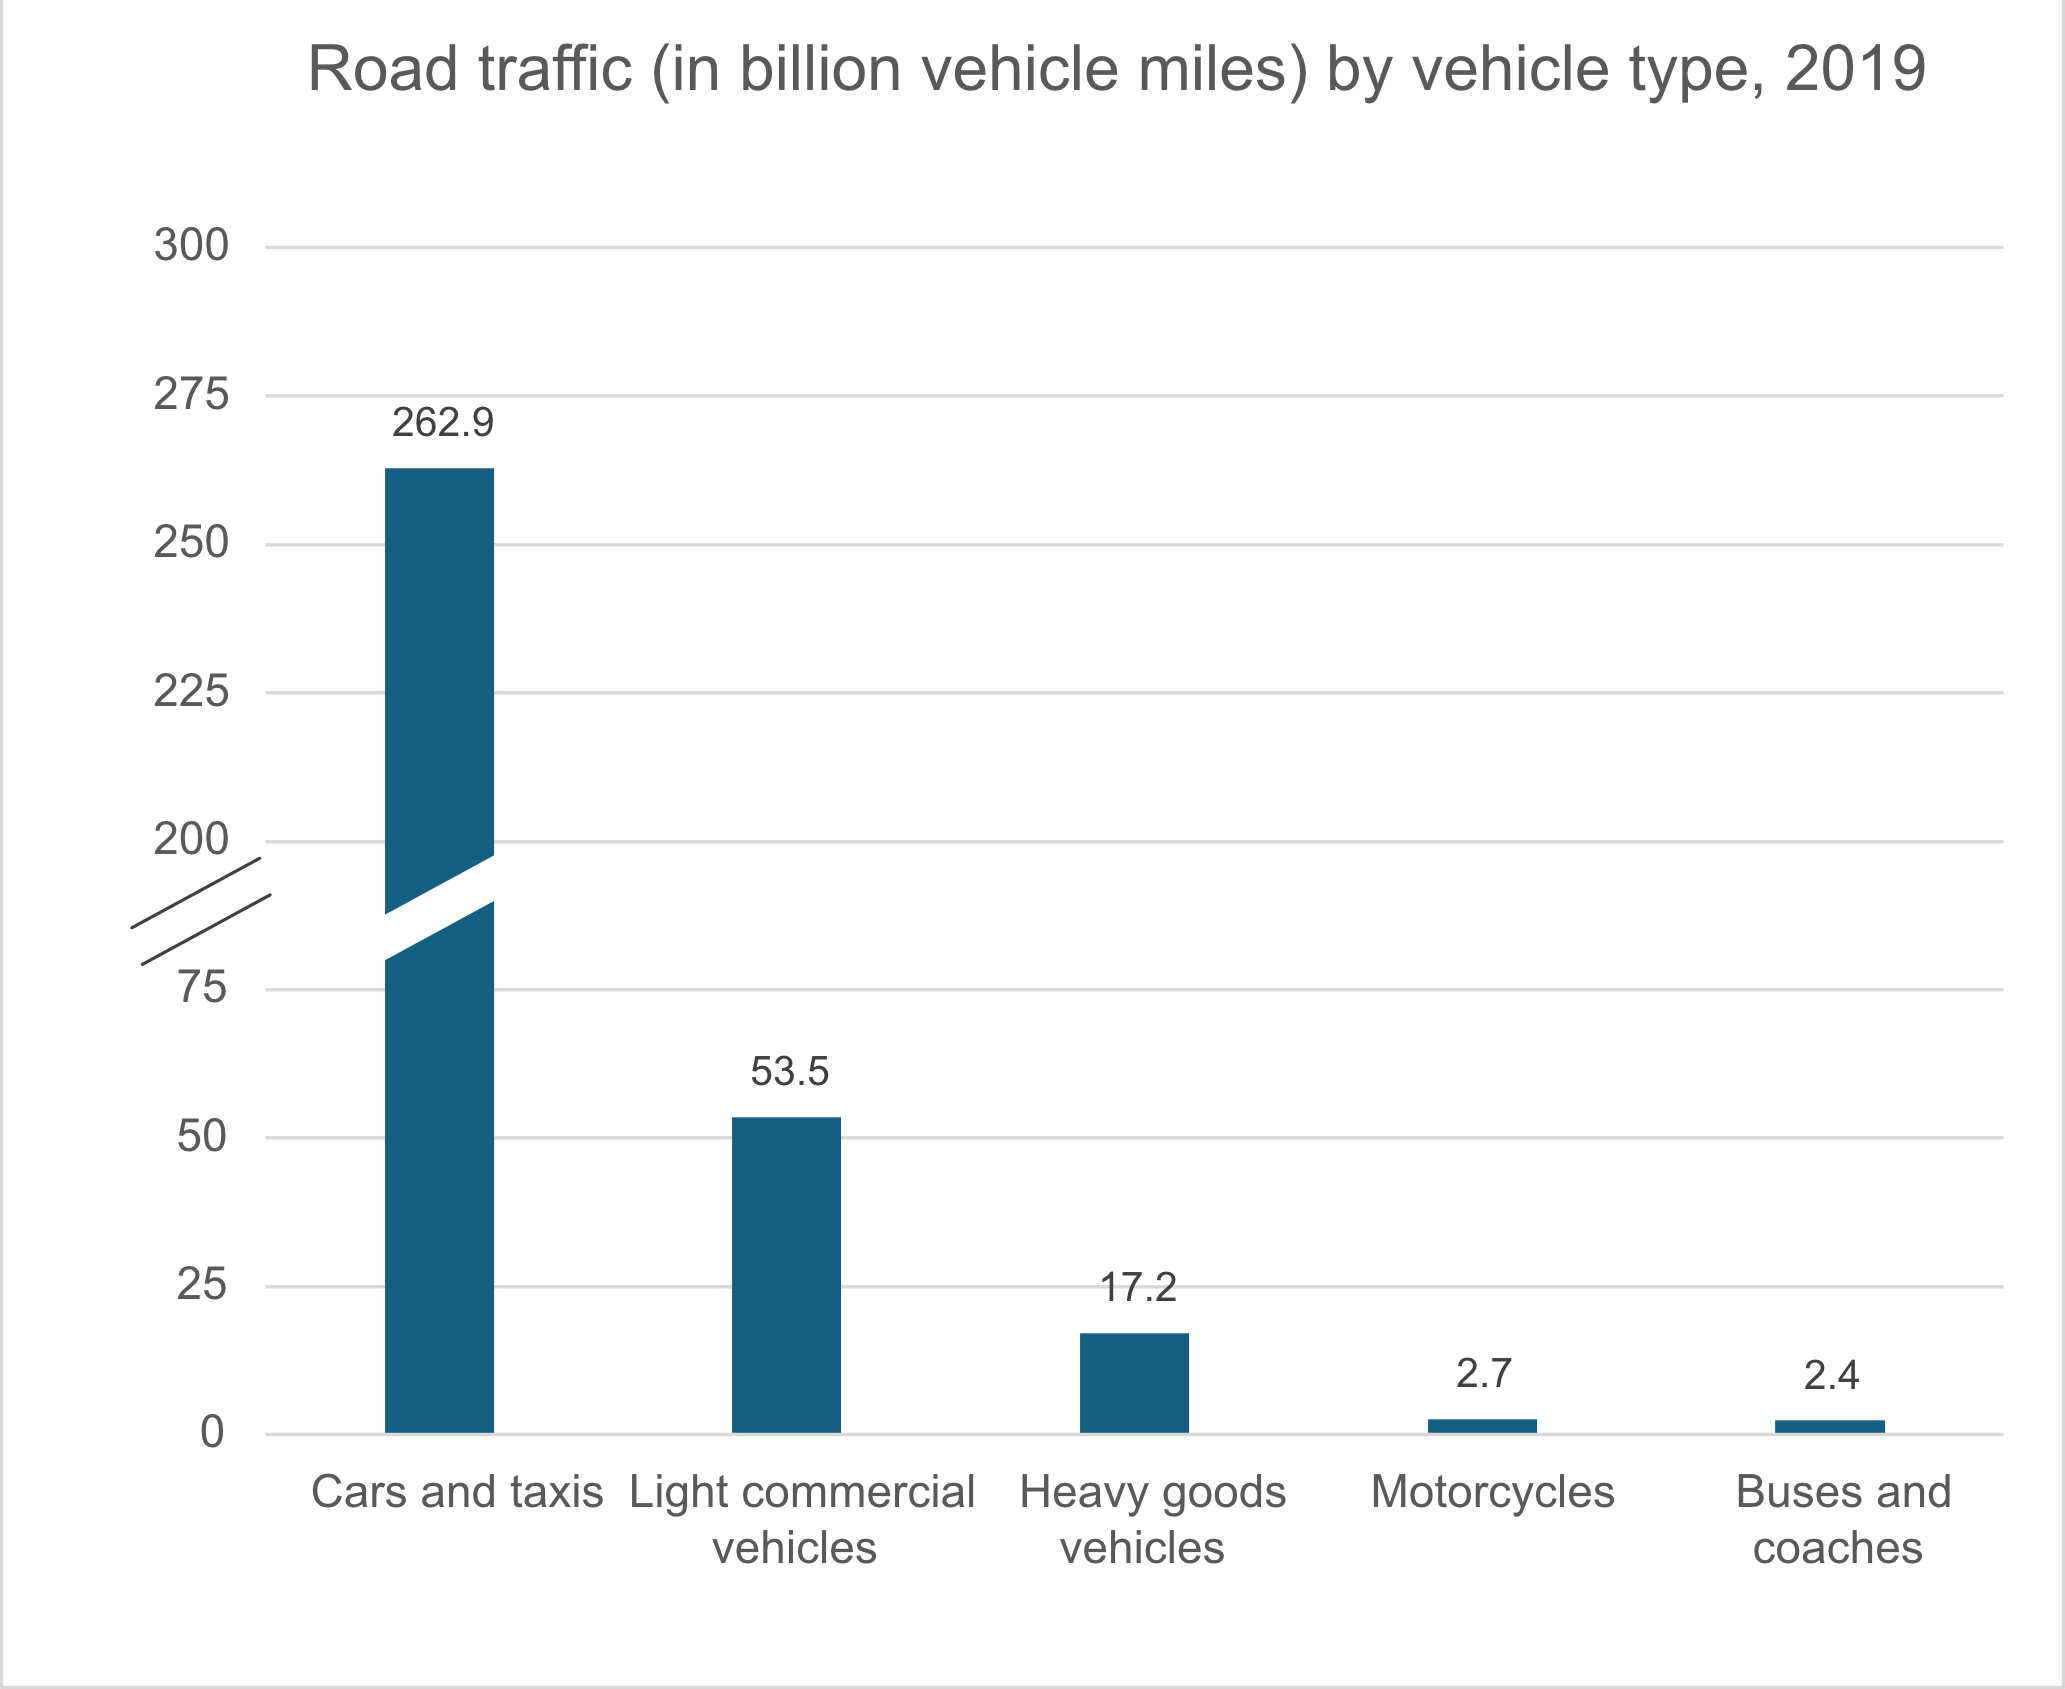
- The next chart breaks down motor vehicle traffic (in bvm) in 2019 by the type of vehicle. Vehicle traffic from cars and taxis dwarfed traffic from all other types of vehicles combined. (UK Department for Transport, July 2023)
- In the fourth quarter of 2020, there were about 38.58 million licensed vehicles in Great Britain, a decrease of about 101,000 vehicles (0.3%) compared with the fourth quarter of 2019. This was the first year-over-year decline since quarterly records began in 1994. It also represented the first year-over-year decline in licensed cars (0.6%) since 1994. In 2020, there were also significant declines in licensed heavy goods vehicles (3.1%) and licensed buses and coaches (10.0%). These declines may have been due to the closure of vehicle dealerships and showrooms required by the COVID-19 lockdowns. (RAC Foundation, 2020; Department for Transport, June 2023)
- In the fourth quarter of 2020, there were approximately 31,696,000 licensed cars, 1,273,800 licensed motorcycles, 485,900 licensed heavy goods vehicles (HGVs), 4,220,400 licensed light goods vehicles and 136,700 licensed buses and coaches in Great Britain. (Department for Transport (DfT) and Driver and Vehicle Licensing Agency (DVLA), December 2023)
- In Great Britain, vans are the fastest growing category of vehicles. In 2020, van traffic made up around 16% of total traffic, compared with 10% in 1993. There was an 89% increase in van miles between 1994 and 2018. The number of licensed vans rose 88% over the same period, from 2.1 to 4.0 million. Therefore, the annual mileage per van remained relatively stable. (RAC Foundation, 2020)
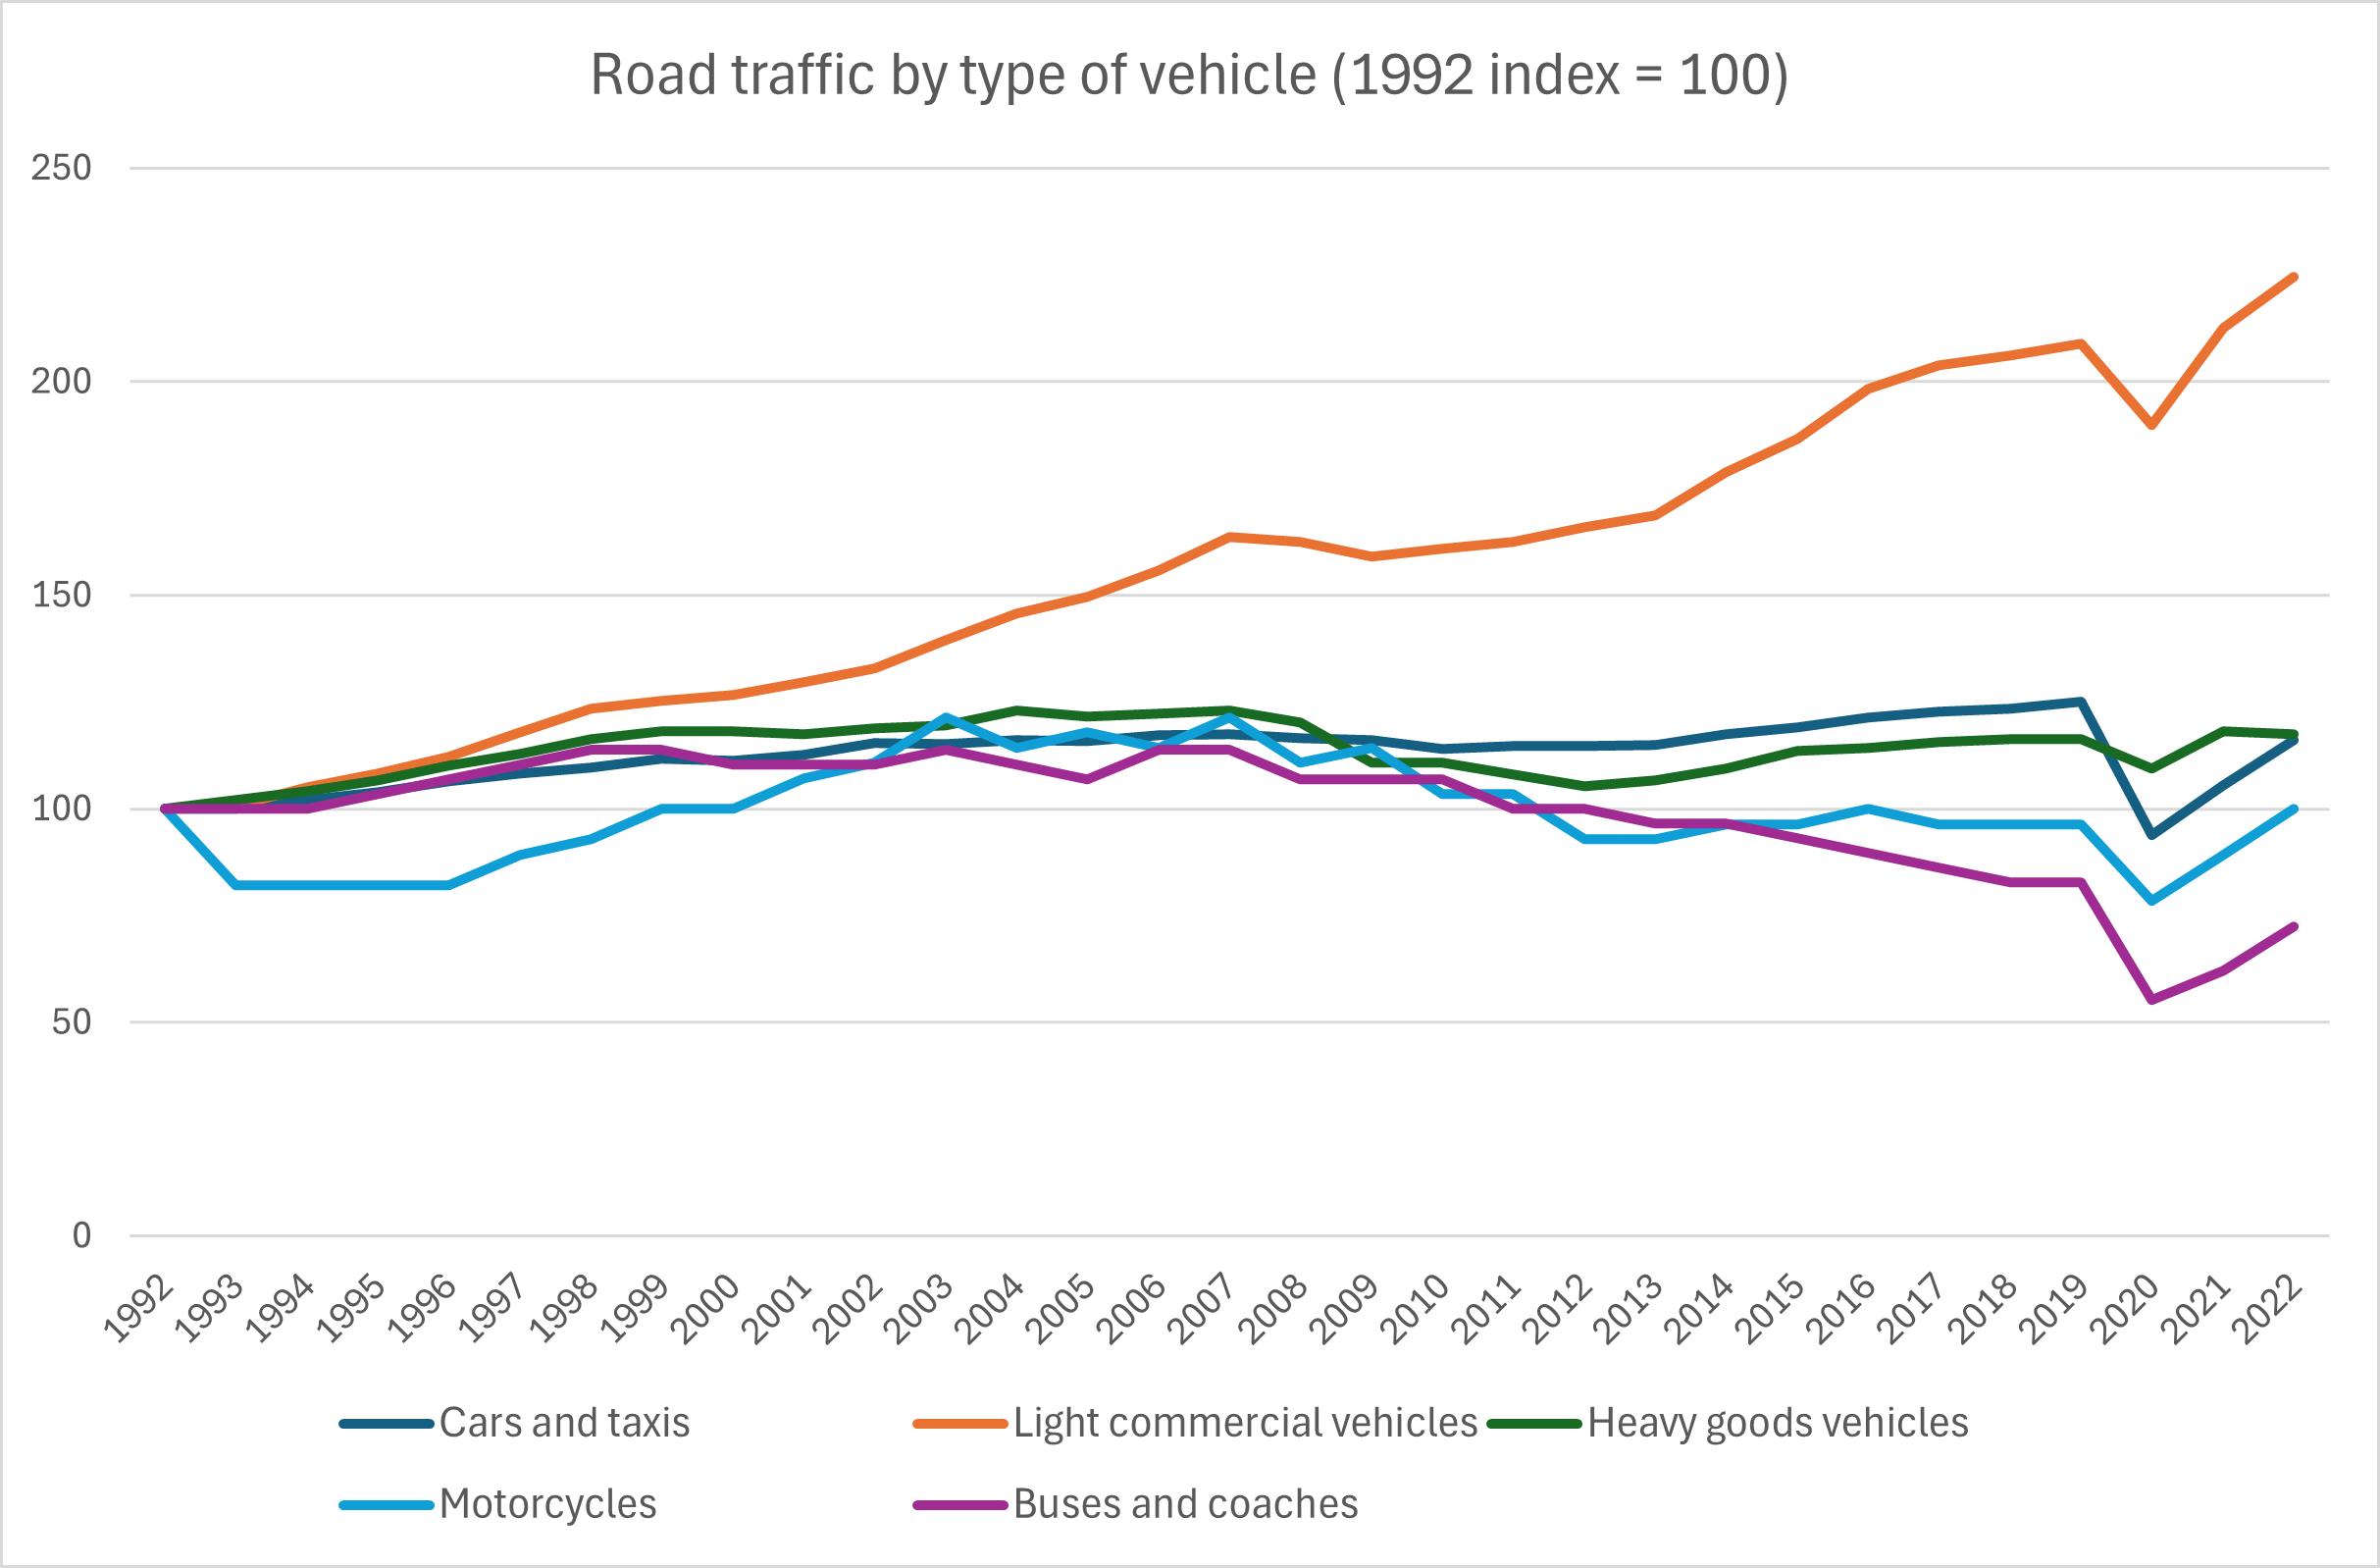
- The following chart shows the trend in vehicle miles for each type of motor vehicle from 1992 through 2022. As can be seen, light commercial vehicles (a category that includes vans and pickup trucks) enjoyed the greatest percentage growth in vehicle miles, an increase of 124.6% since 1992. Even the difficult year in 2020 did not negate that growth very much, and recovery by 2022 was strong. On the other hand, in 2020, the road traffic of cars and taxis and motorcycles declined to below the levels reached in 1992. By 2019, road traffic of buses and coaches had already declined to below the level reached in 1992. In 2020, the road traffic of buses and coaches declined sharply to a level not seen since before 1949. It has since recovered from this sharp decline, but the longer-term decline in bus road traffic has not abated. (Department for Transport, July 2023)
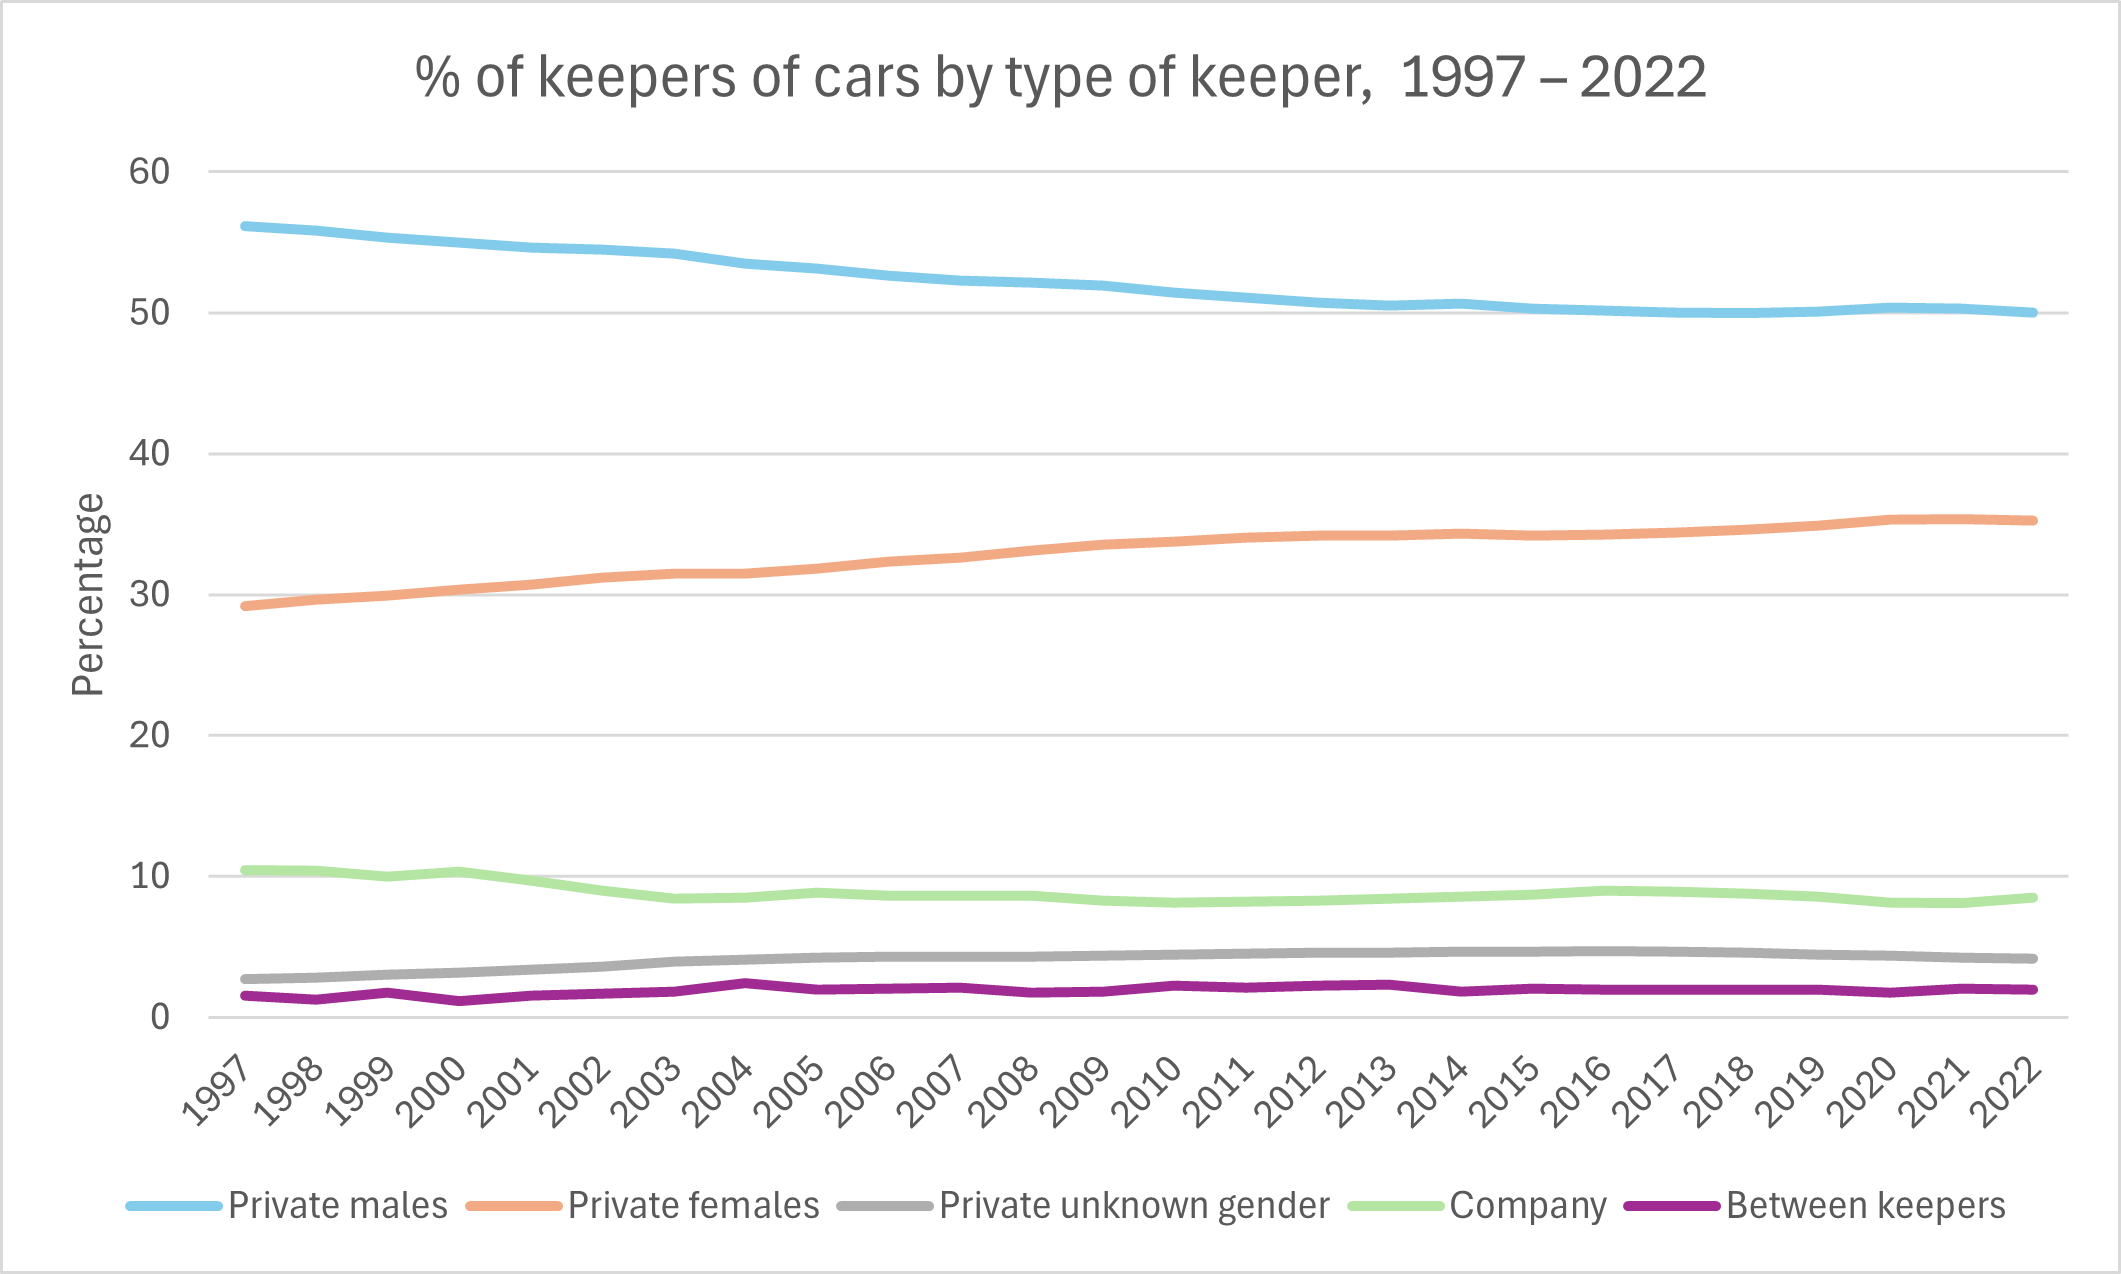
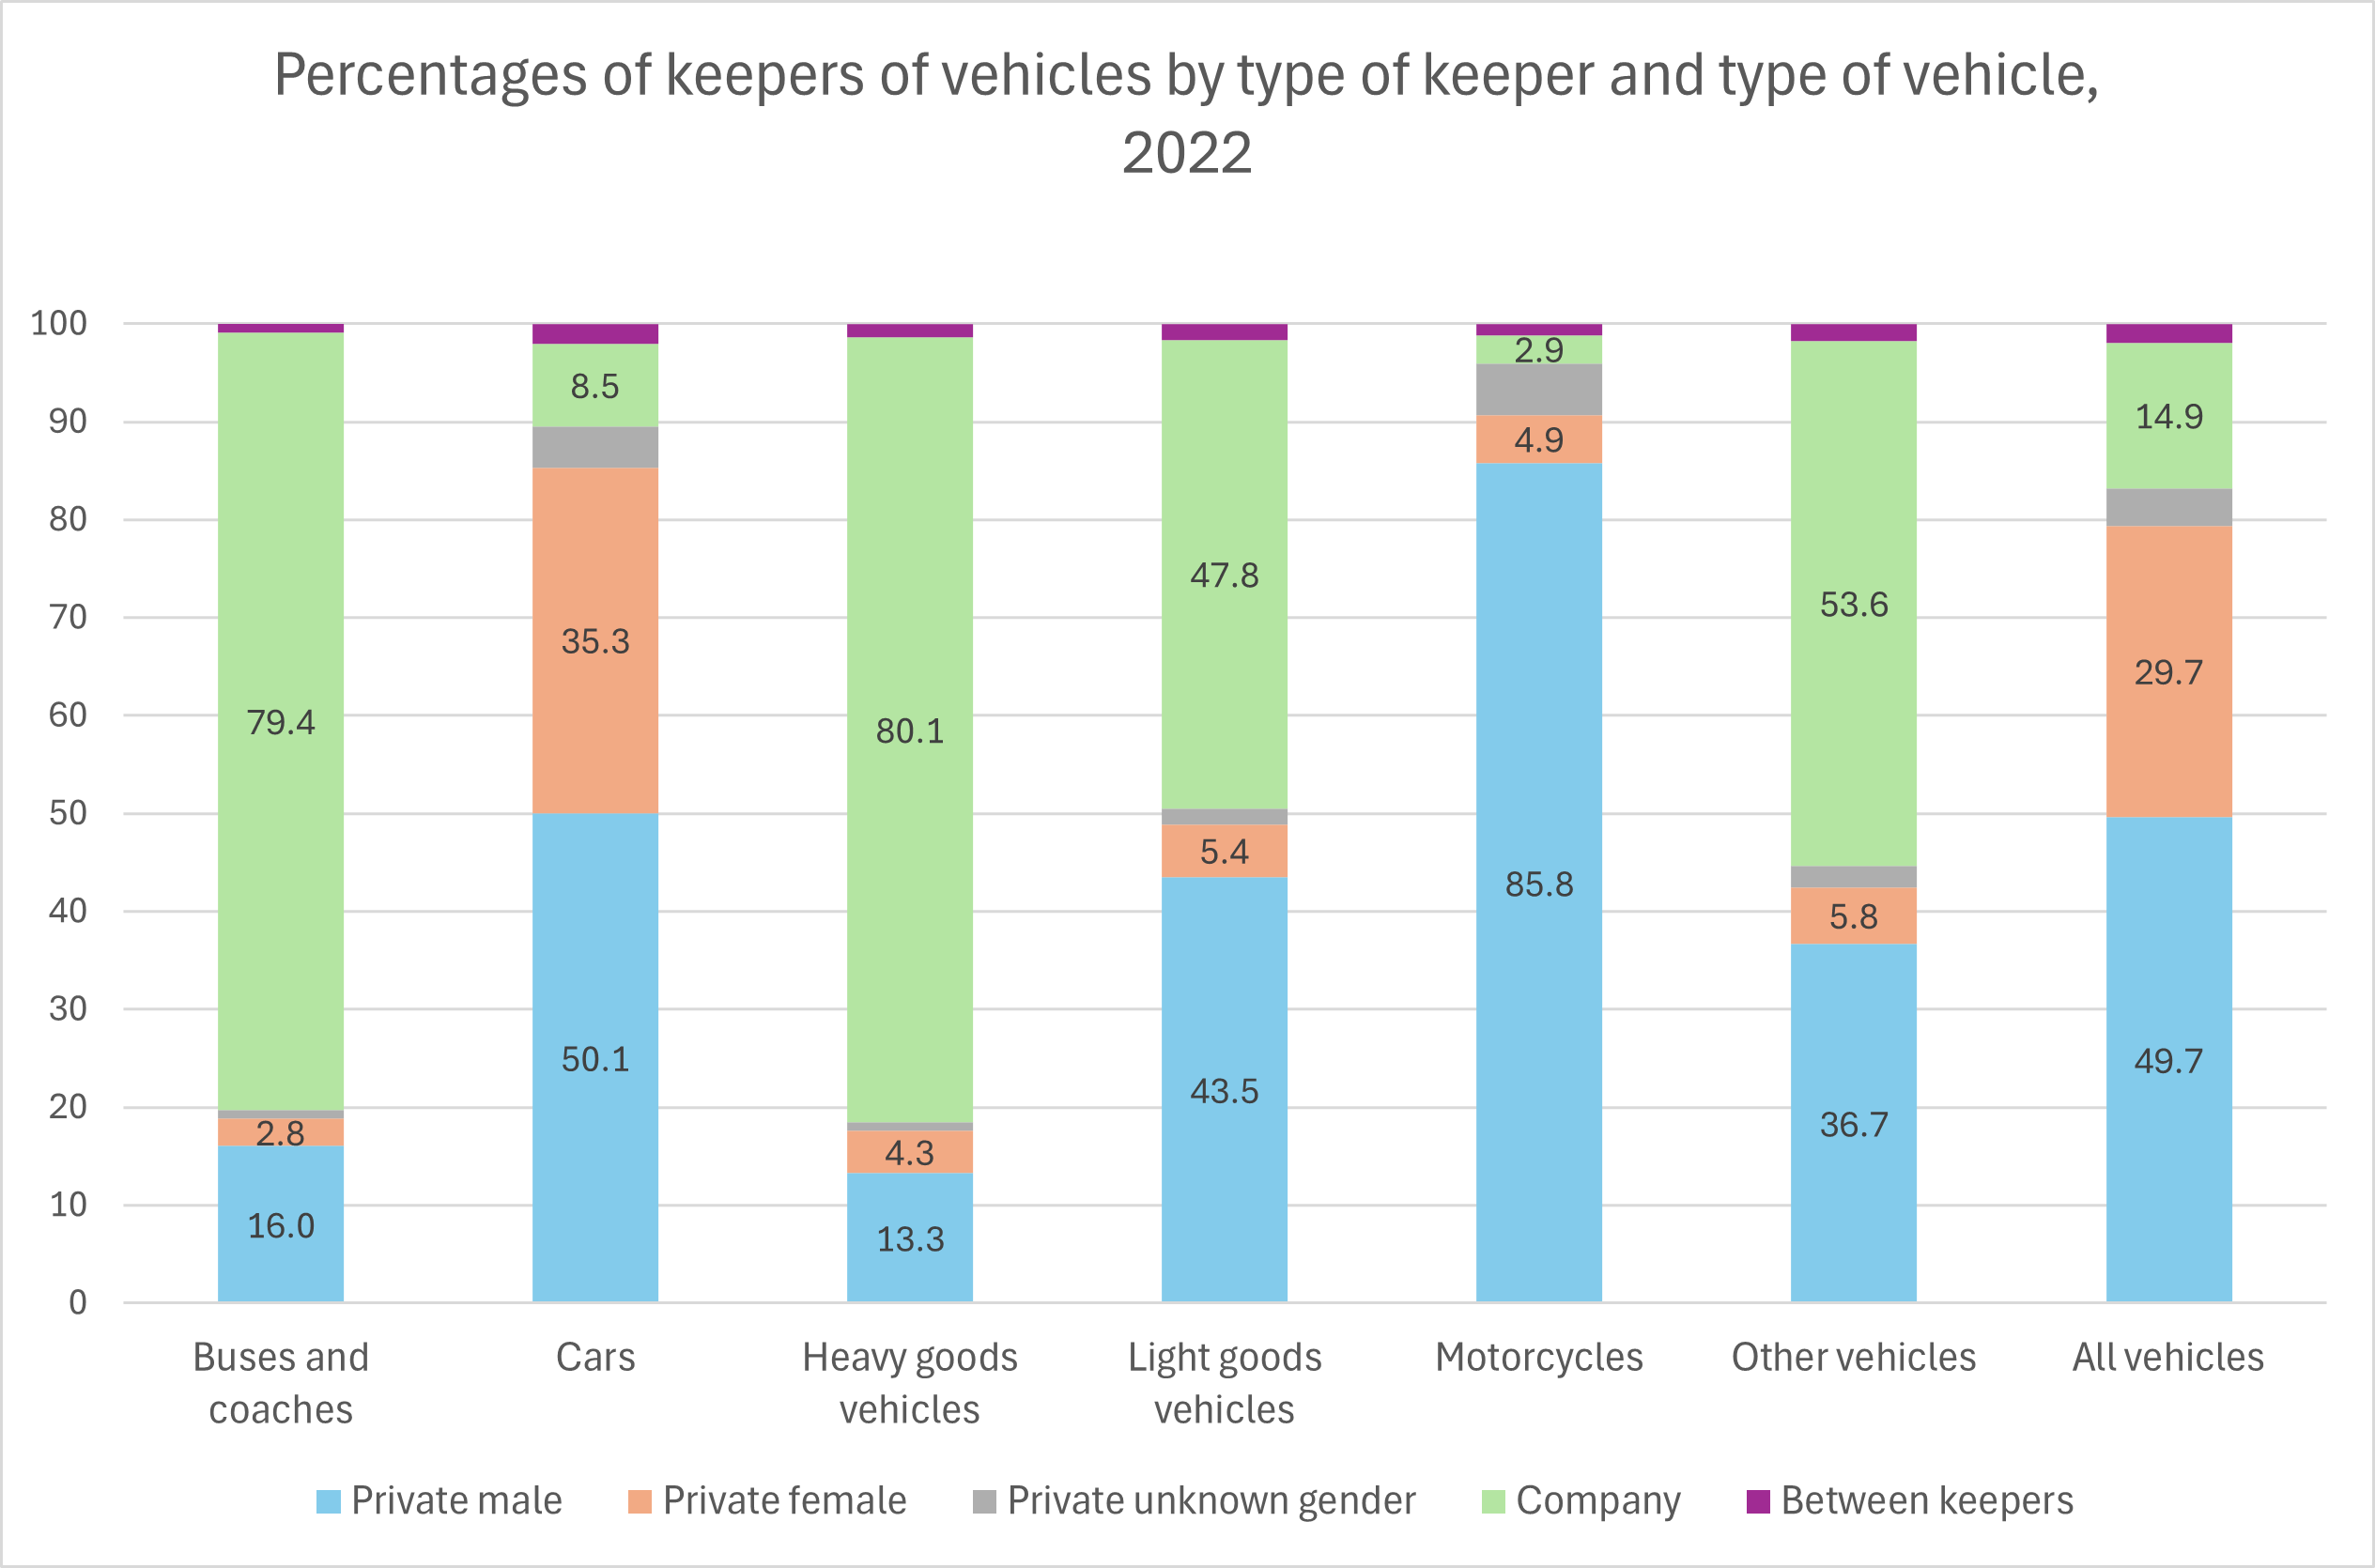
- In Great Britain in December 2022, about 35.3% of registered keepers of licensed cars and 29.7% of registered keepers of all licensed vehicles were private females. On the other hand, about 85.8% of registered keepers of licensed motorcycles were private males. In particular, the proportion of female registered keepers of licensed cars increased from 29.2% of cars in 1997 to 35.3% in 2022. See the following two charts. (Department for Transport, June 2023)
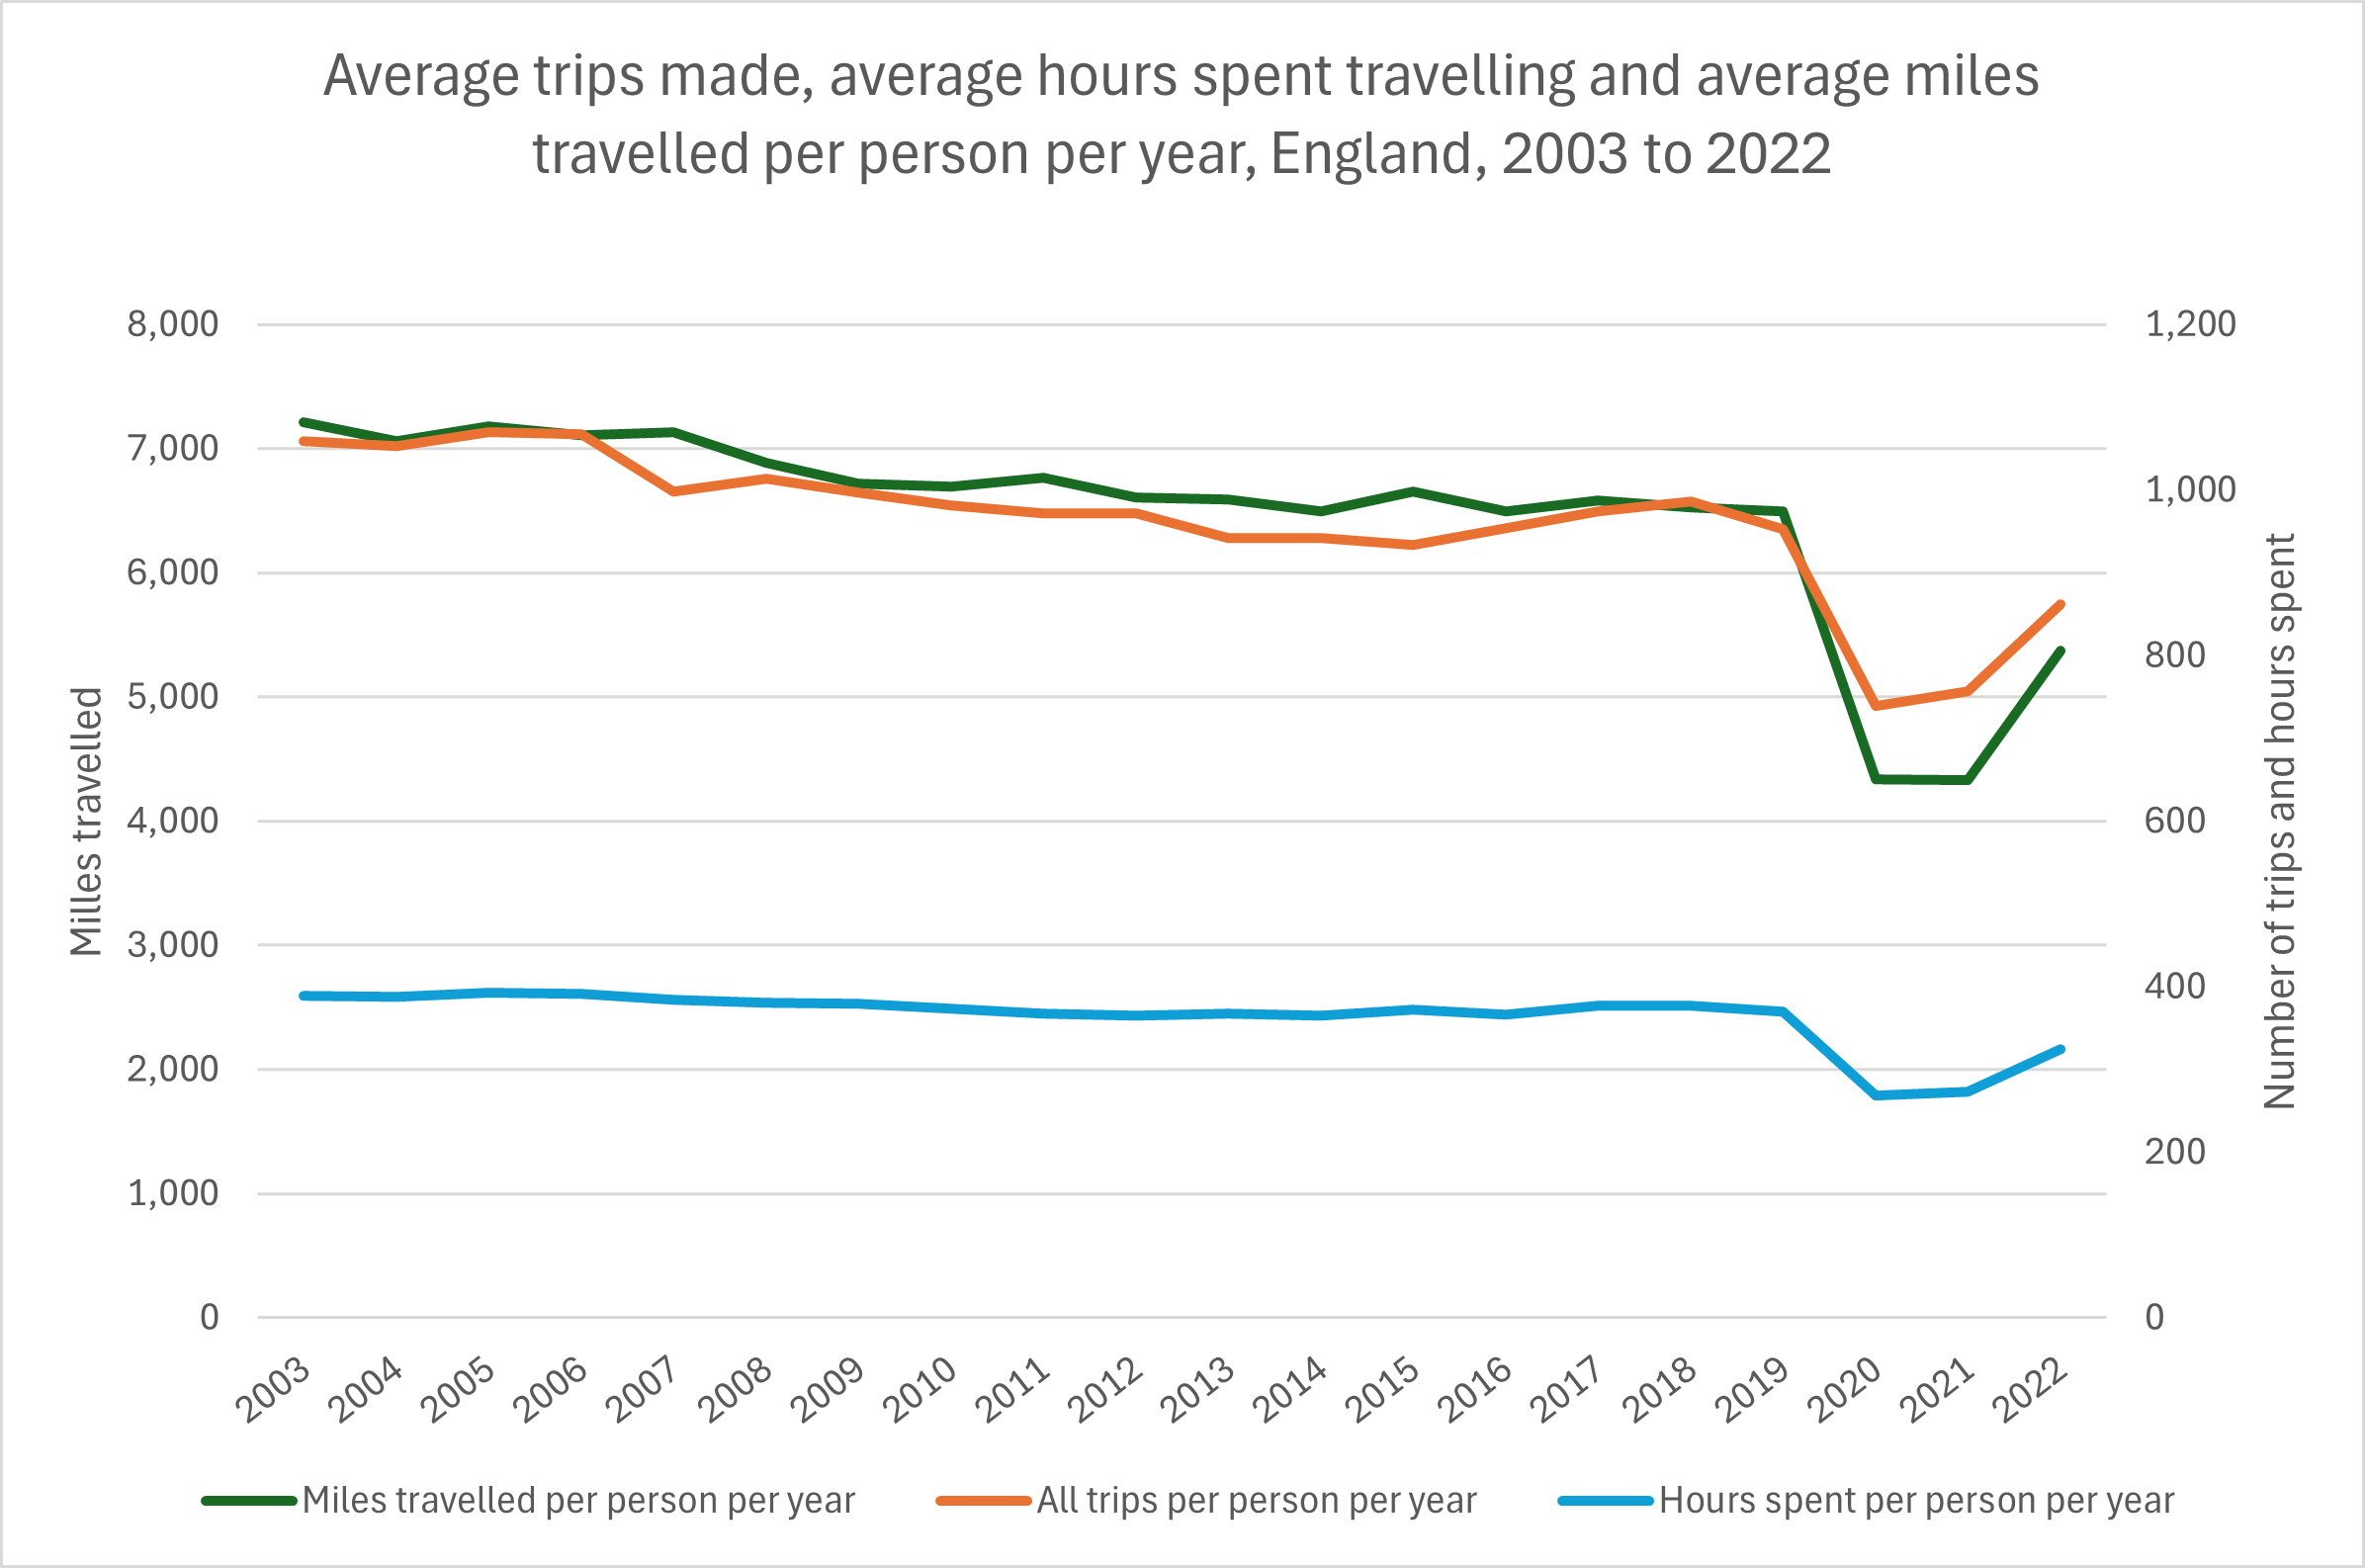
- In England from 2003 to 2019, there were gradual declines in the average number of trips made per person each year (from 1,060 in 2003 down to 953 in 2019) and the average total distance spent travelling per person each year (from 7,211 miles in 2003 down to 6,500 miles in 2019). There was also a slight decline in the average total time spent travelling per person each year (from 389 hours in 2003 down to 370 hours in 2019). In 2020, all these measures declined sharply during the COVID pandemic (by 22.4%, 33.3% and 27.2% respectively). By 2022, however, a partial recovery had taken place. See the following chart. (National Travel Survey, Department for Transport, August 2023)
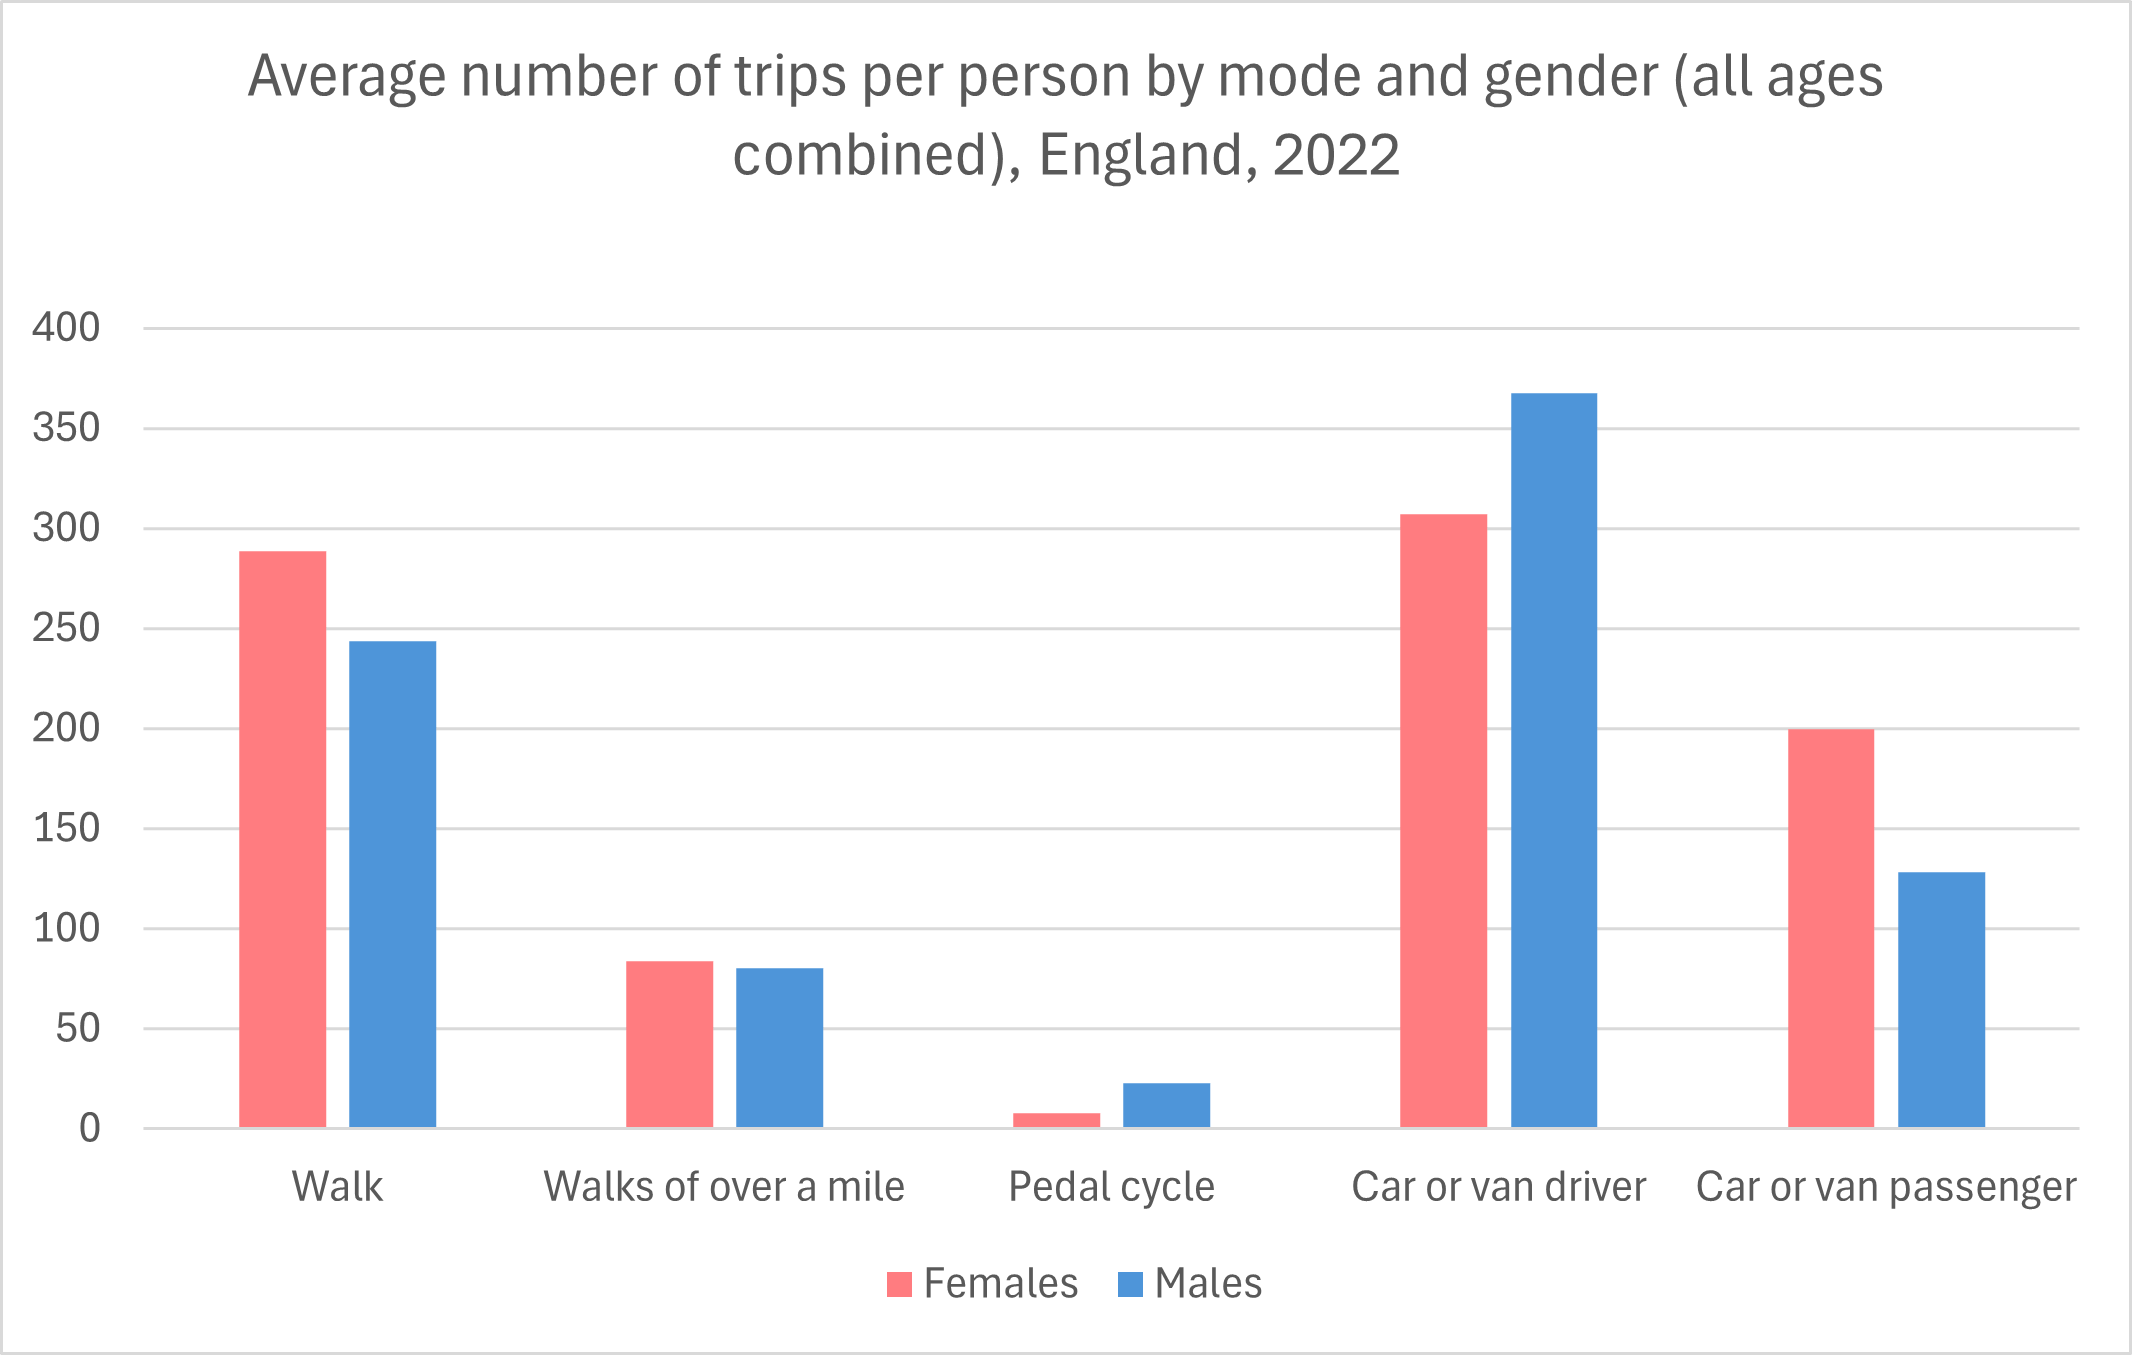
- In England in 2022, females made more trips by walking or as passengers in cars or vans than males did. On the other hand, males made more trips as drivers of cars or vans and pedal cyclists than females did. Males made an average of 367.3 trips as drivers – slightly more than one per day. See the following chart. (National Travel Survey, Department for Transport, August 2023)
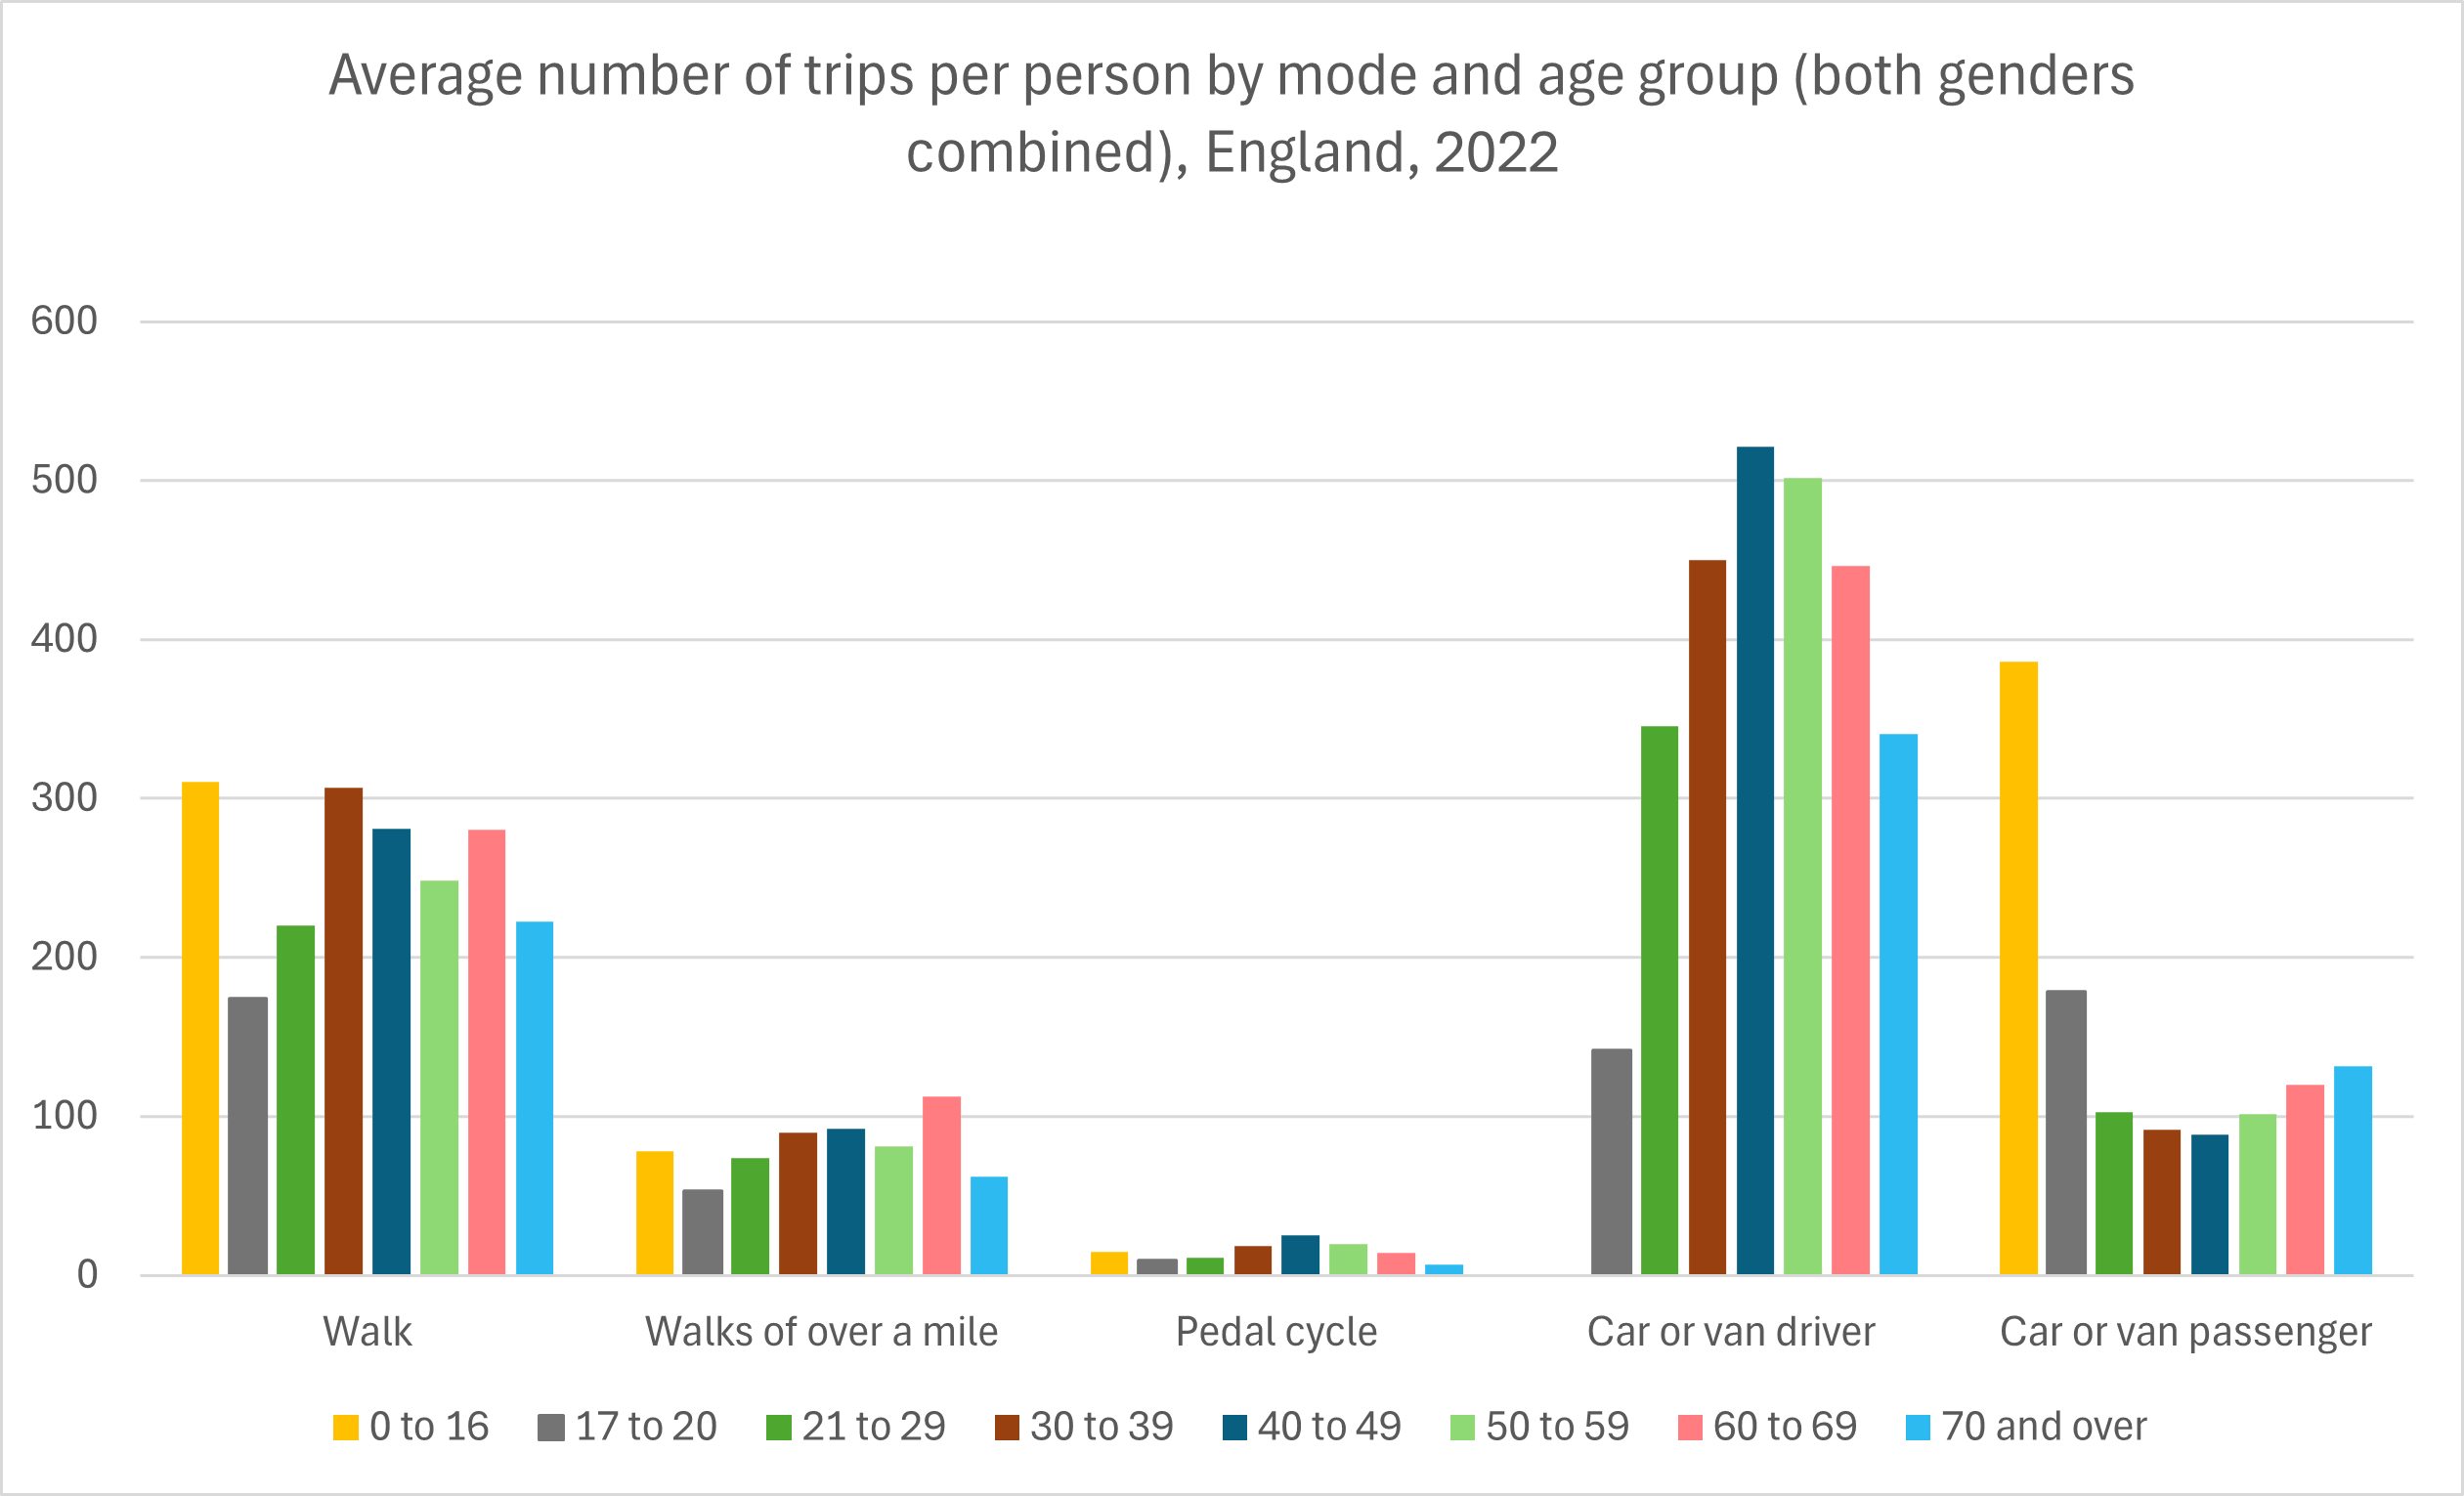
- In England in 2022, as might be expected, children made more trips by walking and far more trips as passengers than did persons in any other age groups. Persons aged 40 to 49 made more trips as drivers or pedal cyclists than persons in any other age groups did, although they made 20.7 times as many trips as drivers than as pedal cyclists. They made an average of 521.1 trips as drivers – more than one per day. They also made fewer trips as passengers than did persons in any other age groups. For age groups older than 49, the number of trips as passengers increased. Persons aged 60 to 69 also made more walks of over a mile than did persons in any other age groups. See the following chart. (National Travel Survey, Department for Transport, August 2023)
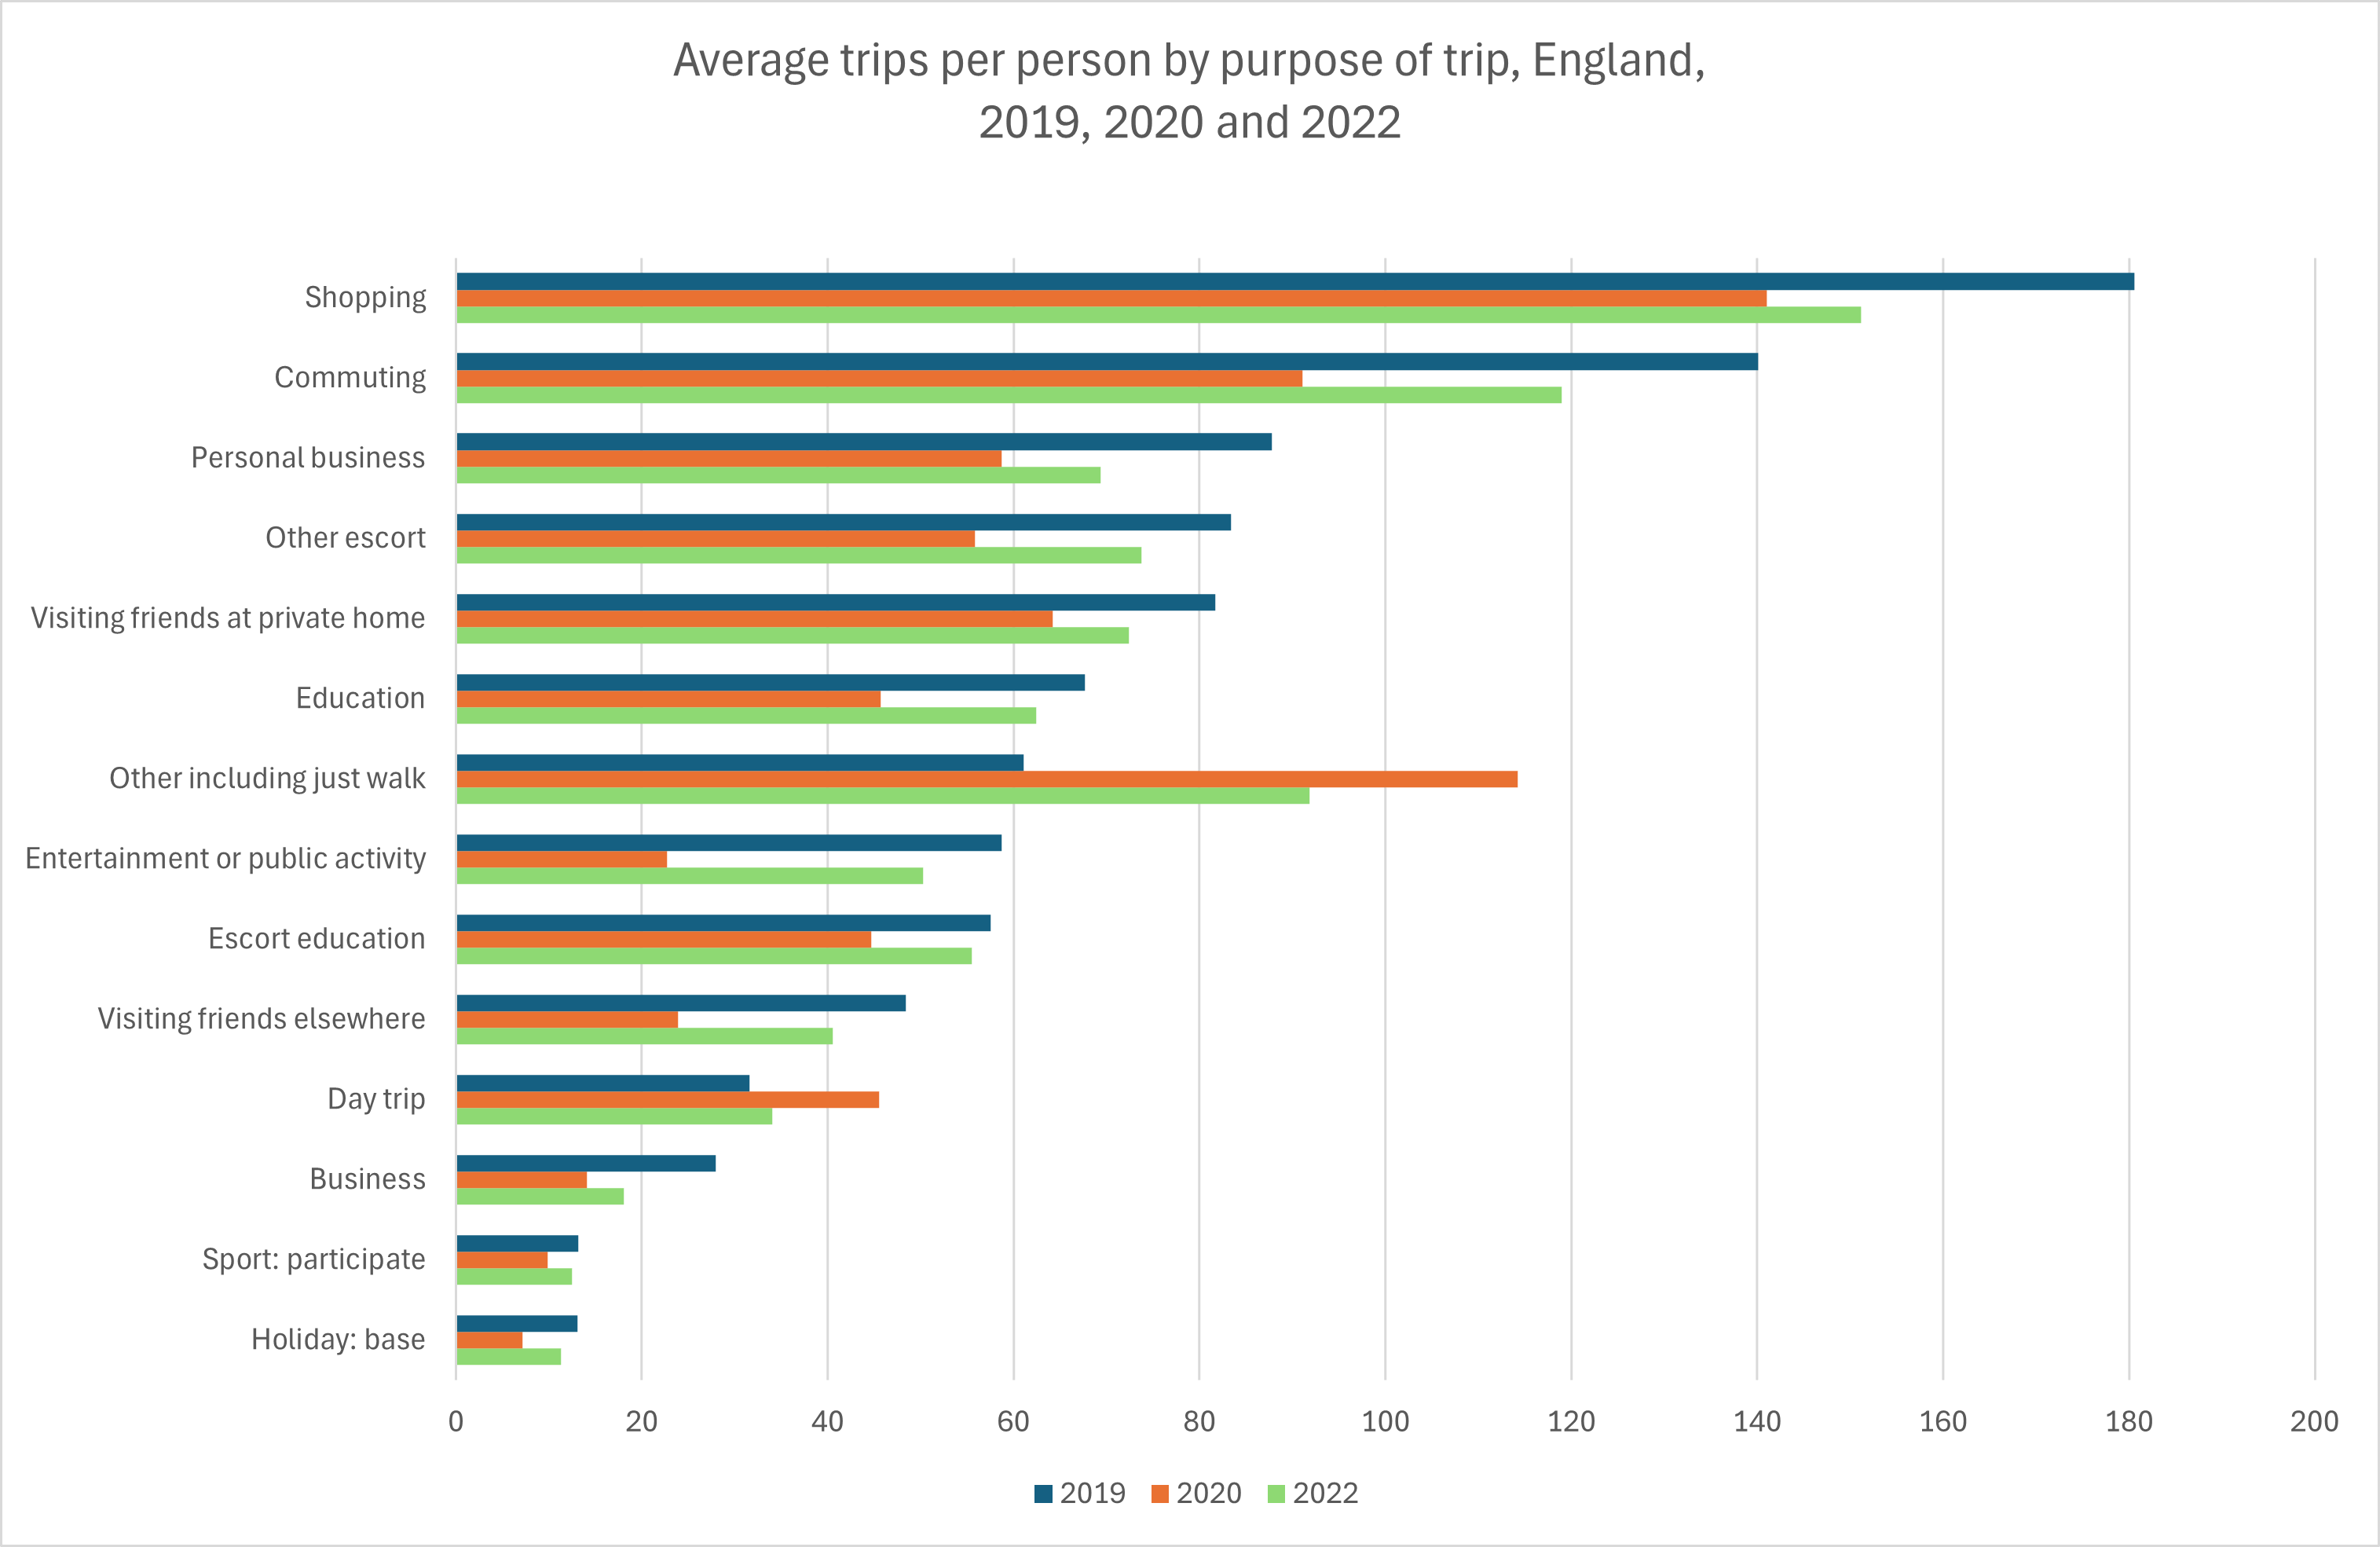
- In England in 2019, the most common purposes of trips were for shopping (an average of 181 trips per person), commuting (140 trips per person), personal business (88 trips per person), escorting for non-educational purposes (83 trips per person), and visiting friends at a private home (82 trips per person). In 2020 during the COVID pandemic, the number of trips decreased for all purposes with the exceptions of day trips (up 44%) and walks for no particular purpose (up 87%). There were particularly sharp decreases in the numbers of trips for entertainment (down 61%), visiting friends elsewhere than private homes (down 50%), business (down 49%), and holiday (down 45%). By 2022, the numbers of trips made had largely recovered to their 2019 levels. However, even in 2022, the numbers of trips taken for business (down 35% from 2019), personal business (down 21%), shopping (down 16%), and visiting friends elsewhere than private homes (also down 16%) remained significantly depressed. On the other hand, persons in 2022 were still going on more walks and day trips than they did in 2019. See the following chart. (National Travel Survey, Department for Transport, August 2023)
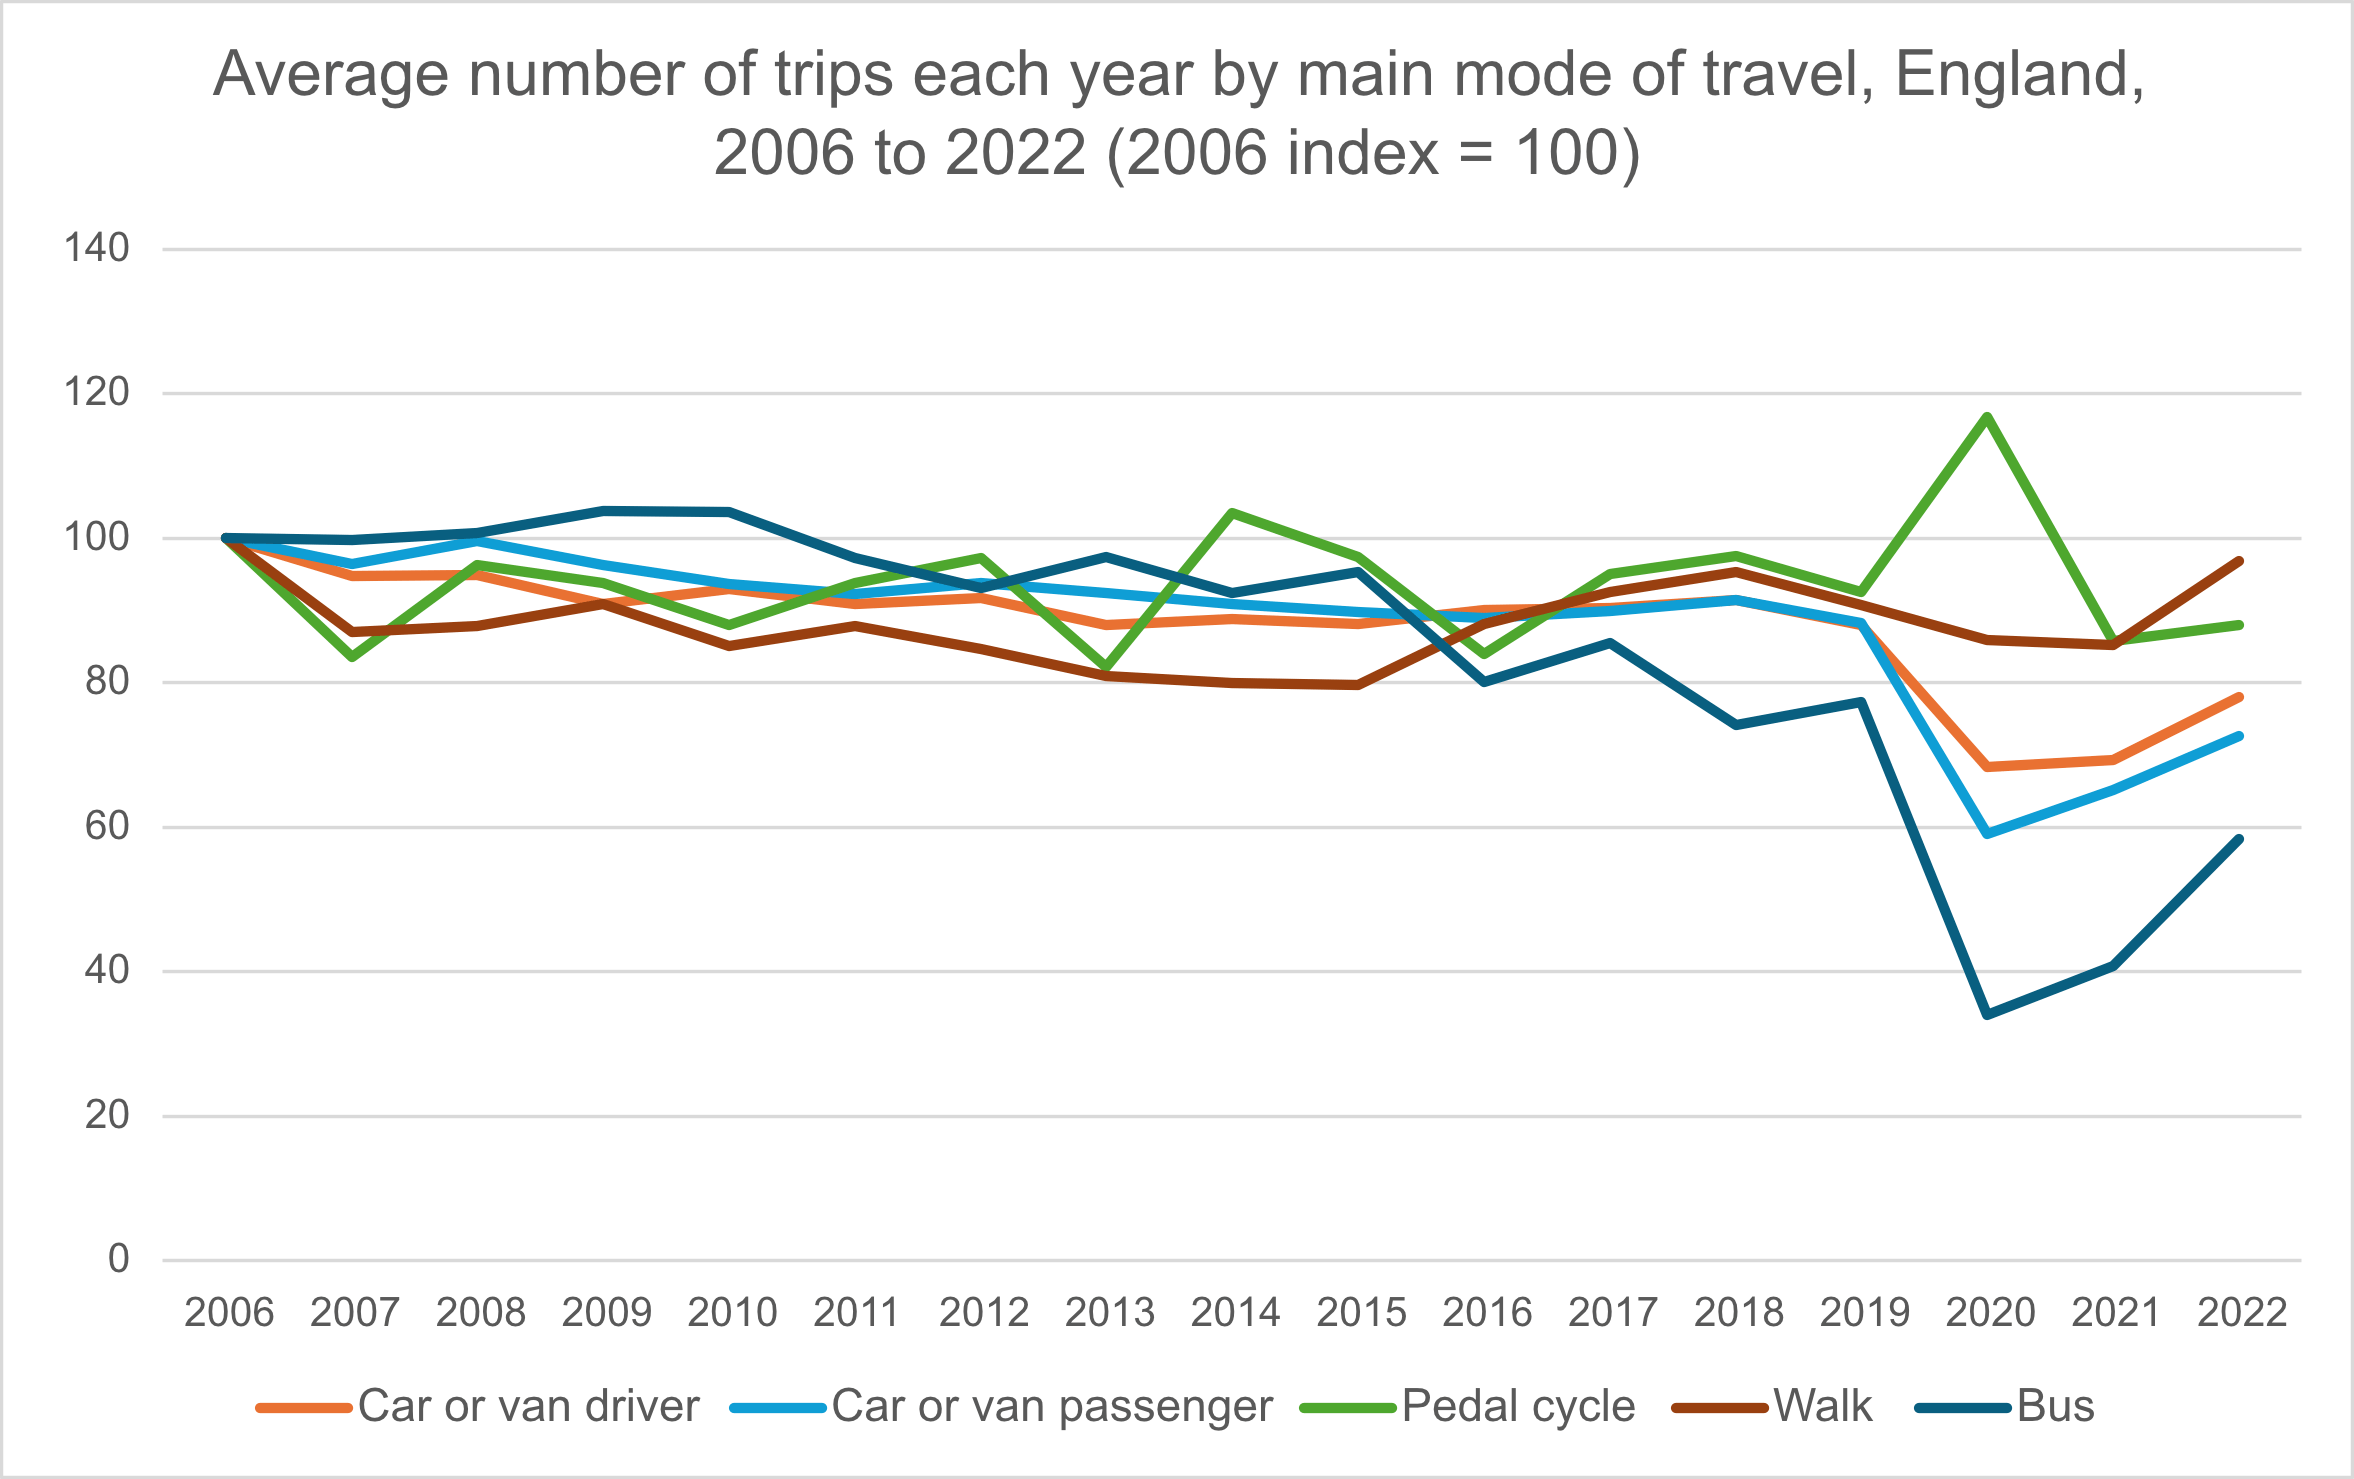
- The pandemic years of 2020 and 2021 also saw some changes to the relative frequency of use of various modes of travel. In 2020, compared with travel in 2006, there were 17% more trips by pedal cycle, but 32% fewer trips made as a car or van driver, 41% fewer trips made as a car or van passenger, and 66% fewer trips made by bus. See the following chart. Trips made as a car driver had recovered at least partially by 2022, but trips by bus had still not recovered. (National Travel Survey, Department for Transport, August 2023)
- In Great Britain in November 2023, there were 51,862,161 driving licences registered with DVLA. Of these, 41,995,944 were full driving entitlement licences and 9,866,217 were provisional entitlement licences. (Note, however, that these figures may not accurately reflect the number of active licence holders because the figures include licence holders who had died or emigrated from Great Britain but who have not been removed from the DVLA database.) (RAC Foundation, December 2023)
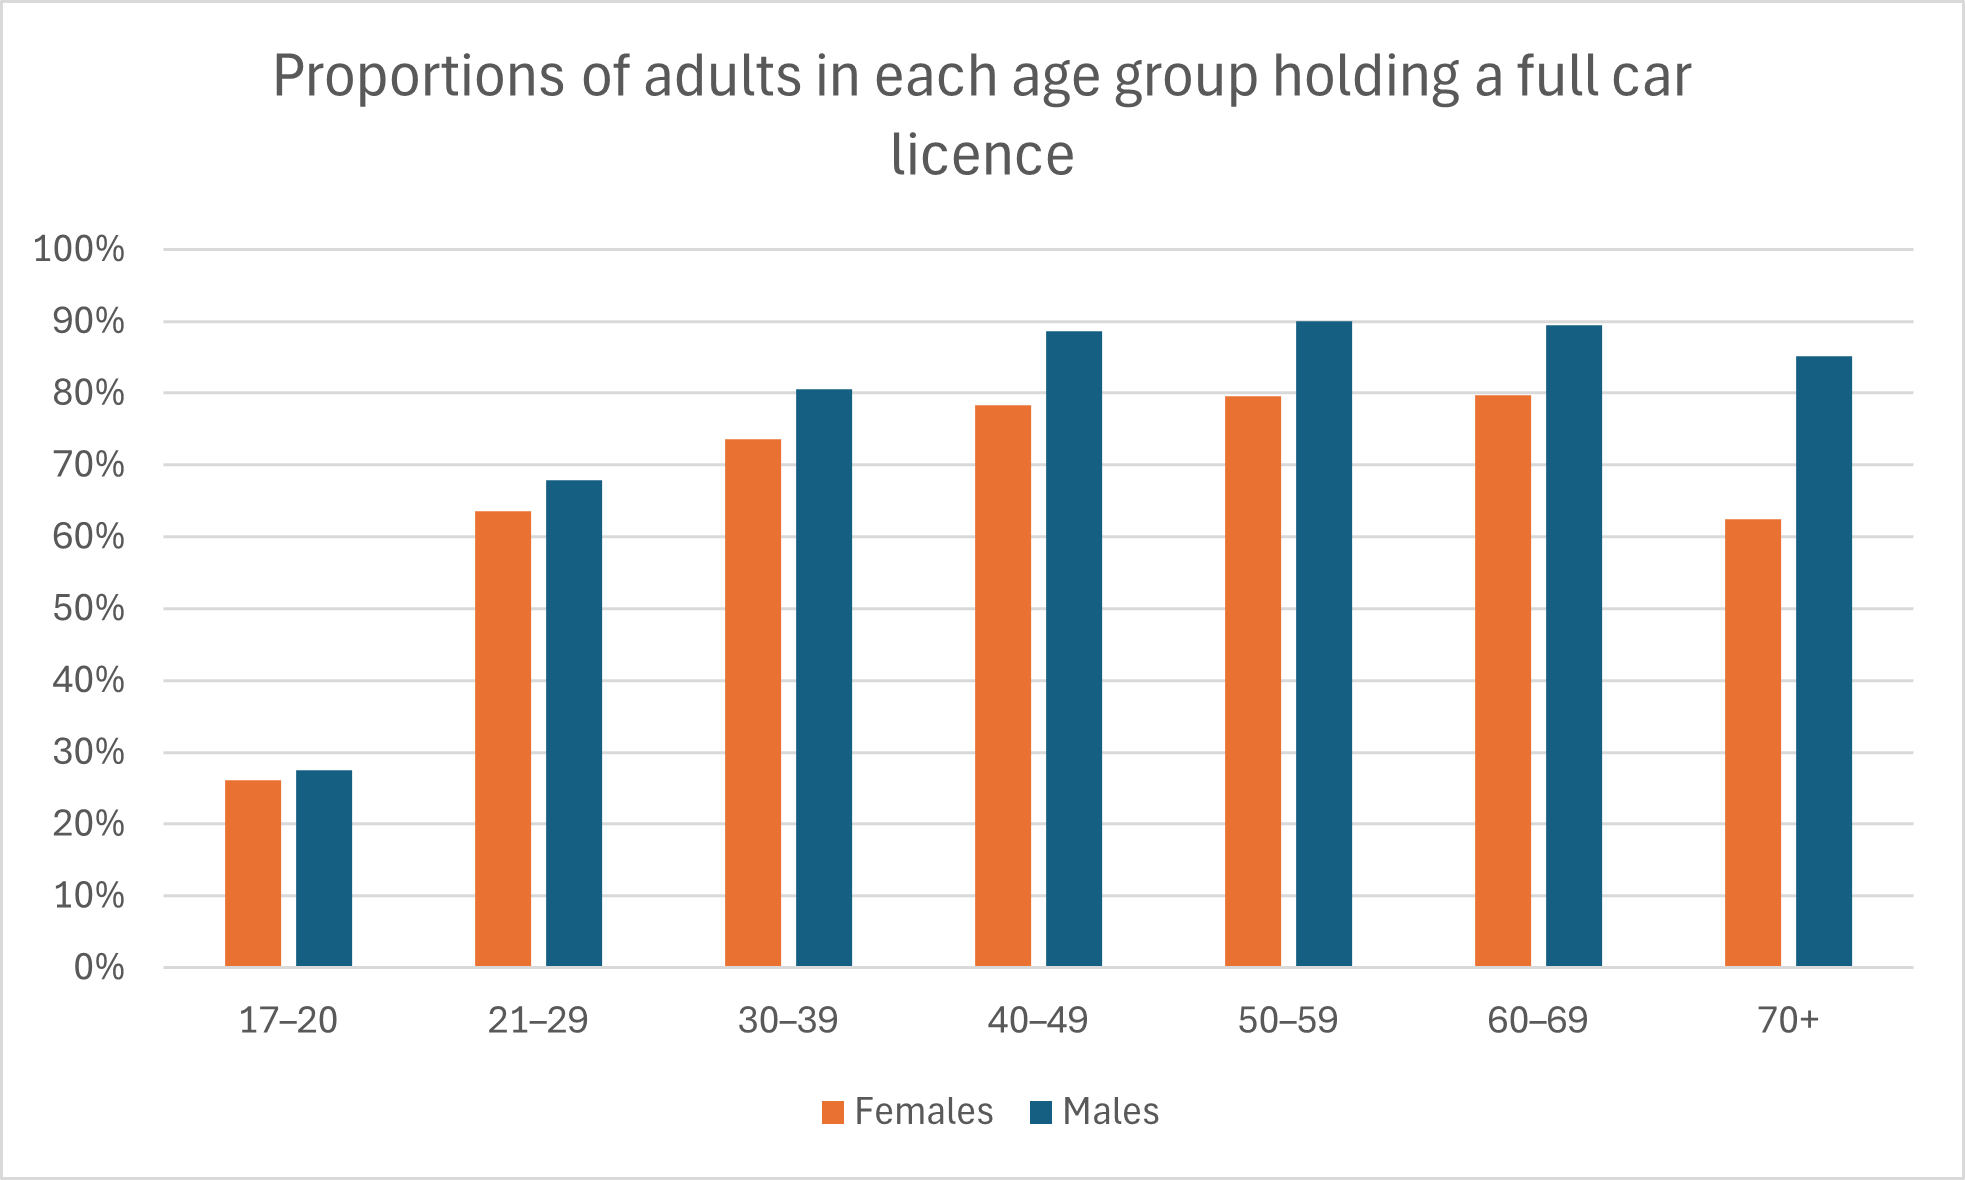
- In England in 2022, 75% of all adults aged 17 and over (including 81% of all male adults and 71% of all female adults) held a full car driving licence. 27% of persons aged 17–20 held a full car driving licence. 85% of persons aged 50–59 held a driving licence, the highest percentage of any age group. 73% of persons aged 70 or older held a driving licence. (National Travel Survey, Department for Transport, December 2023)
- In England in 2022, there were an estimated 34.62 million people aged 17 or older who held a full car driving licence. Of these licence holders, an estimated 17.96 million (51.9%) were male and an estimated 16.67 million (48.1%) were female. Licence holding among both men and women has increased since 1975–76, but the rate of increase has been greater for women. In 1975–76, 68.9% of men and 31.1% of women held a driving licence. (RAC Foundation, 2020; National Travel Survey, Department for Transport, December 2023)
- The difference between the proportion of male licence holders and the proportion of female licence holders tended to be greater for older drivers. For persons aged 17–20, the proportions were nearly identical: 27% of males and 26% of females held a driving licence. But for persons aged 70 or older, 85% of males and 62% of females held a licence. See the following chart. (National Travel Survey, Department for Transport, December 2023)
- In England, between 2003 and 2022, the proportion of people aged 70 or older who held a driving licence increased from 44% to 73%. This was due to the aging of existing licence holders, not an influx of newly qualified drivers in older age groups. The increase among older women is particularly significant: 80% of women aged 60–69 and 62% of women aged 70 or older held a driving licence in 2022, compared with 58% and 26% respectively in 2003. (RAC Foundation, 2020; National Travel Survey, Department for Transport, December 2023)
- In 2019, there were 5.3 million licence holders in Great Britain who were over 70 years old. 110,000 driving licence holders in Britain were 90–99 years old. And about 300 driving licence holders were 100 years old or older. (BBC News, 2019)
- In Great Britain in March 2023, 5.97 million full driver licence holders were 70 years of age or older. 1.65 million full driver licence holders (about 4% of all adults with full driving licences) were 80 years of age or older. 510 licence holders were 100 years of age or older. The oldest licence holder was 108 years old. (RAC Foundation, March 2023)
- In England in 2022, 44.8% of households owned one car or van, and 33.6% had two or more cars or vans. (National Travel Survey, August 2023)
- As at 31 March 2021, in England, there were 2.35 million valid Blue Badges held, including 824,000 Blue Badges issued in the year ending March 2021. (Department for Transport, January 2022)
- Blue Badge holders rely primarily on cars for transport, as drivers more often than as passengers. Still, Blue Badge holders travel less than non-Blue Badge holders by every mode of transport except taxis and minicabs and ‘other private transport’ (which includes motorised wheelchairs, electric scooters, ambulances, hospital cars, minibuses and private hire buses). See the following chart. Note: In this chart, the mode ‘bus’ includes local buses only. The mode ‘other public transport’ includes non-local buses, air, ferries and light rail.) (National Travel Survey, Department for Transport, January 2022)
- In 2020, the annual National Travel Survey of residents of England found that persons averaged 295 car driver trips, 22% fewer than in 2019; and 134 car passenger trips per person, 33% fewer than in 2019. By 2022, the numbers of trips per person had rebounded somewhat to 337 car driver trips and 165 car passenger trips, but these levels were still below 2019 levels. (National Travel Survey, Department for Transport, September 2021 and December 2023)
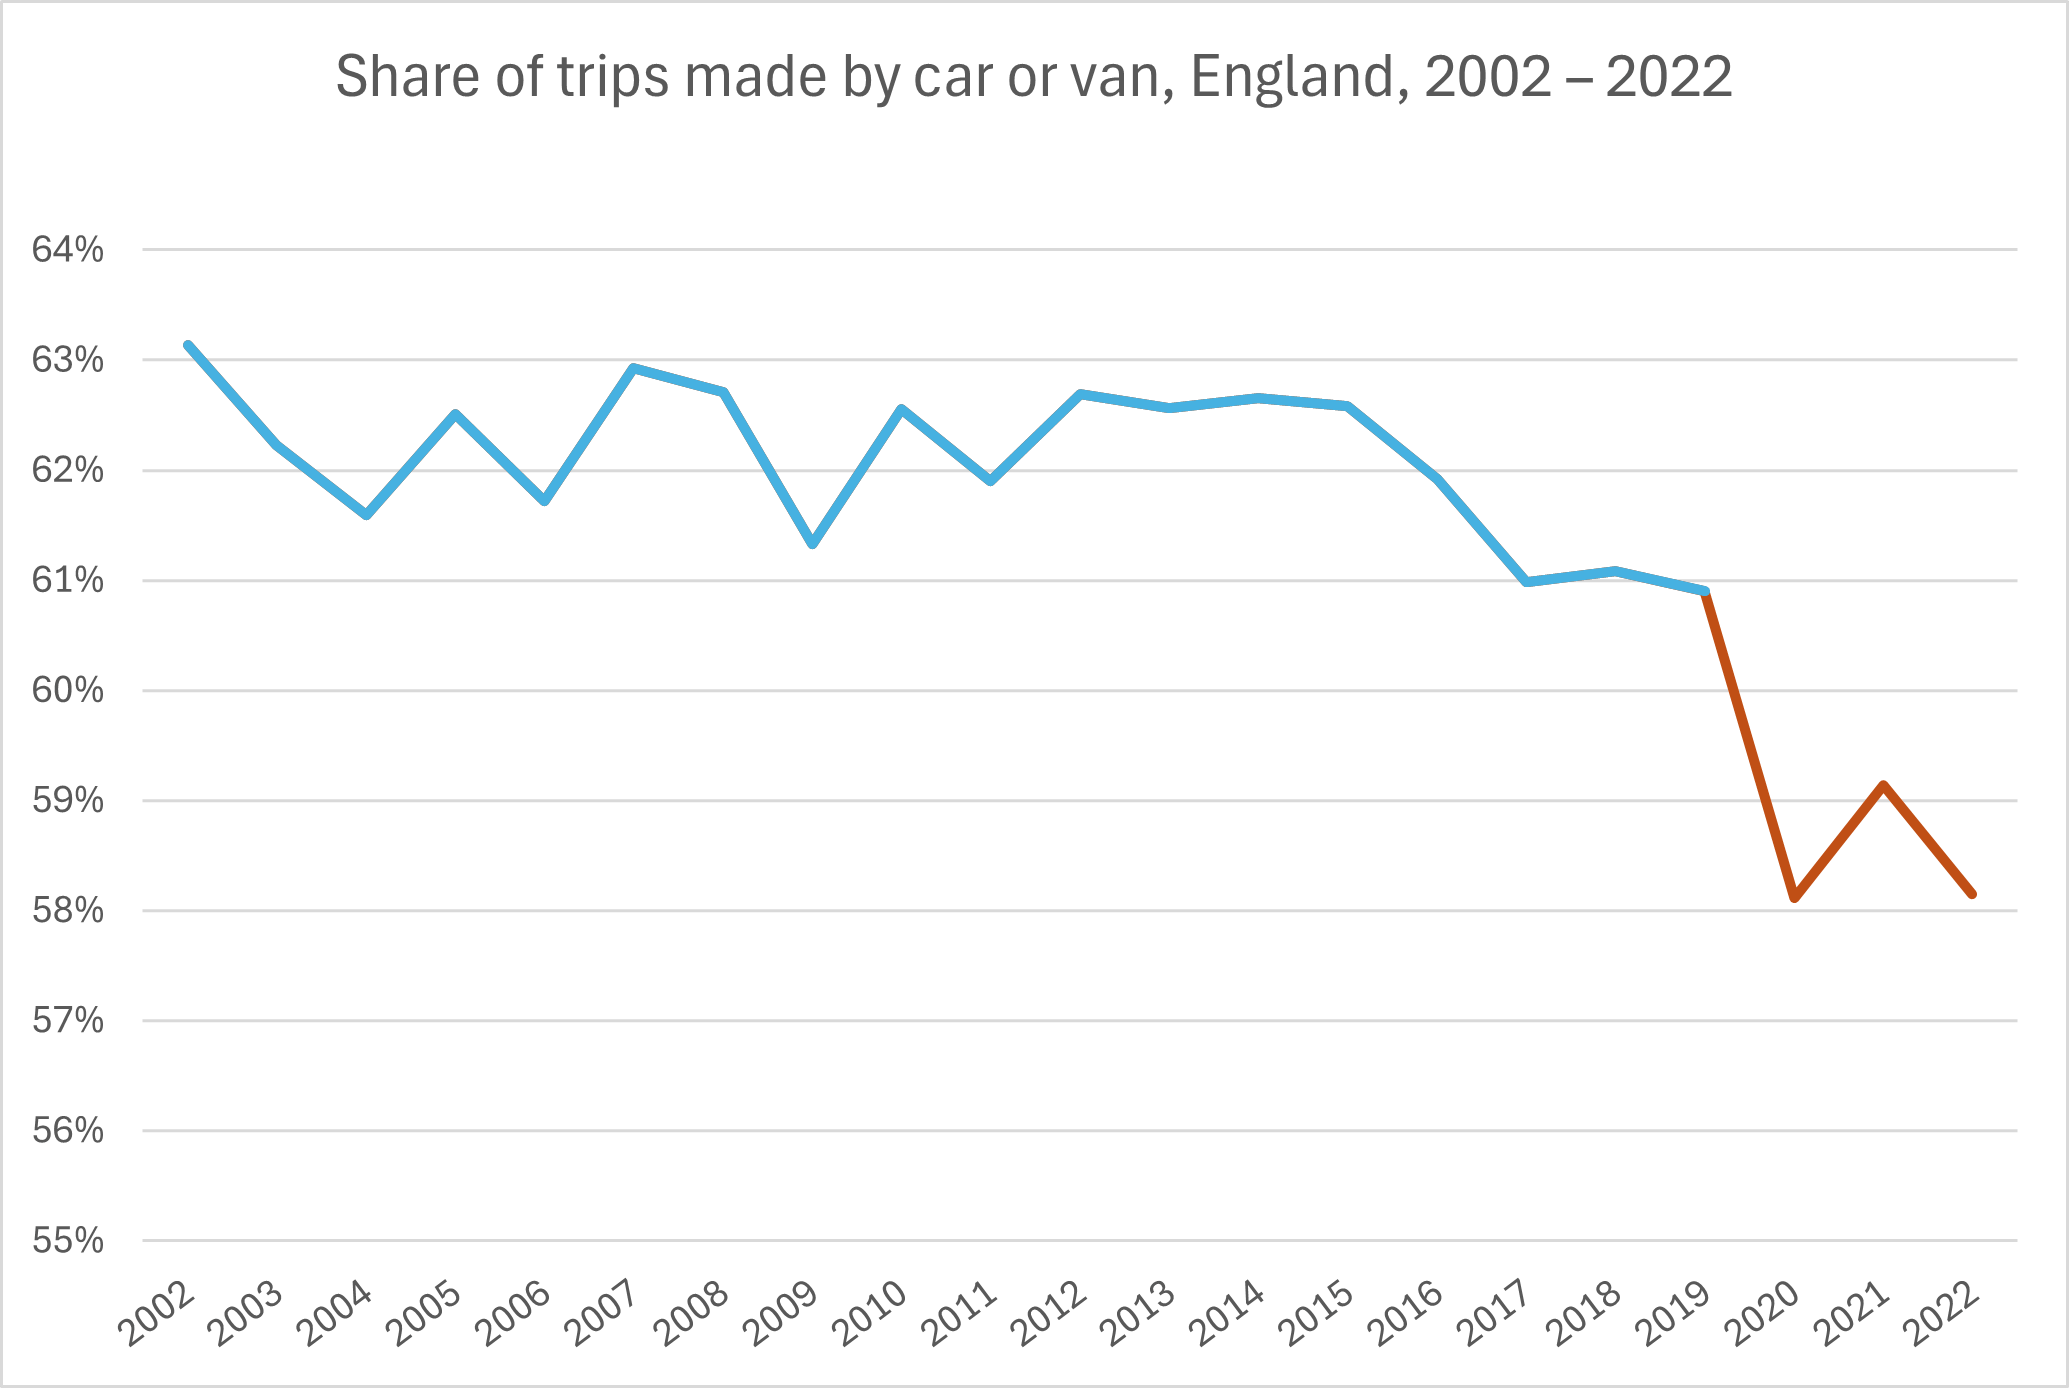
- In England, the share of trips made by car or van, as either the driver or a passenger, had declined very gradually from 63.1% of trips in 2002 to 60.9% of trips in 2019. In 2020 (during the COVID pandemic), this proportion declined to 58.1% of trips and then stabilized to 58.2% of trips in 2022. See the following chart. (National Travel Survey, Department for Transport, December 2023)
- In 2022 in England, car drivers made an average of 337 trips each, and car passengers made an average of 165 trips each. Trips by car accounted for an average of 78.0% of total miles travelled per person that year. In 2019, before the COVID pandemic, travel by car accounted for 77.1% of total miles travelled per person. (National Travel Survey, Department for Transport, December 2023)
- In 2022 in England, 68% of commuters travelled to work by car. In every region of England except London, at least 70% of residents travelled to work by car. Only 32.6% of London residents travelled to work by car. 39.0% of London commuters got to work on foot (walking, jogging, skateboarding, etc.). (RAC Foundation, 2023; National Travel Survey, Department for Transport, December 2023)
- Even in 2019, before the COVID pandemic, only 3.5% of total trips were made by rail (London Underground or surface rail). Even this small percentage declined sharply in 2020 to just 2.1% of total trips and then recovered a bit in 2022 to 2.6% of total trips. (National Travel Survey, Department for Transport, December 2023)
- In 2022, in urban areas other than London, 69% of commuting trips were made by car. In rural areas, 84% of commuting trips were made by car. In rural areas, 73.4% of workers travel by car (whether as a driver or a passenger). In London, which has excellent public transportation, 29.8% of workers still travel by car. In urban areas outside of London, 67.1% of people travel by car (whether as a driver or a passenger). (RAC Foundation, 2020)
- In the UK, over 1.4 million people use motorcycles, mopeds and scooters, travelling about 4.4 billion miles per year. (Lexham Insurance Consultants Ltd, 2015)
- In the UK in 2019, there were 65,800 registered mopeds (motorcycles up to 50 cc), 276,400 registered light motorcycles (up to 125 cc), and 928,200 registered large motorcycles (up to 1,000 cc). (Department for Transport, 2020)
- In the UK in 2019 Q4, cars accounted for 82.4% of registered vehicles, light goods vehicles for 10.6%, motorcycles for 3.2%, heavy goods vehicles for 1.3%, and buses and coaches for 0.4%. The remaining 2.0% of registered vehicles included a variety of vehicles, such as rear diggers, lift trucks, rollers, ambulances, and taxis (hackney carriages). (Department for Transport, 2020)
- In 2019 Q4, there were 525,800 heavy goods vehicles registered and 4,246,300 light goods vehicles registered. (Department for Transport, 2020)
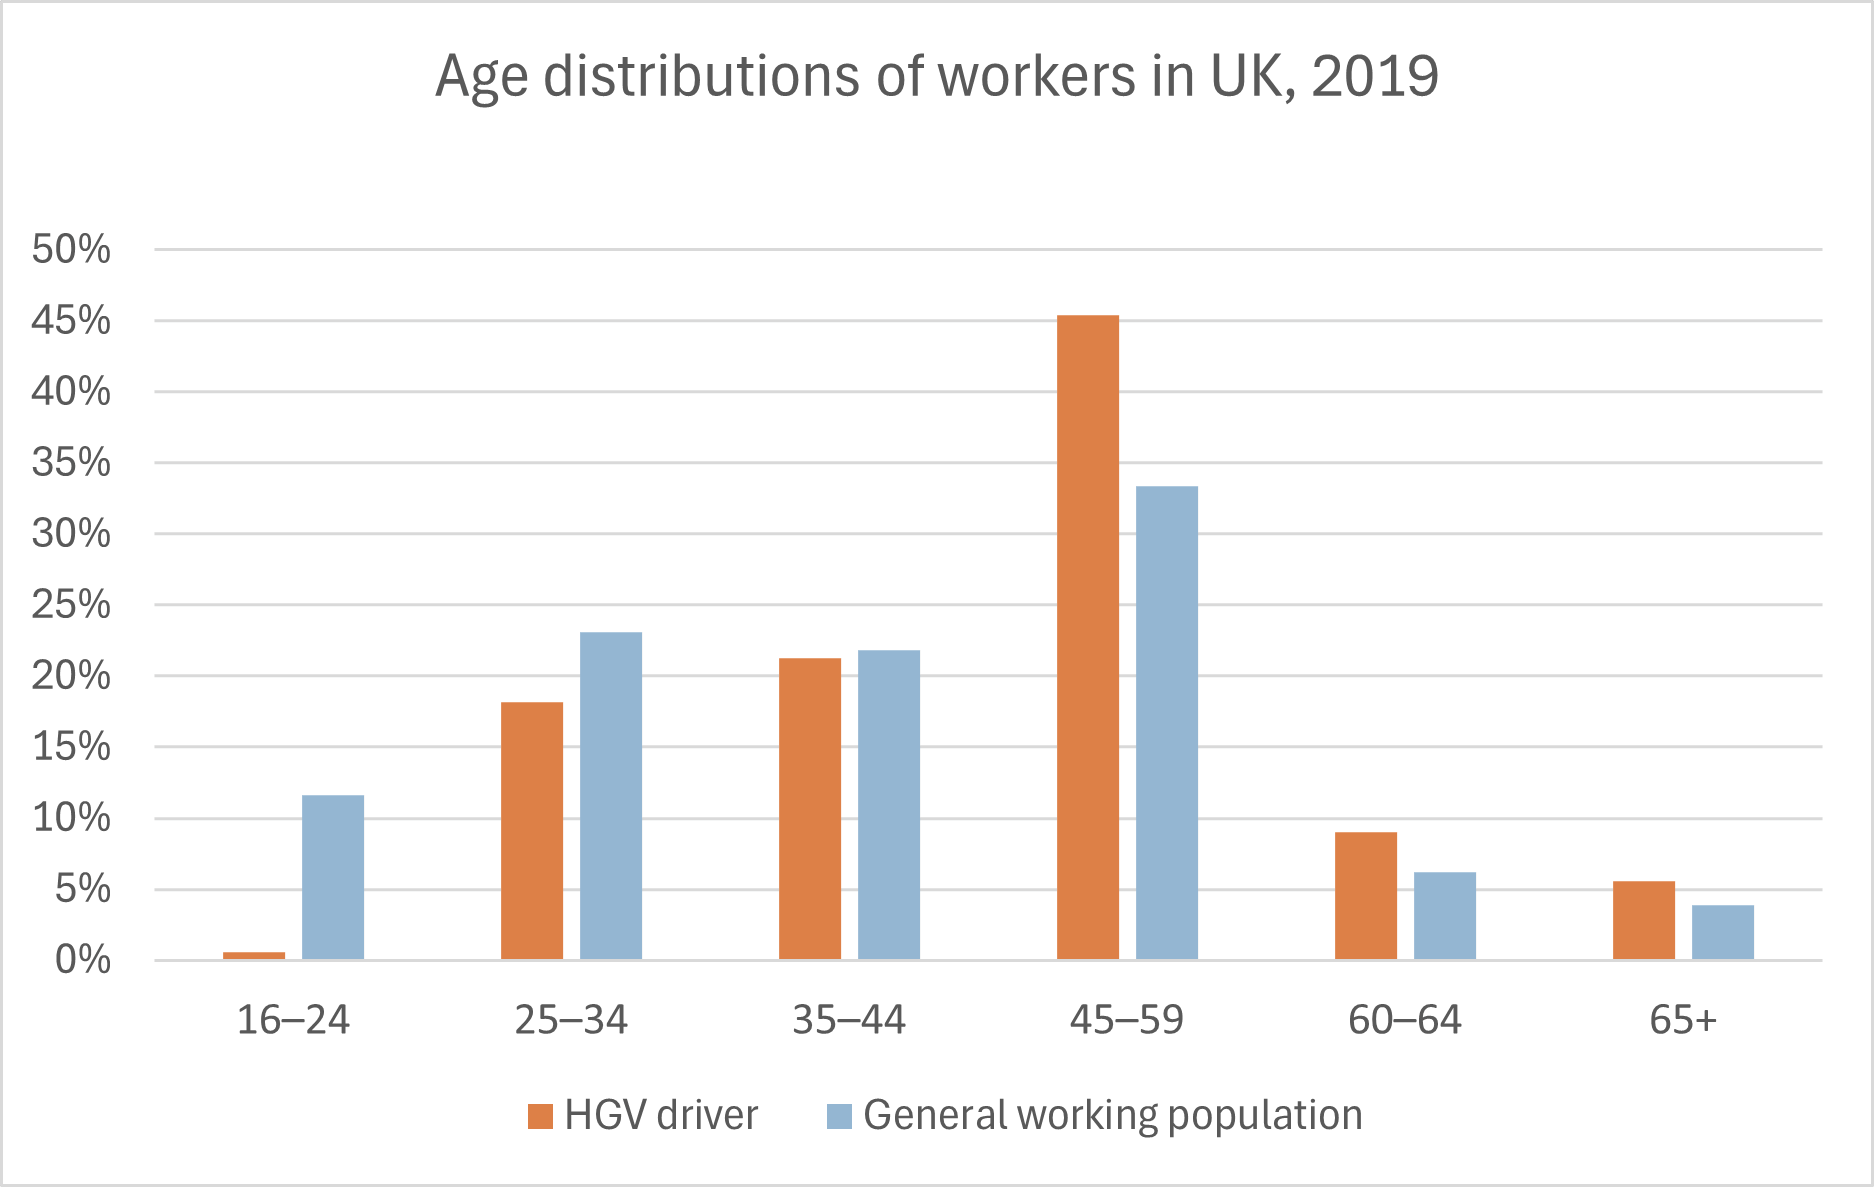
- In 2019 Q1, there were 302,000 heavy goods vehicle (HGV) drivers and 290,000 van (light goods vehicle) drivers. Not enough young people have been choosing a career as an HGV driver. In 2019 Q1, the average age of an HGV driver was 48.2 years. 60% of HGV drivers were over the age of 44, and 14.6% were over the age of 59. Only 19% were under the age of 35. The following chart illustrates how HGV drivers skewed older than the general working population. (Logistics UK, 2019)
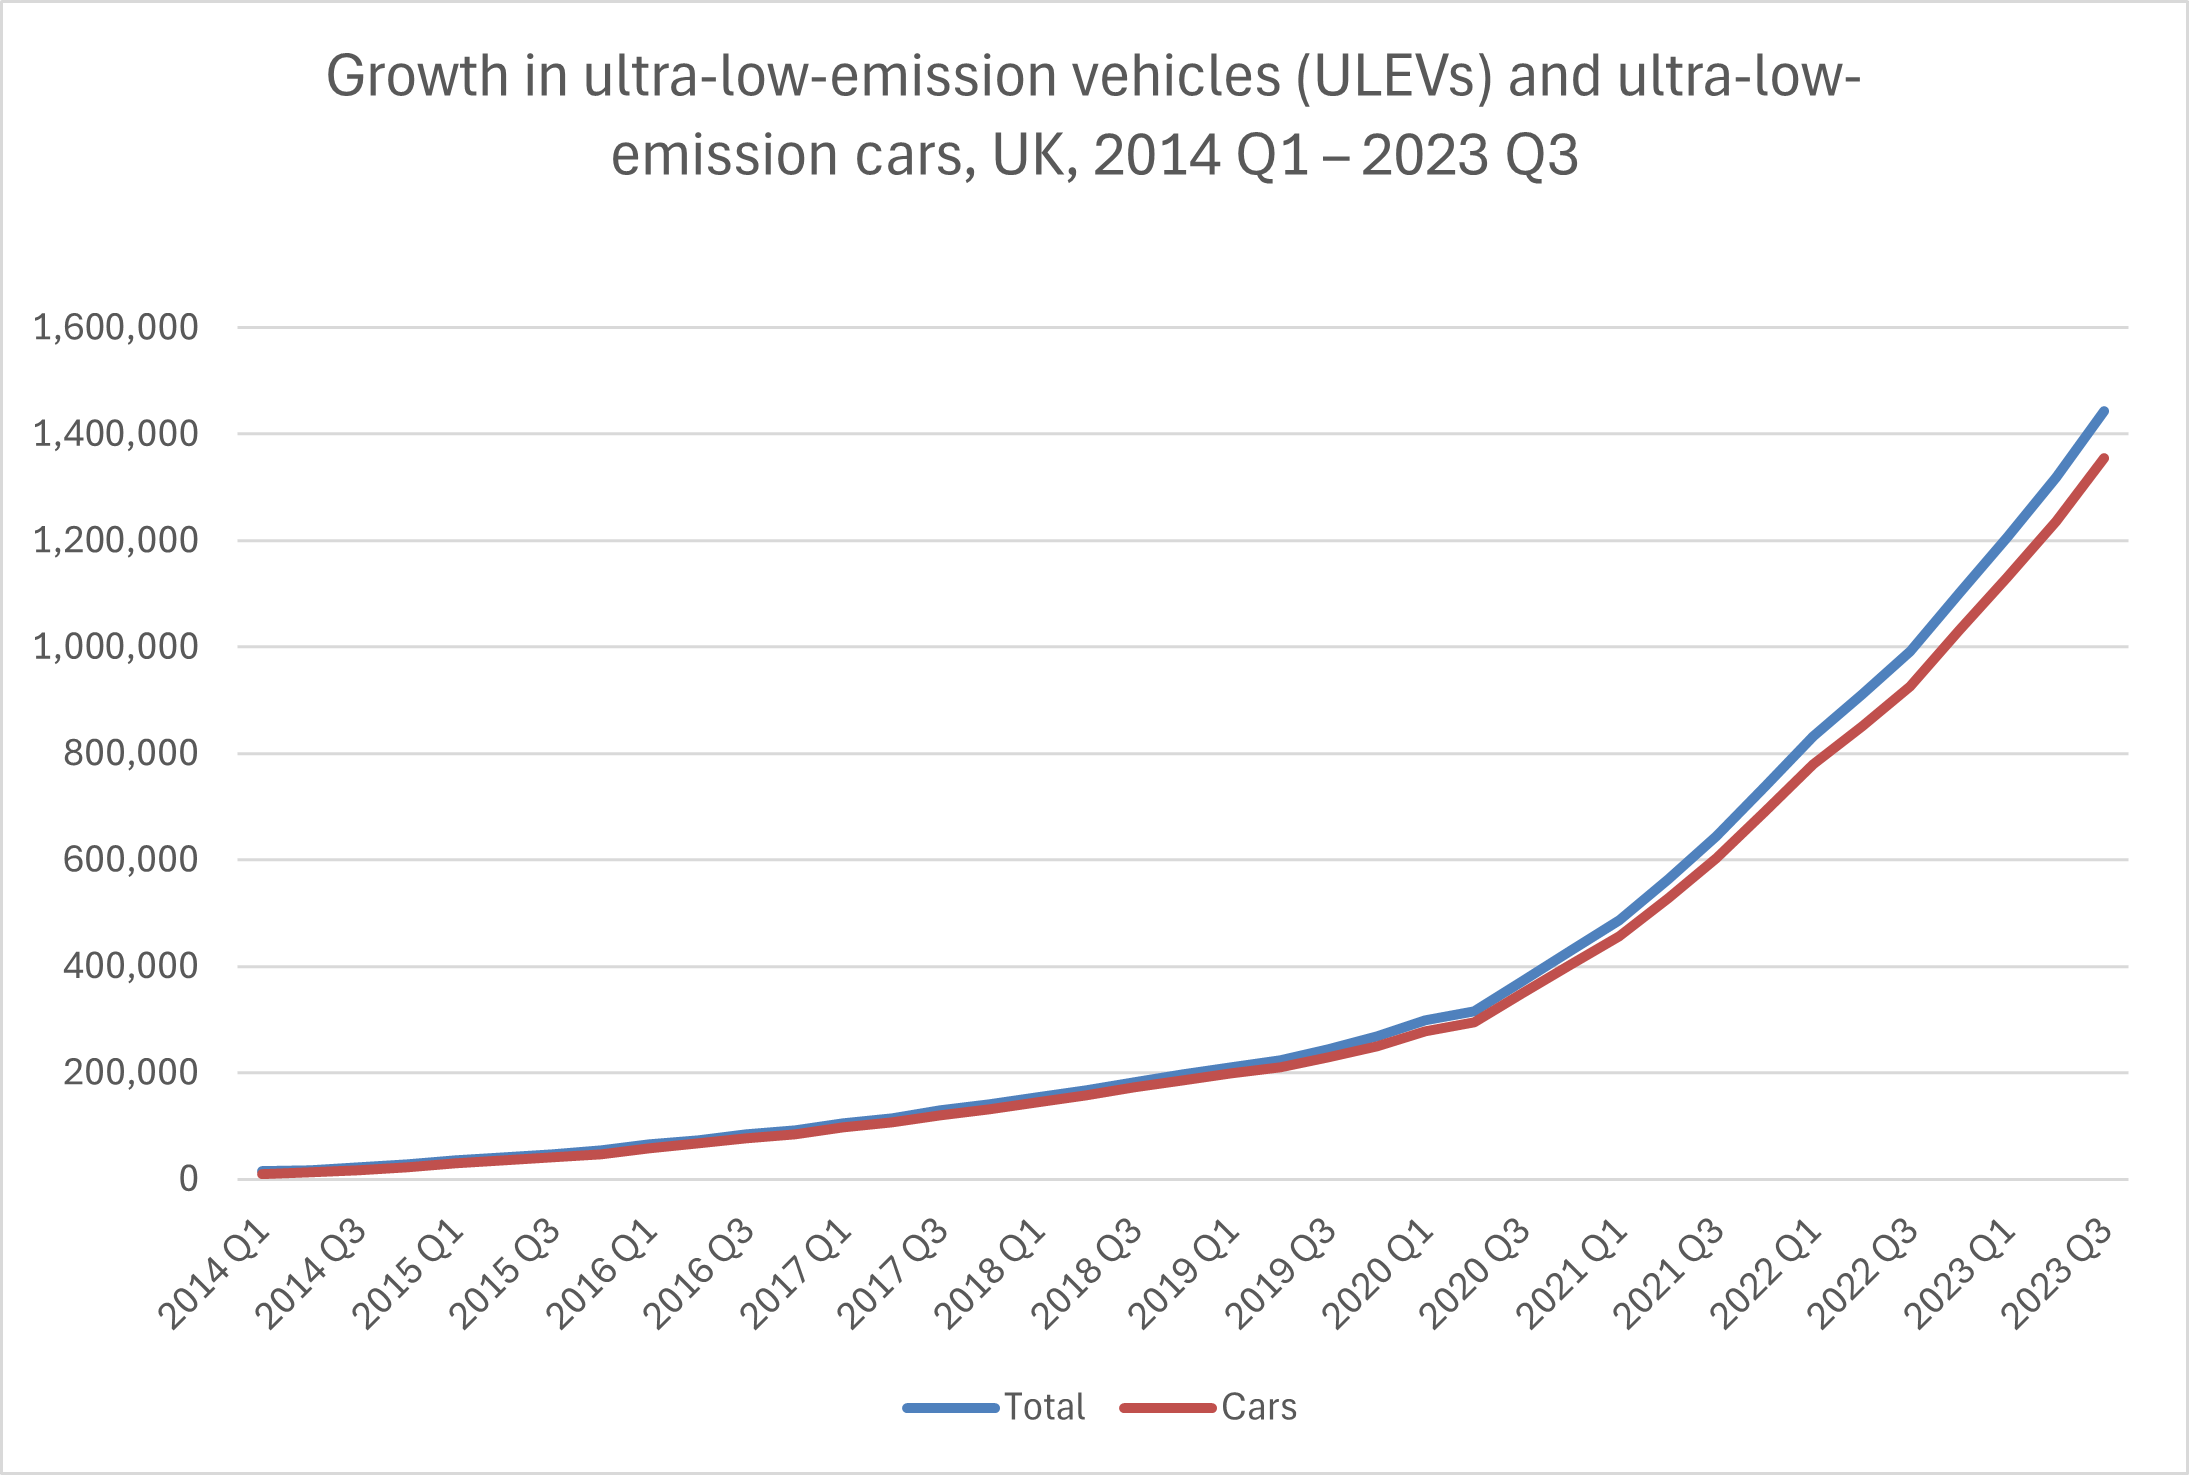
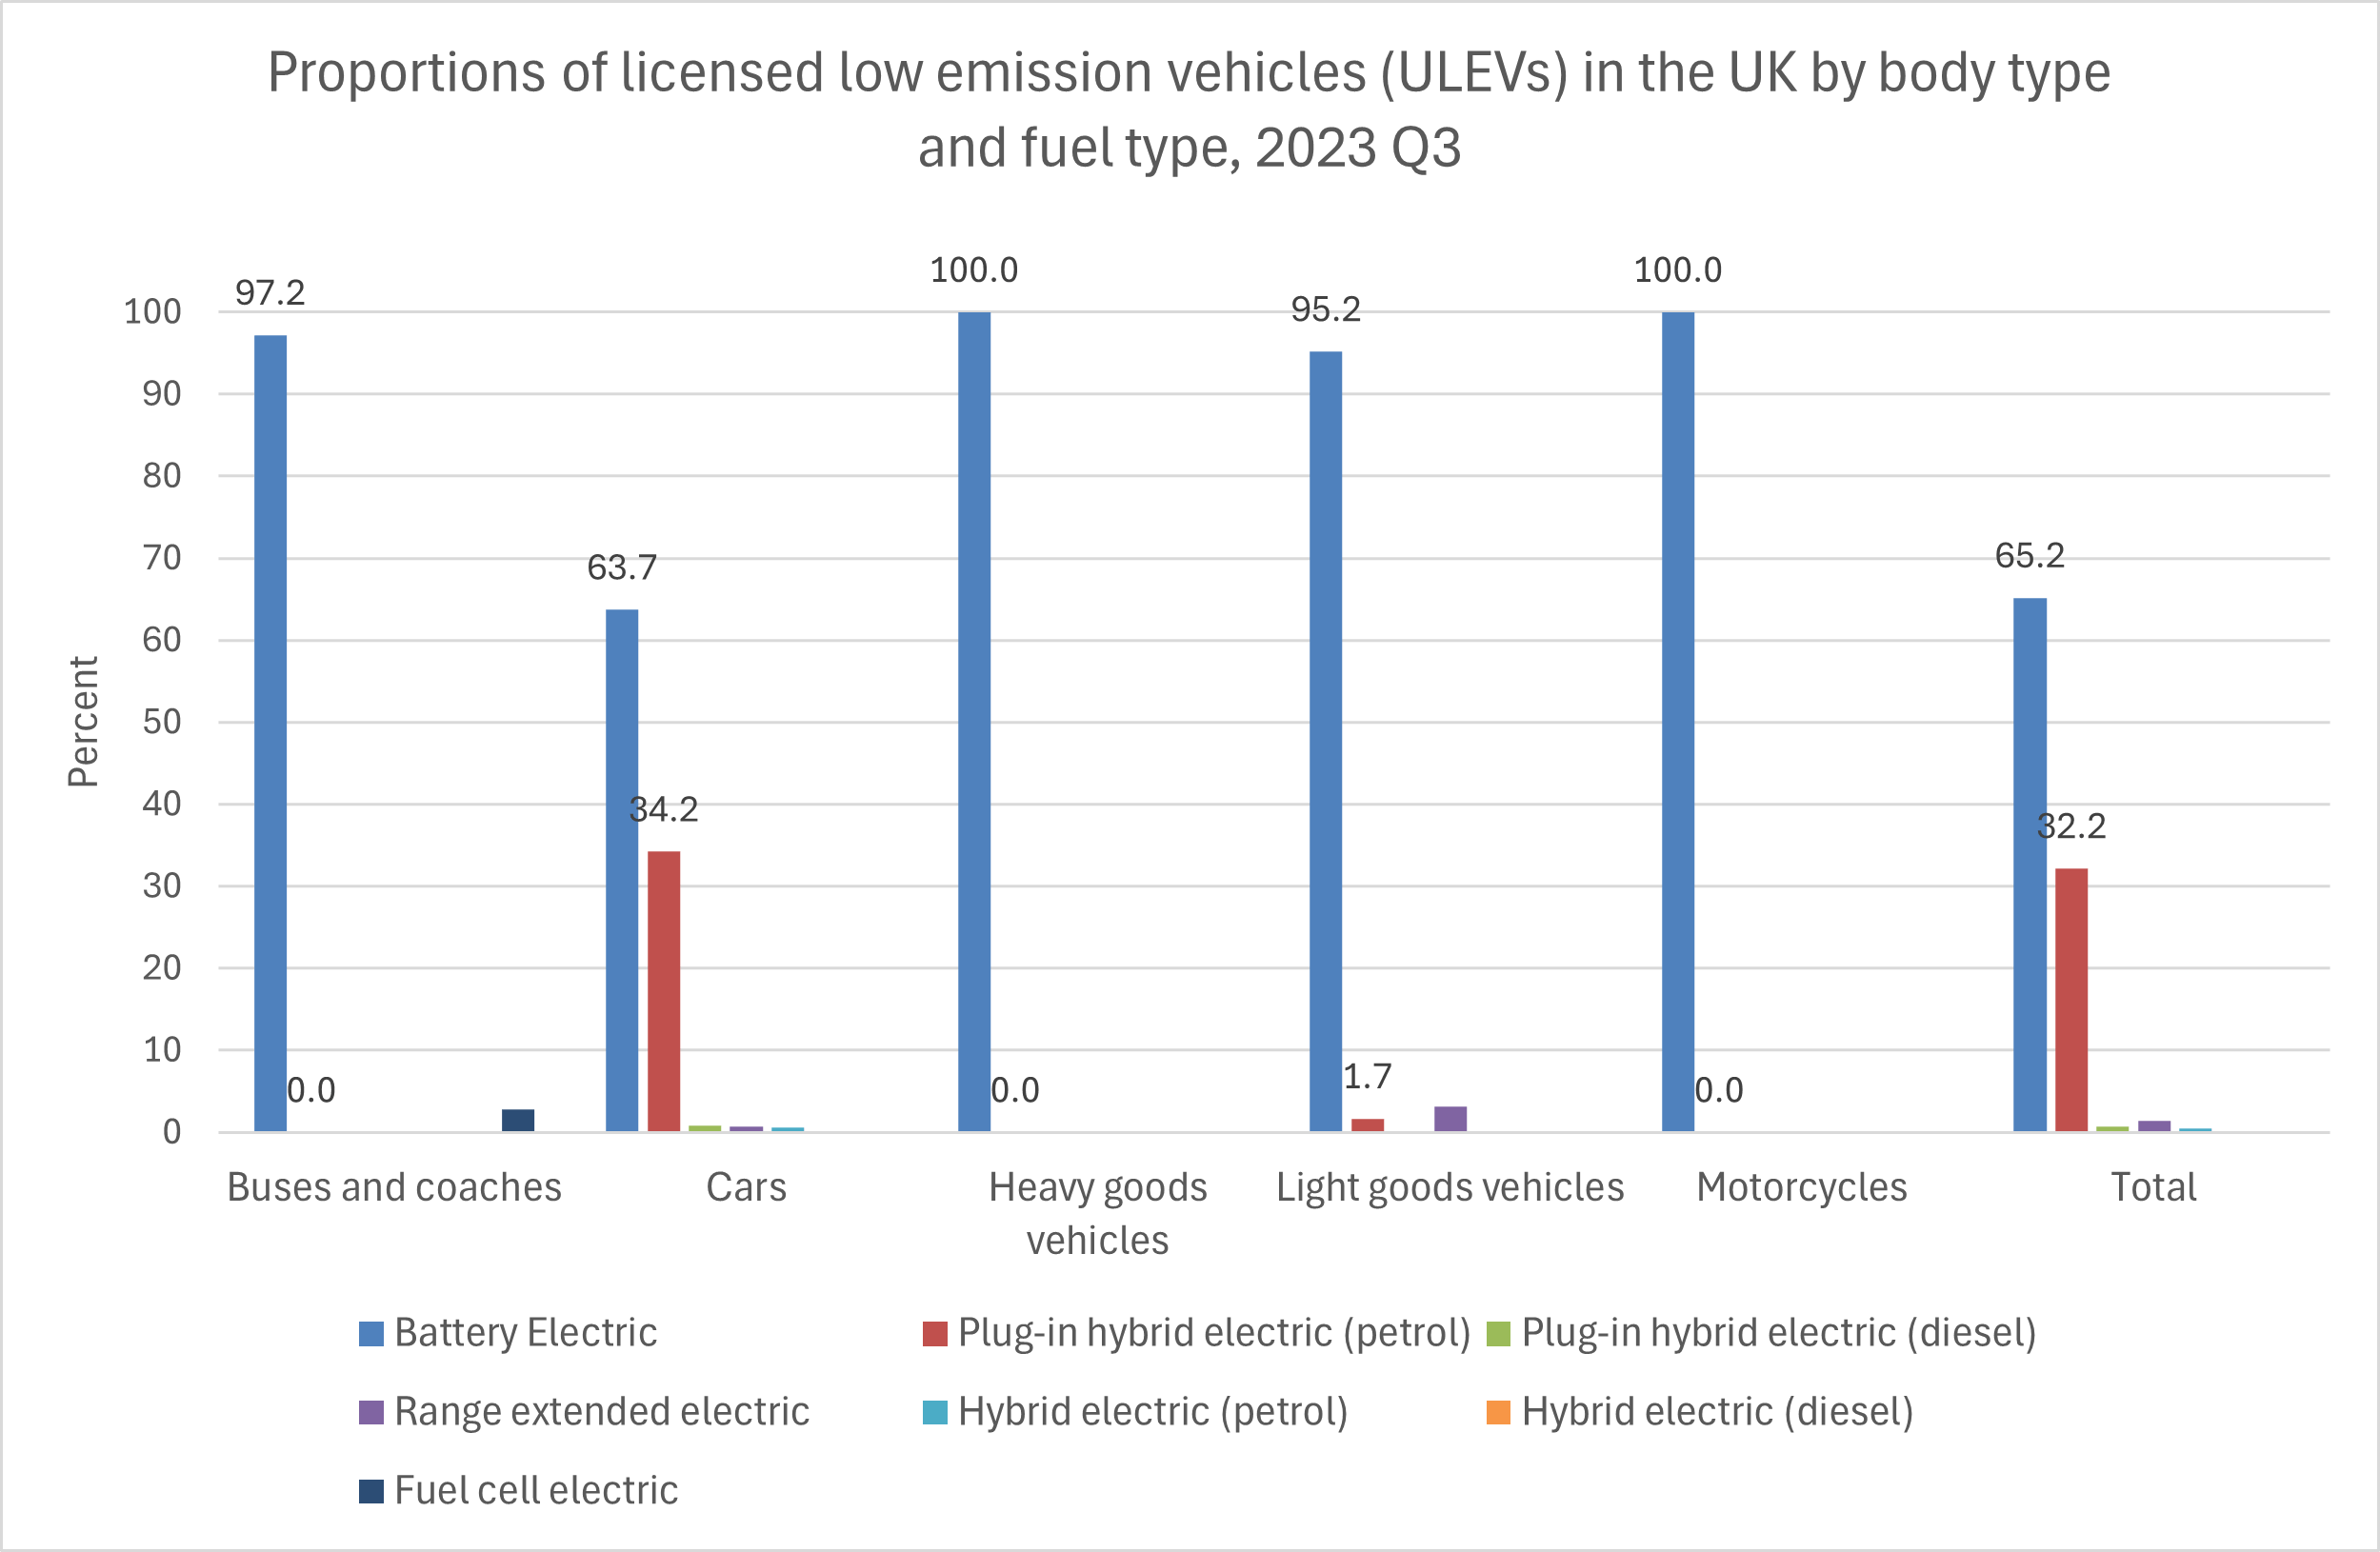
- The total number of ultra-low-emission vehicles (ULEVs) in the UK continues increasing dramatically, with ultra-low-emission cars making up 93.9% of ULEVs in 2023 3Q (ending September). In 2023 3Q, there were 1,443,791 registered ULEVs in the UK, including 1,355,025 cars, 60,566 light goods vehicles, 13,988 motorcycles, 3,025 buses and coaches, 2,539 heavy goods vehicles (HGVs), and 8,648 other vehicles. See the following chart. (Department for Transport (DfT) and Driver and Vehicle Licensing Agency (DVLA), December 2023)
- Among ULEVs in 2023 3Q, battery electric was by far the most popular fuel type, with plug-in hybrid electric (petrol) the second most popular fuel type for cars only. No other fuel type was used by more than a few percent of ULEVs. 3.1% of light goods vehicles were range extended electric vehicles, and 2.8% of buses and coaches ran on fuel cells. Only 0.8% of ultra-low-emission cars were plug-in hybrid electric (diesel) vehicles, 0.7% were range extended electric vehicles, and 0.5% were hybrid electric (petrol) vehicles. Virtually all ultra-low-emission heavy goods vehicles (HGVs) and motorcycles were battery electric vehicles. See the following chart. (Department for Transport (DfT) and Driver and Vehicle Licensing Agency (DVLA), December 2023)
A word about adjusted figures: The UK Ministry for Transport provides adjusted figures on road casualties (deaths, serious injuries, and slight injuries) as well as the original unadjusted figures. The adjusted figures normalize changes to the injury-based reporting systems used by some but not all police forces. This may no longer be necessary after all police forces have begun using the new injury-based reporting systems. The Ministry for Transport recommends using the adjusted figures where available rather than the unadjusted figures. Accordingly, the UK casualty statistics in this document use the adjusted figures for road casualties where feasible.
Speeding
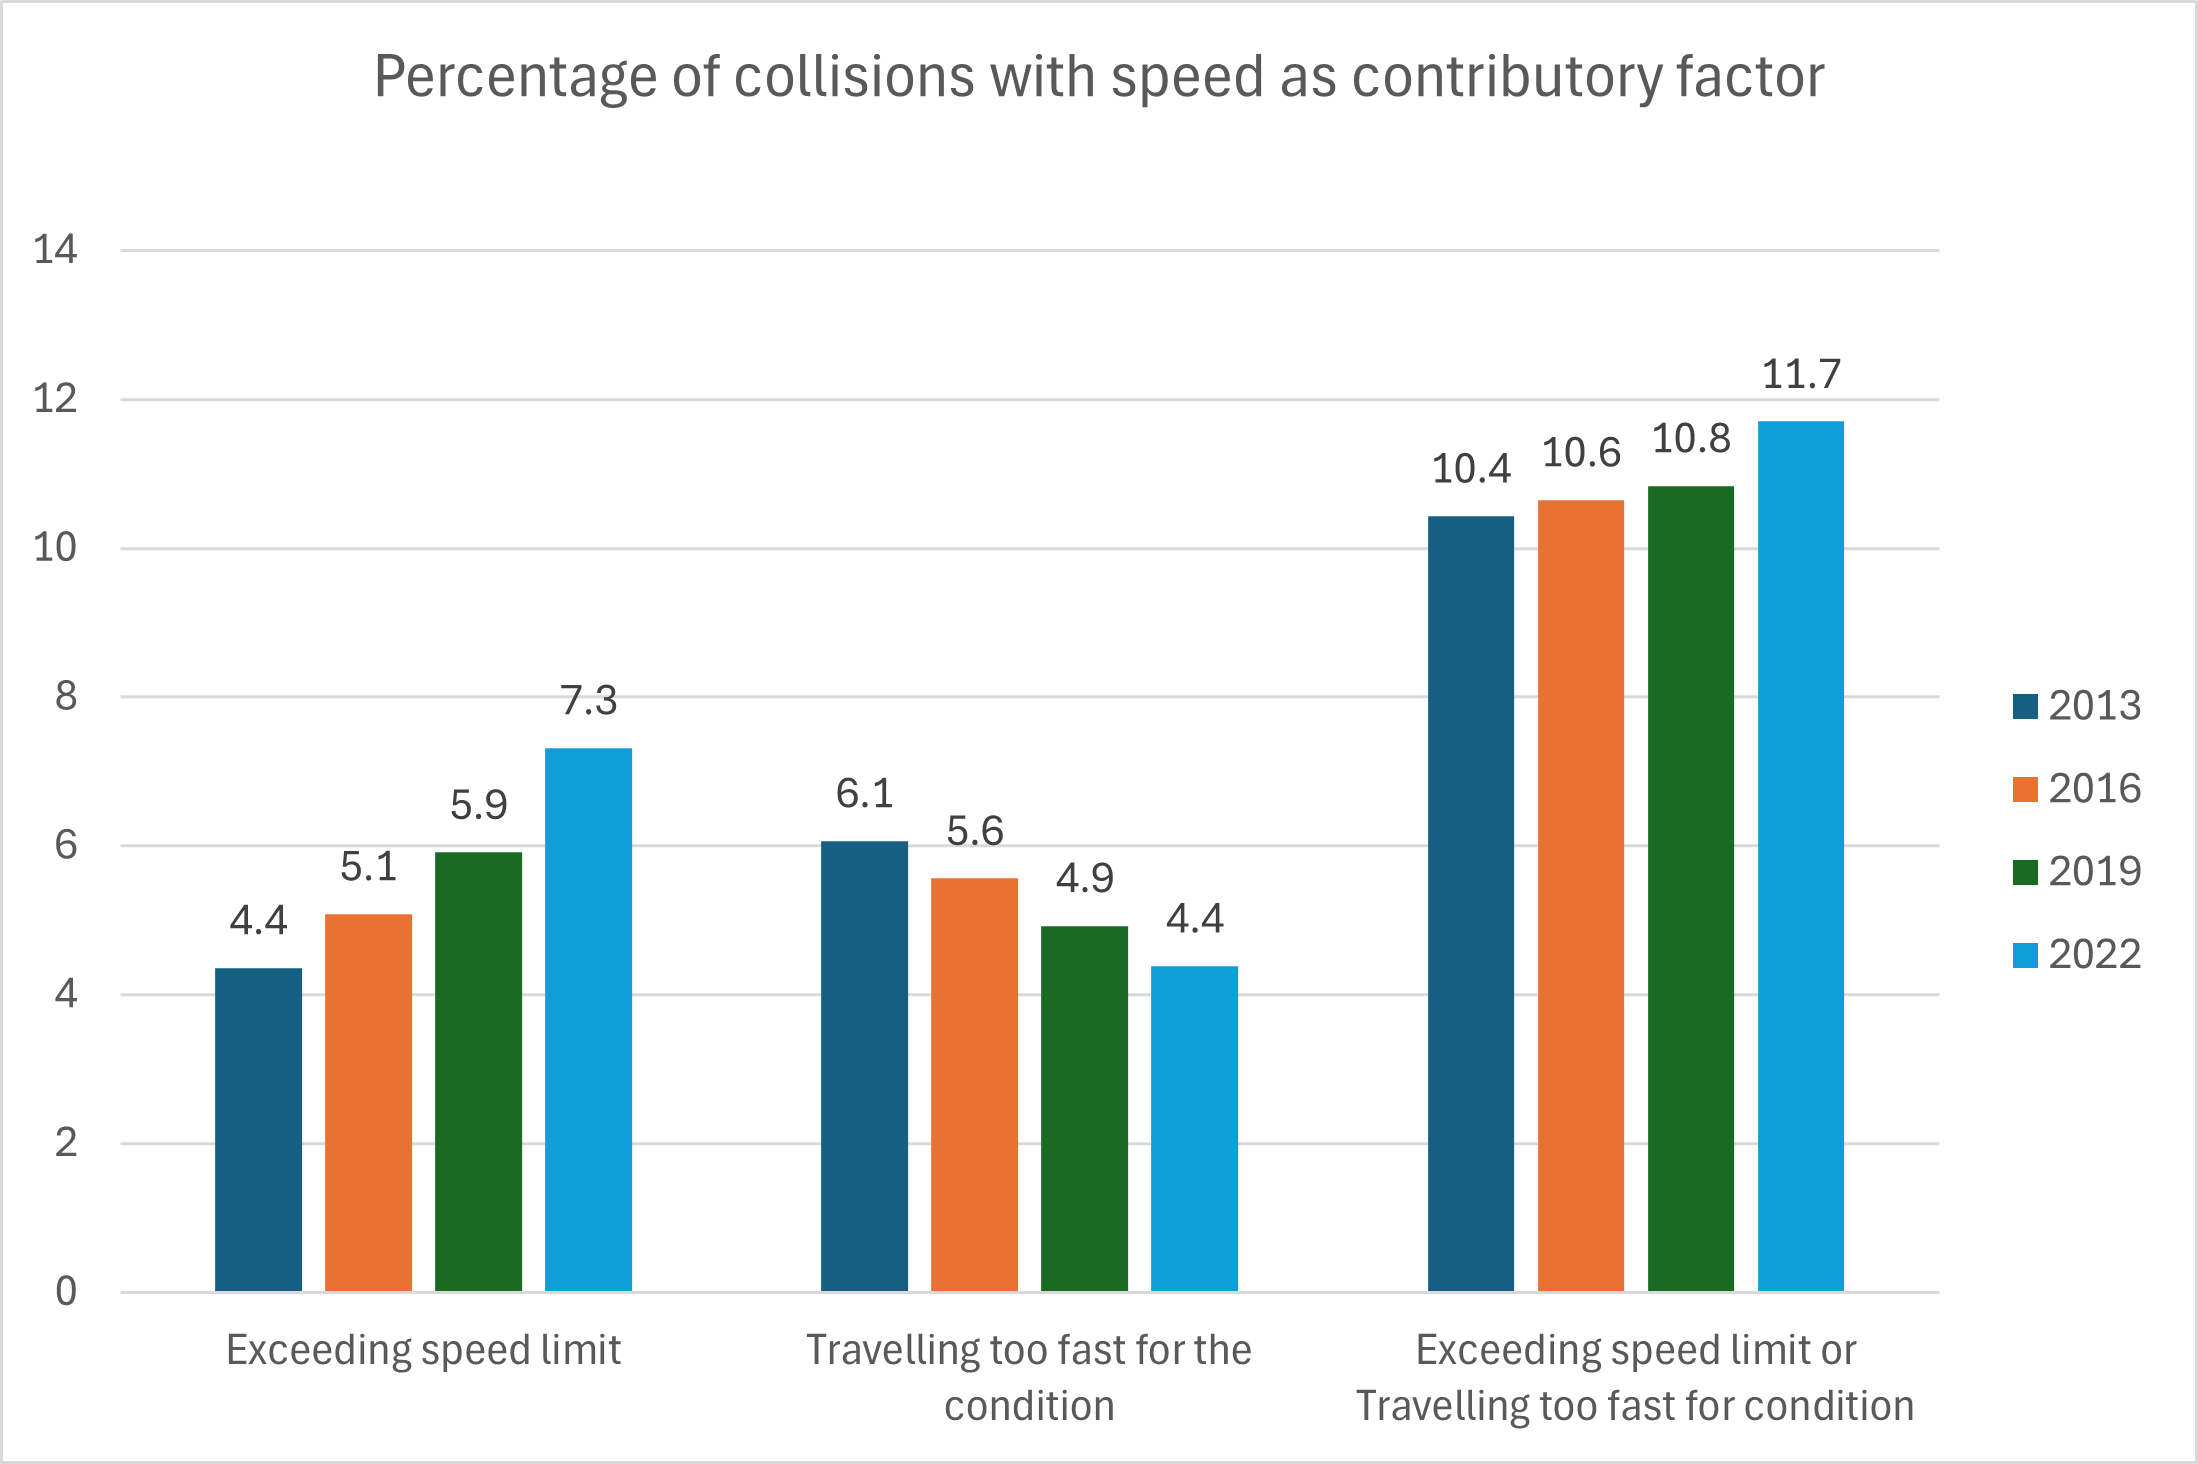
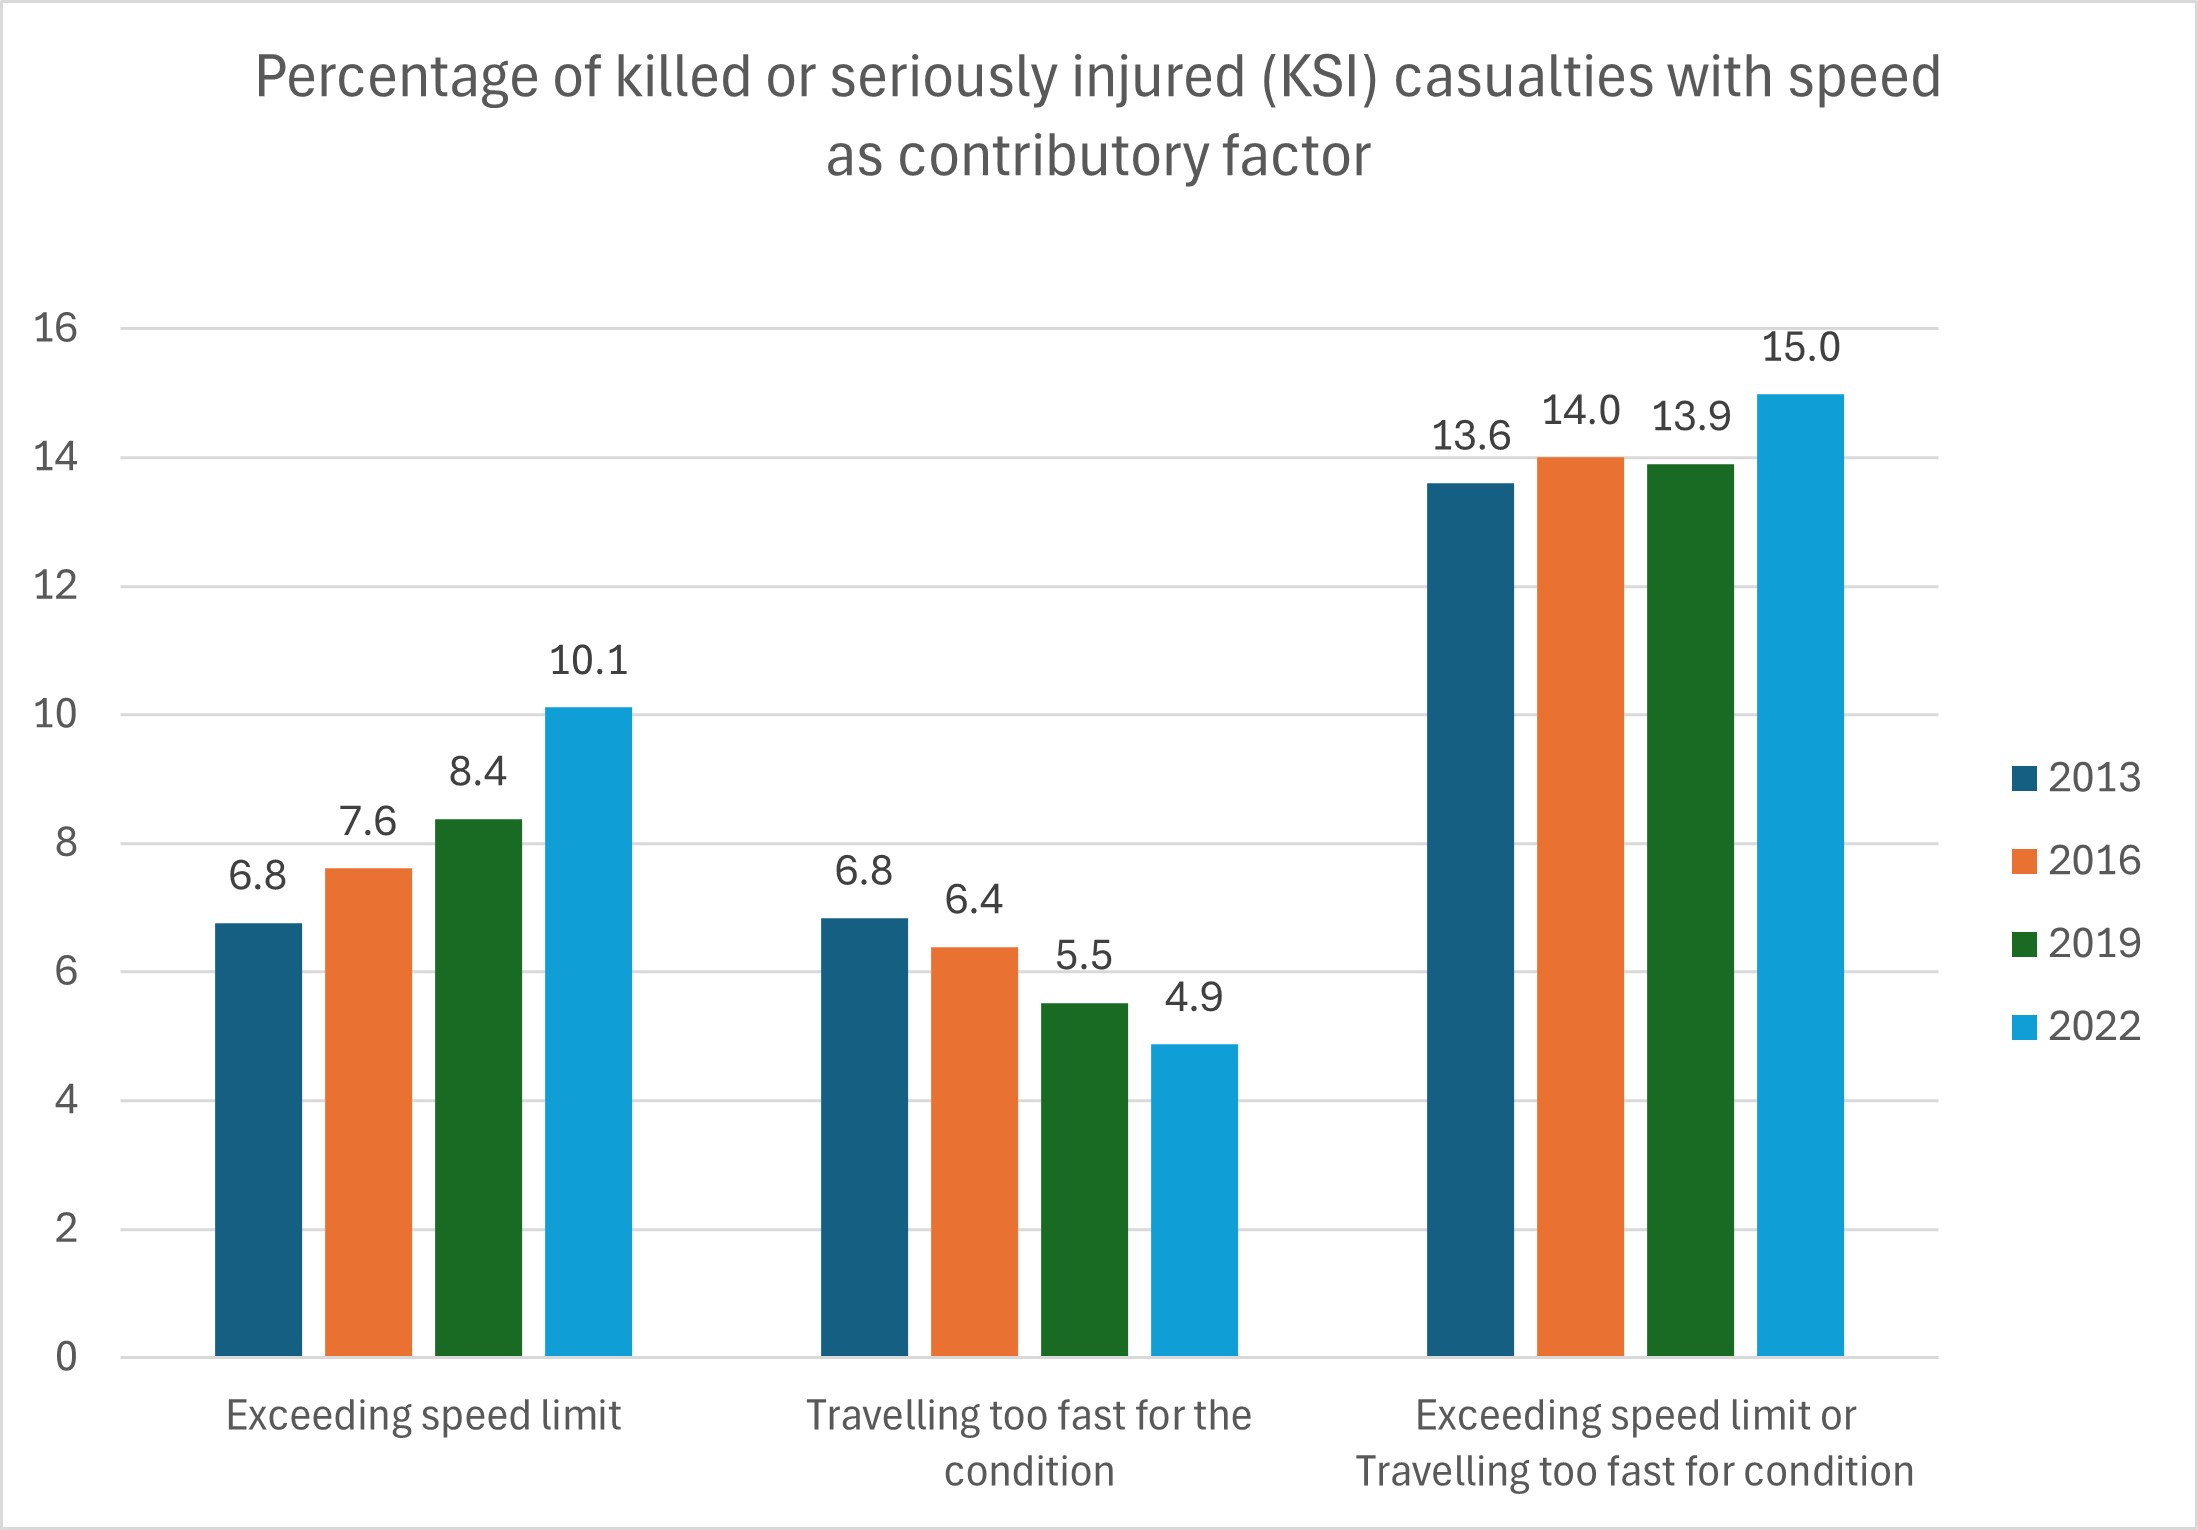
- In Great Britain in 2022, speed was a contributory factor in 11.7% of collisions, compared with 10.4% in 2013. There are two specific aspects of this: collisions in which exceeding the speed limit was a factor, and collisions in which driving too fast for the condition was a factor. From 2013 to 2022, the percentage of collisions that involved travelling too fast for the condition decreased, but this was more than balanced by a corresponding increase in the share of collisions that involved exceeding the speed limit. A similar situation existed with the percentage of persons killed or seriously injured (KSI) in collisions. In 2022, speed was a contributory factor in 15.0% of KSI casualties, compared with 13.6% in 2013. The percentage of KSI casualties that involved driving too fast for the condition decreased, but this was more than balanced by a corresponding increase in KSI casualties that involved exceeding the speed limit. See the following two charts. (Department for Transport, September 2023)
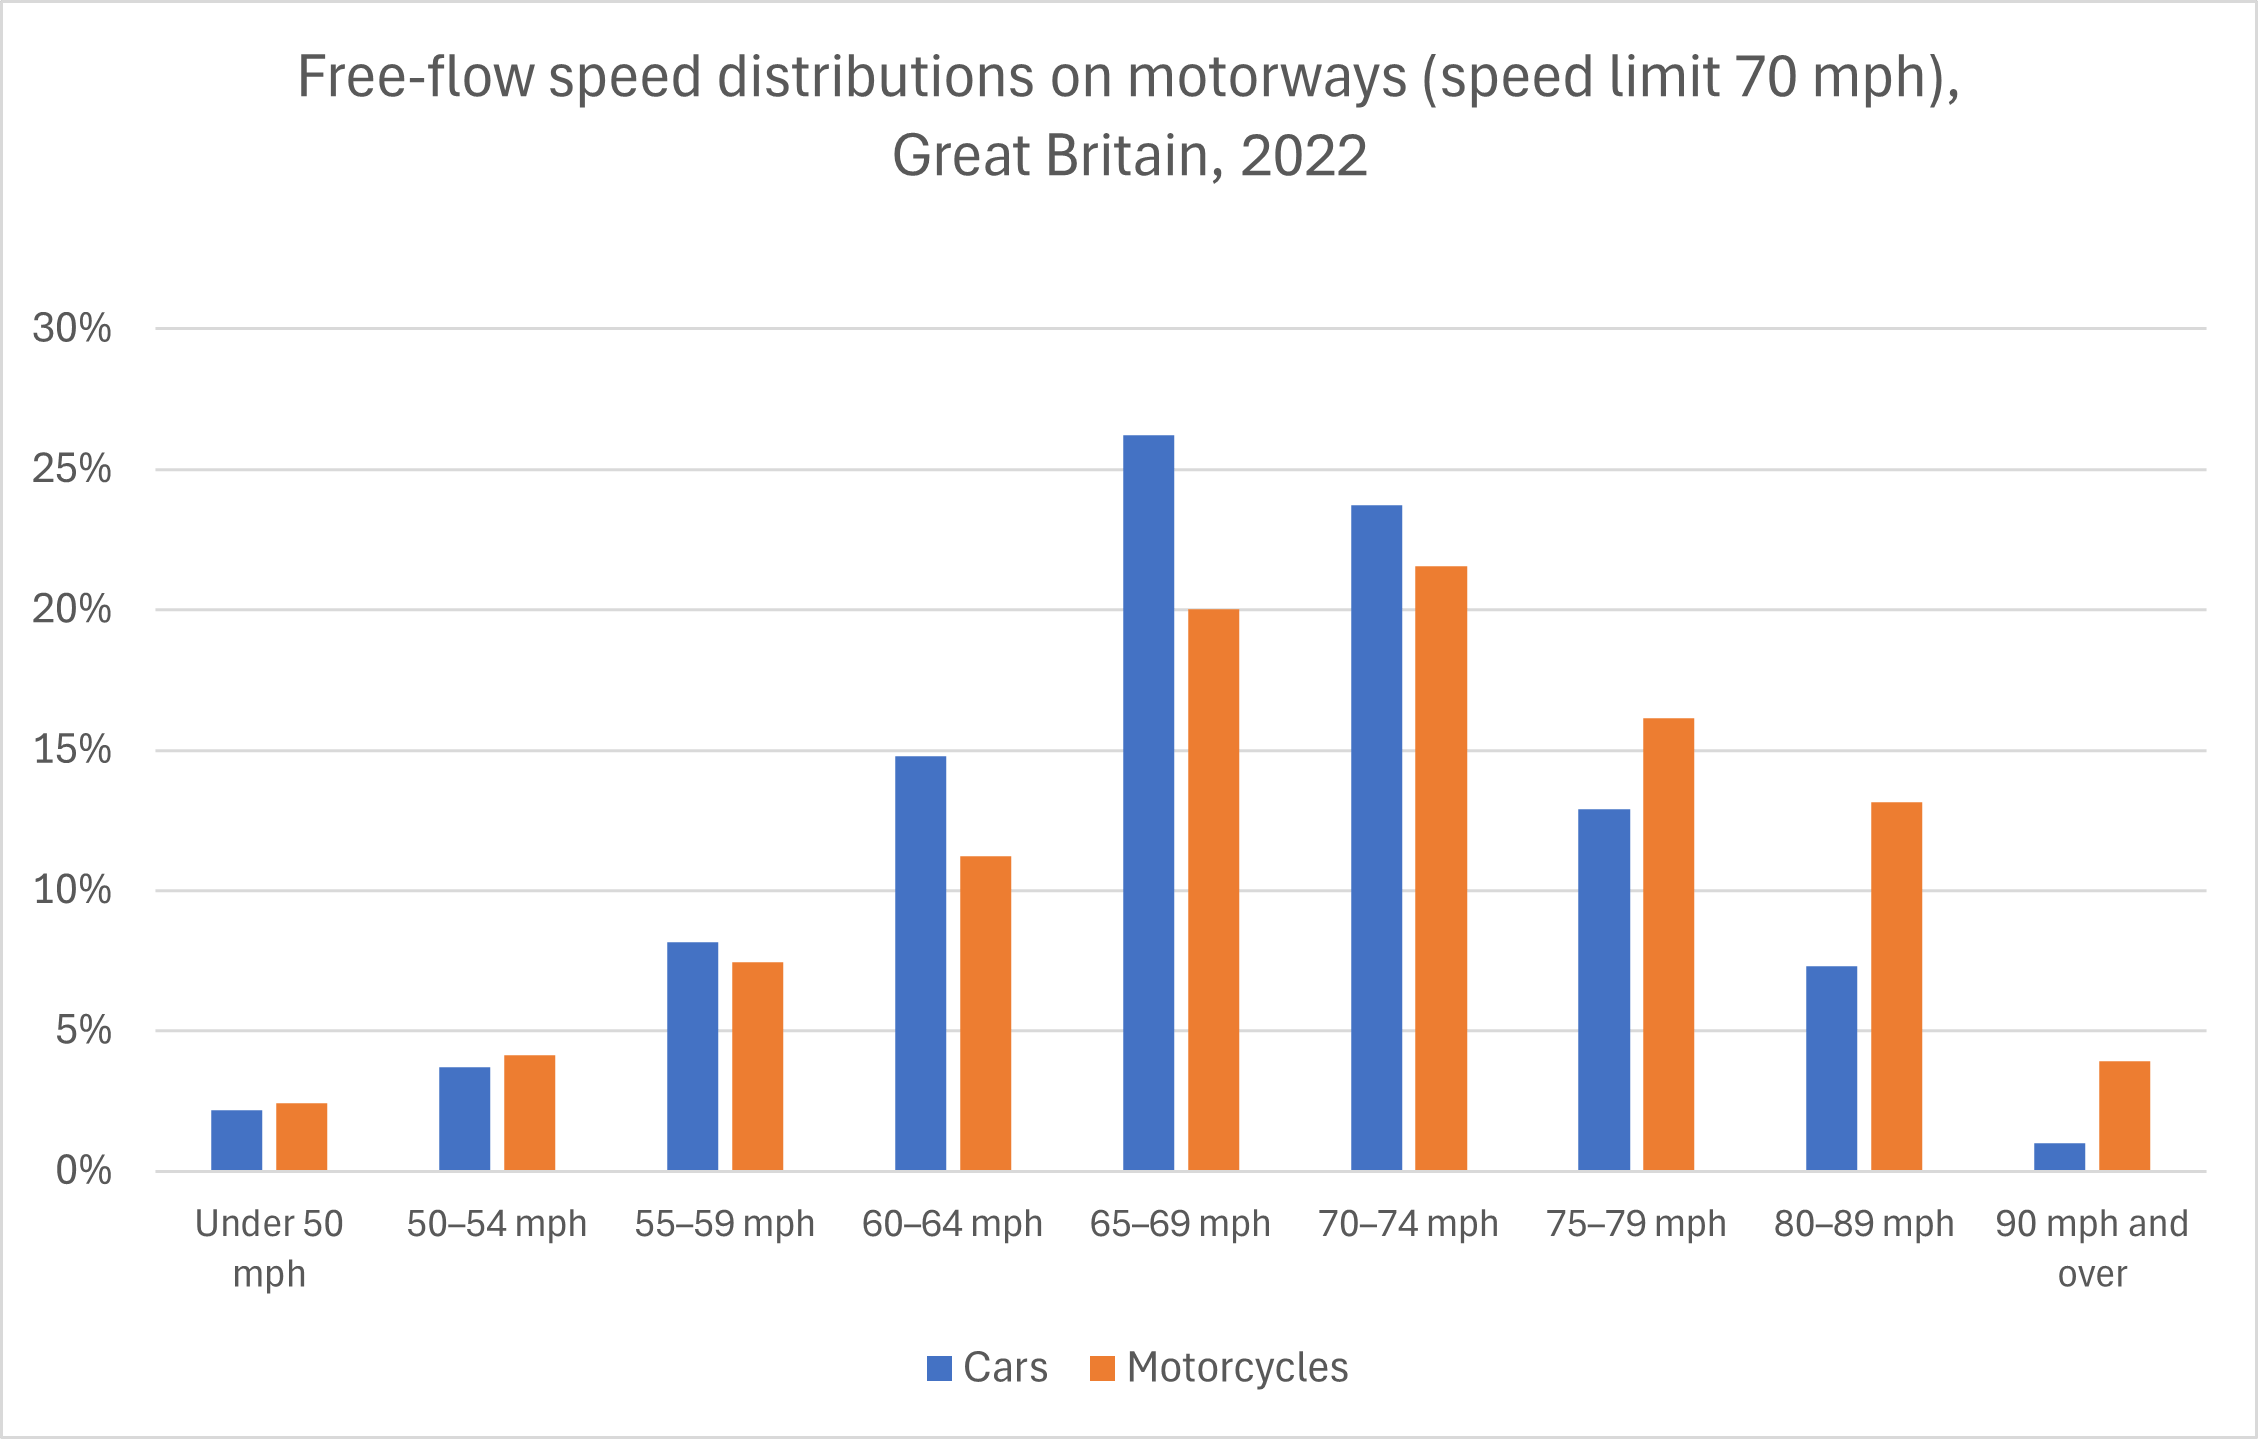
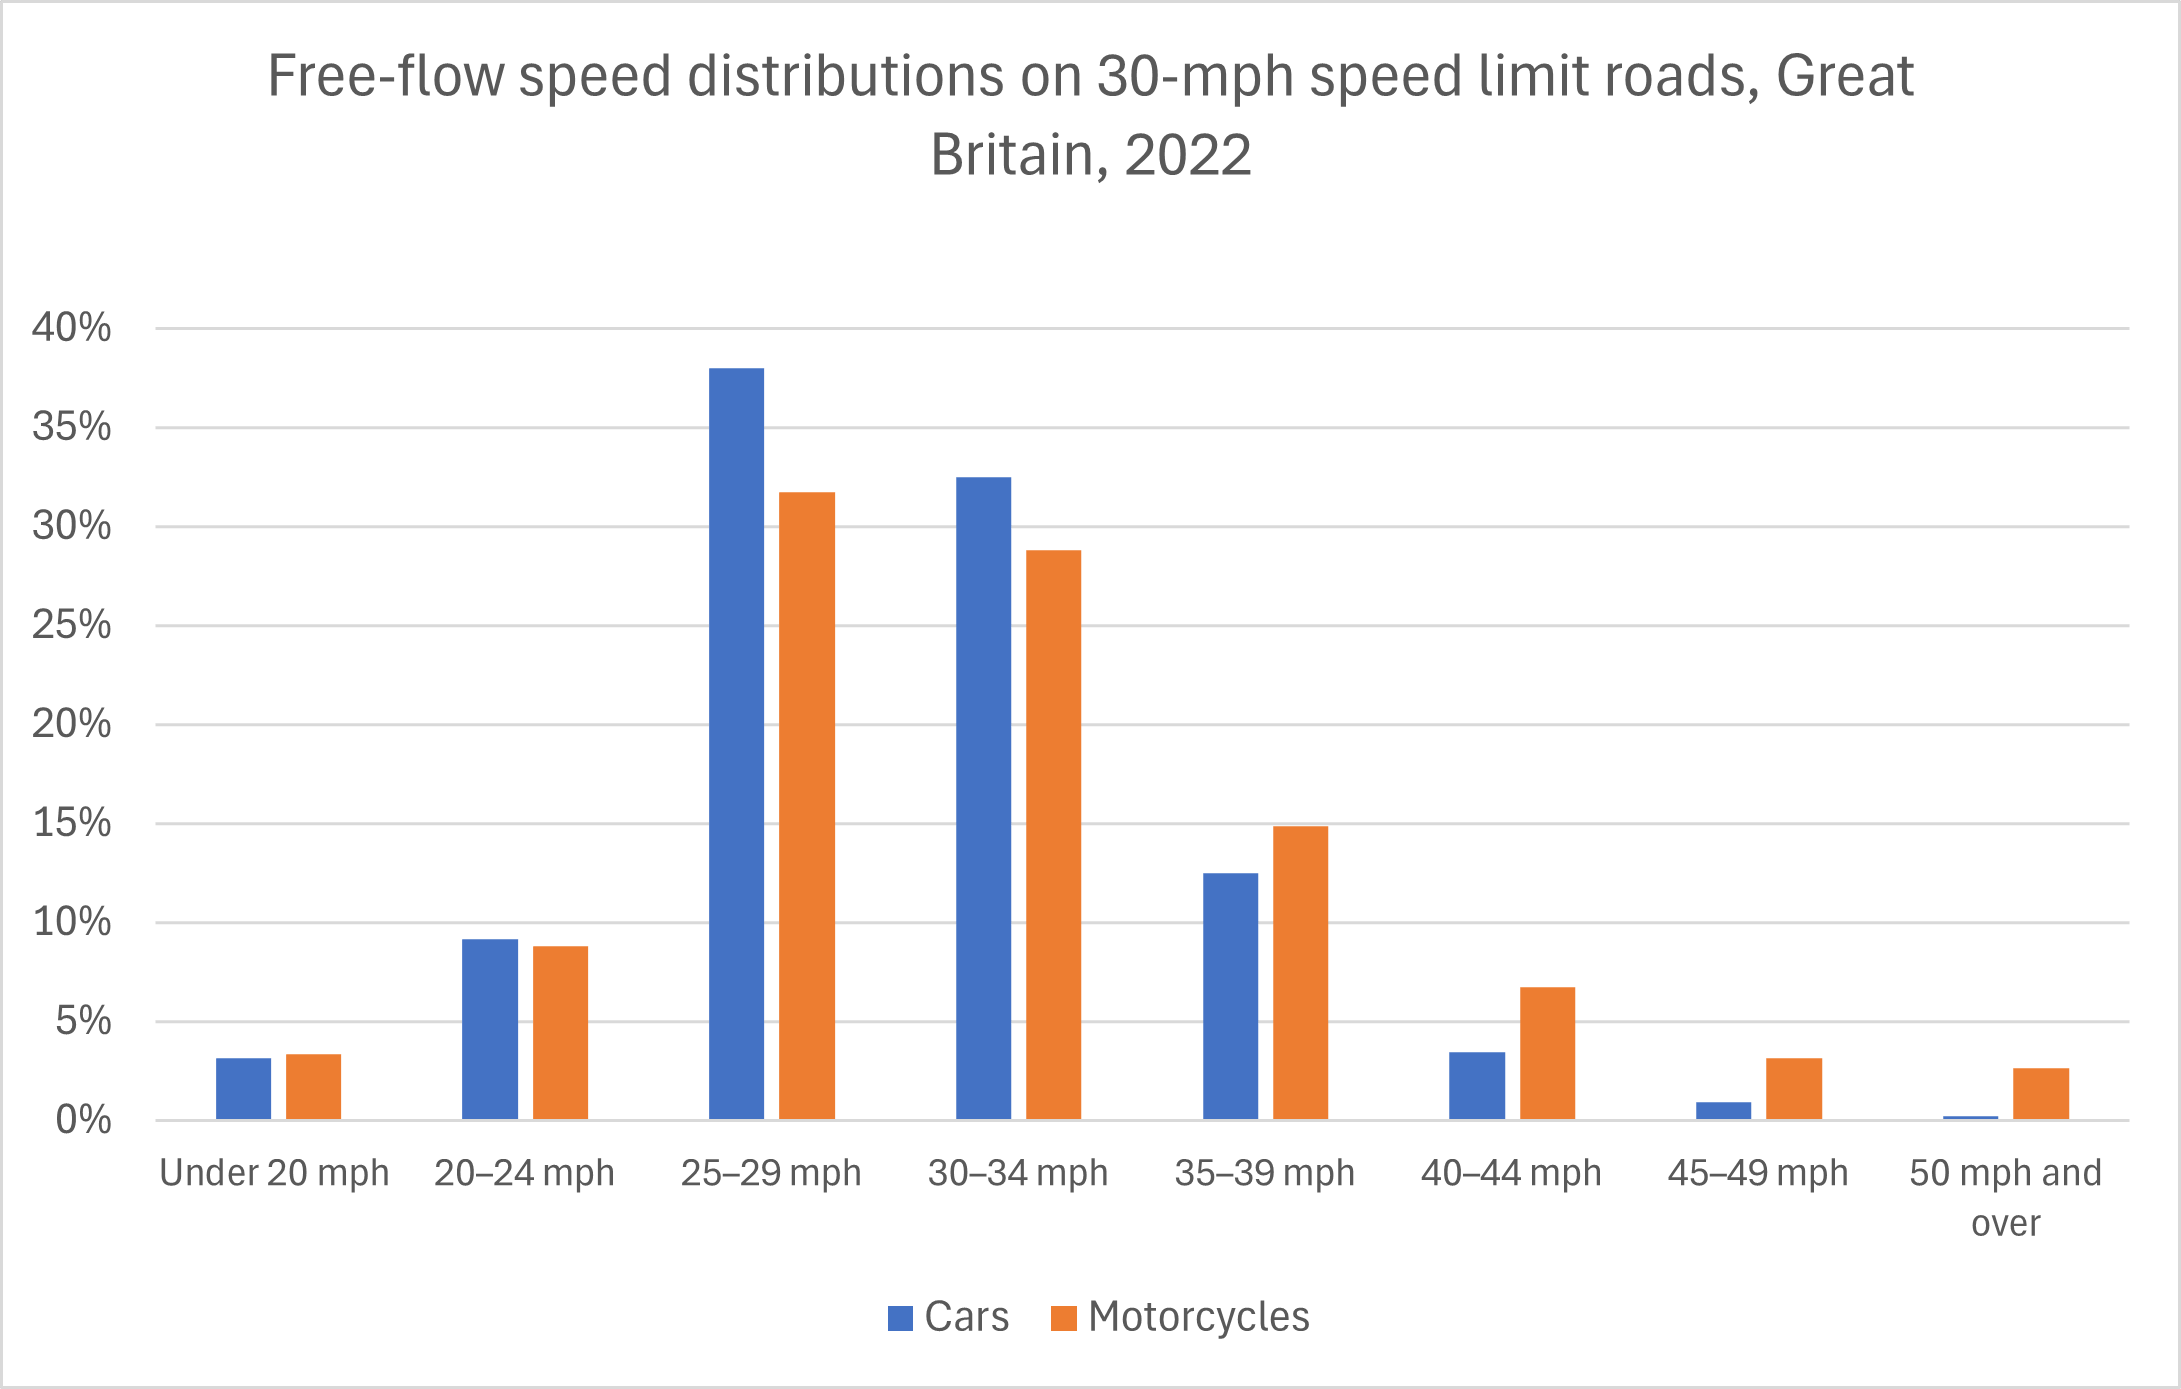
- In Great Britain in 2022, 8.3% of cars on motorways and 17.1% of motorcycles on motorways usually exceeded the 70-mph speed limit by 10 mph or more. On 30-mph speed-limit roads, 12.5% of motorcycles and at least 4.4% of cars usually exceeded the speed limit by 10 mph or more. (We are forced to write ‘at least 4.4%’ because the relevant Department for Transport dataset does not specify the percentage of cars travelling at 50 mph or more; it is simply described as ‘low but not exactly zero’.) These figures were for free-flowing traffic conditions, where there were no external factors that might have restricted speeds (such as junctions, sharp bends, or speed cameras). See the following two charts. Note that motorcycles were more likely than cars to significantly exceed the speed limits on both types of roadways. (Automatic Traffic Counter network, Department for Transport, August 2023)
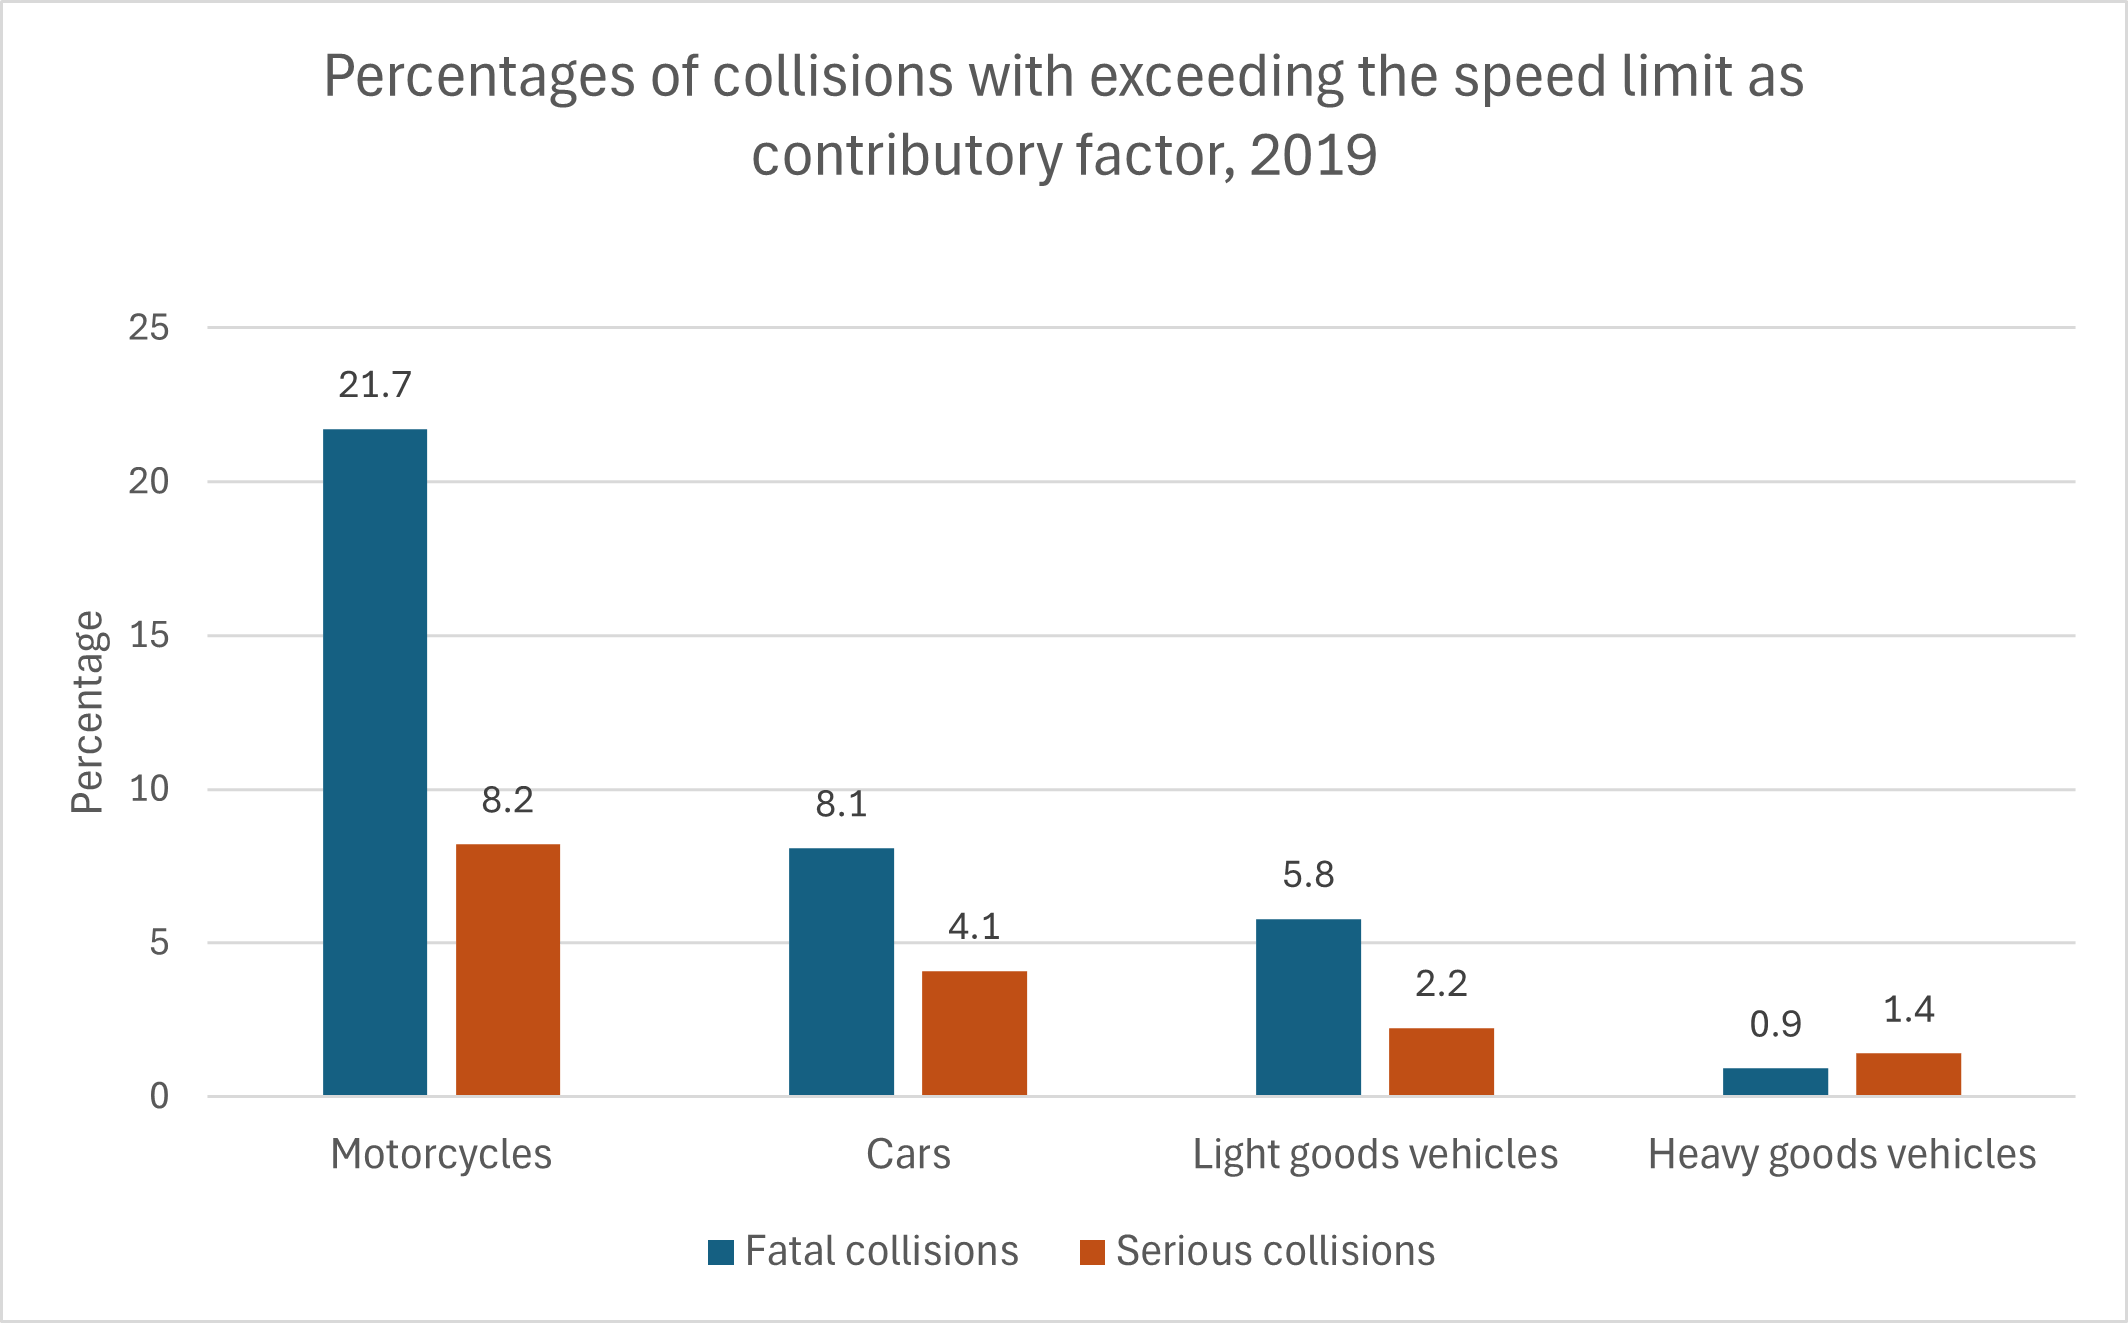
- In 2019, exceeding the speed limit was a contributory factor in 21.7% of fatal motorcycle collisions and 8.2% of motorcycle collisions involving serious injury. This compares with 8.1% of fatal car collisions and 4.1% of collisions involving serious injury in which speeding was a contributory factor. See the following chart. (In the chart, a ‘serious collision’ is a collision involving serious injury.) (Department for Transport, 2019)
- A survey of drivers in 2018 found that 9.3% of drivers admitted to breaking speed limits on purpose, and 26.3% of drivers admitted to breaking speed limits on purpose and by mistake. Furthermore, 8.4% of drivers admitted to breaking speed limits on every journey, and 17.0% of drivers admitted to breaking speed limits on more than half of their journeys. See the following charts. (Brake, 2019)
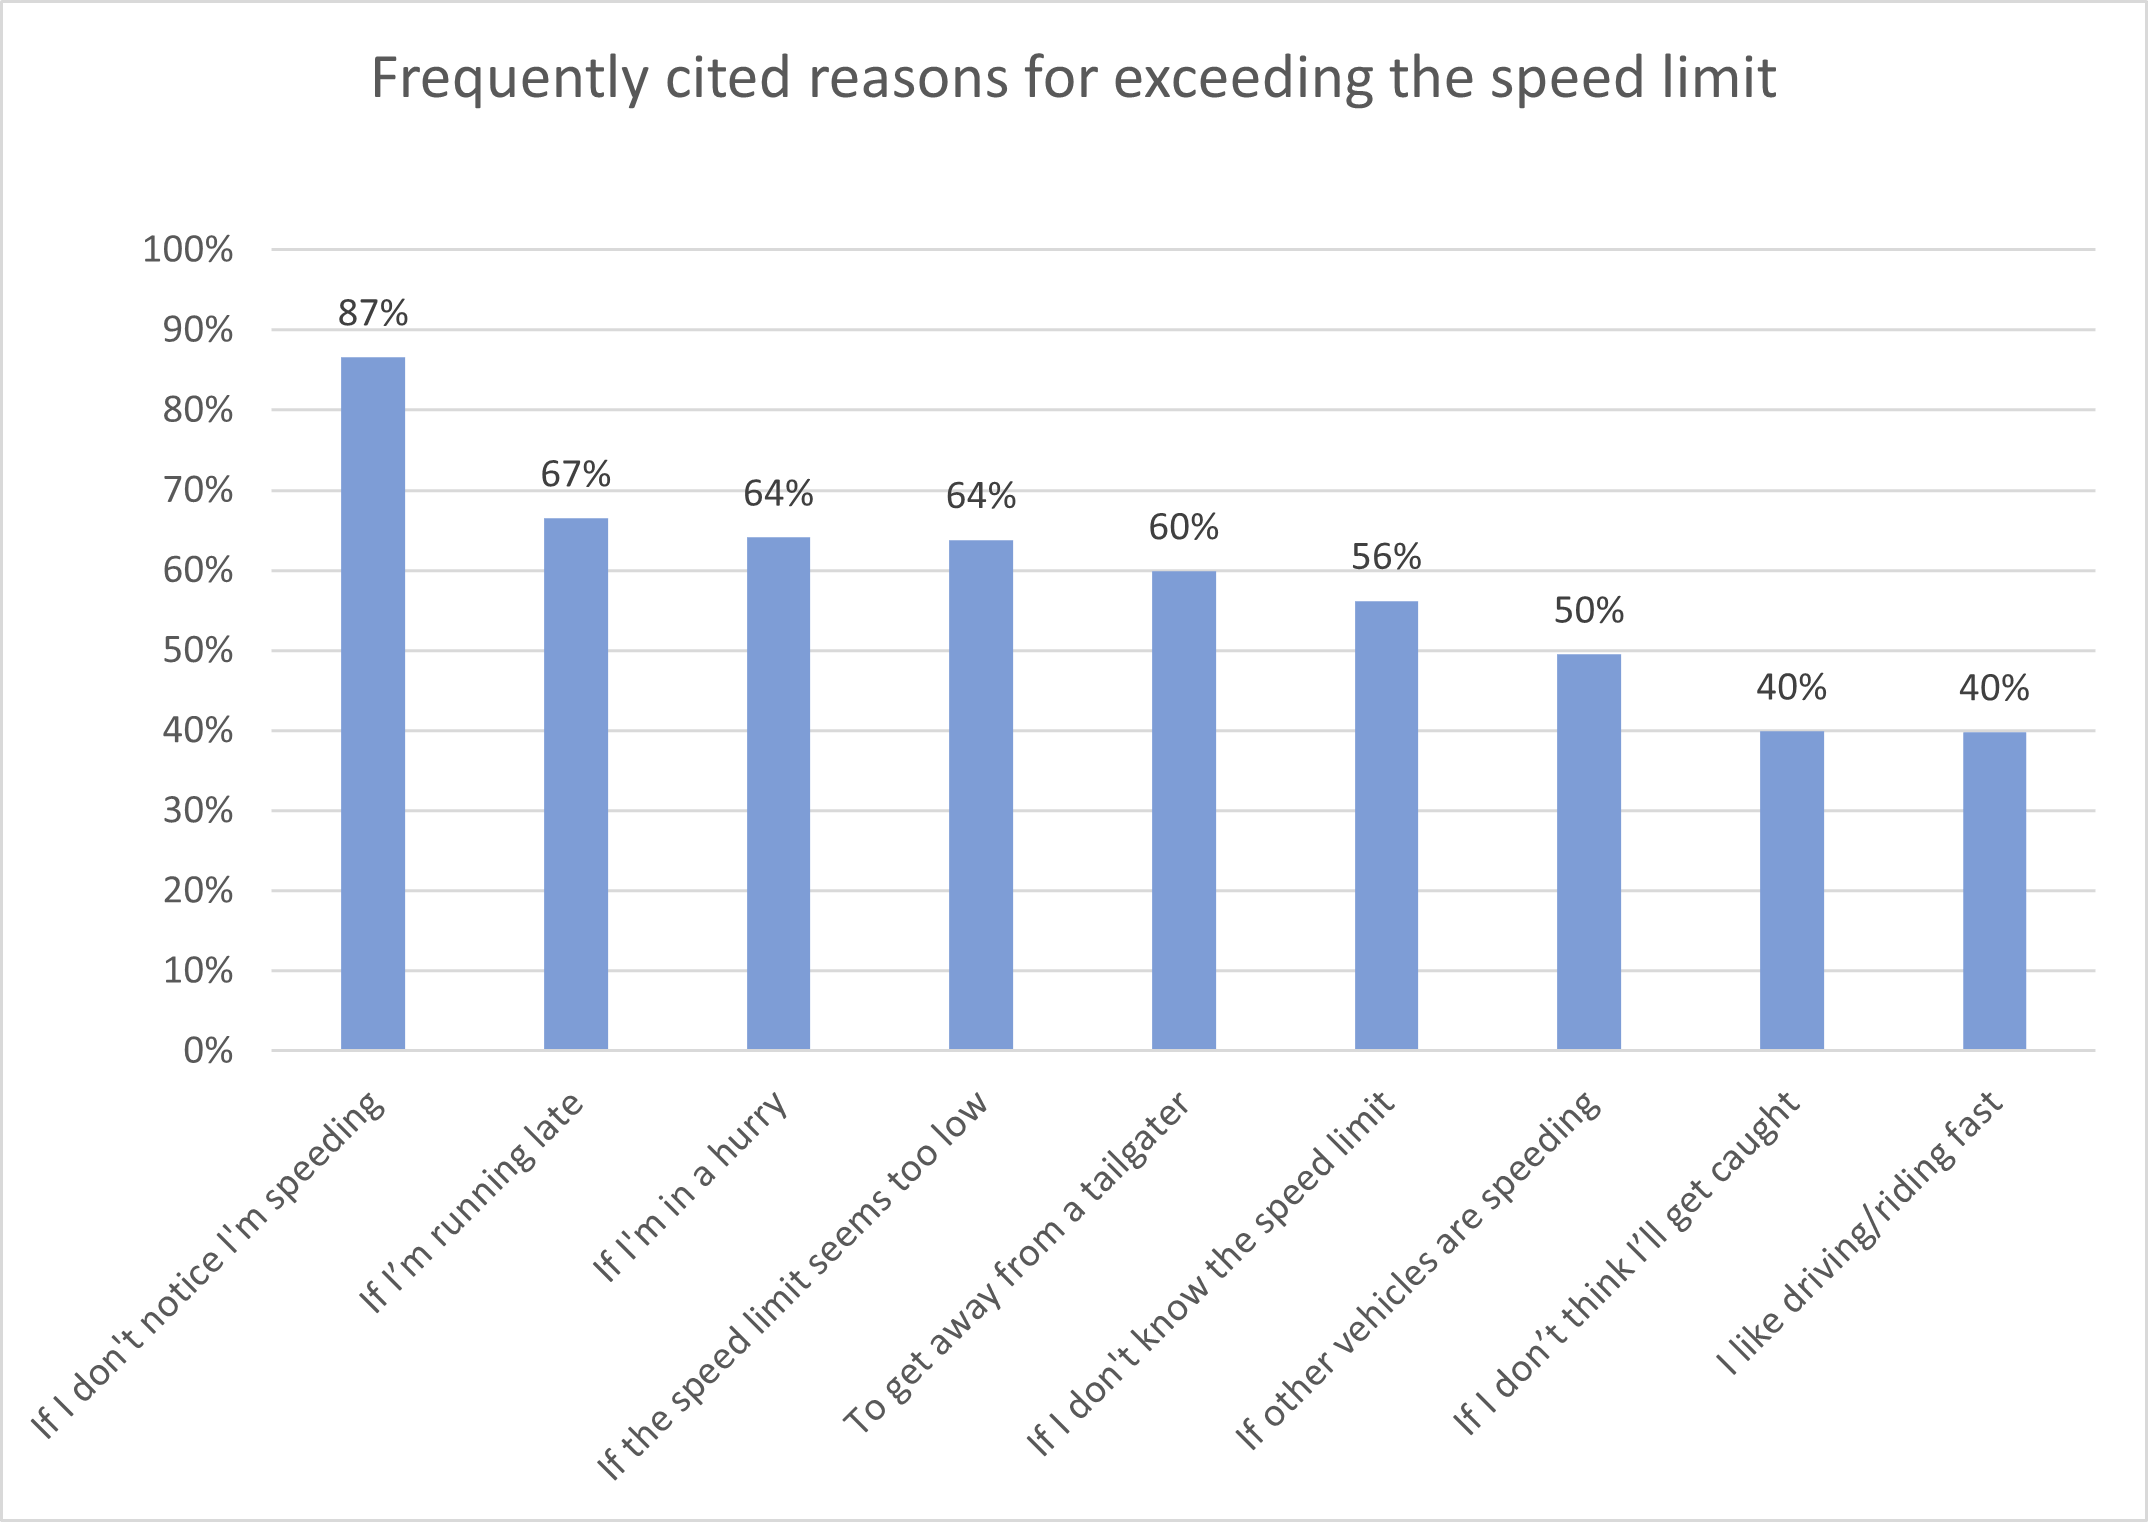
- A survey of 2,031 UK drivers and motorcycle riders in September 2023 found that 66.0% of the drivers surveyed said they always obey speed limits, but 32.3% admitted that they sometimes drive or ride faster than the speed limit, and 1.8% admitted that they often drive or ride faster than the speed limit. 87% of respondents said that they may exceed the speed limit if they haven’t noticed that their speed has been increasing. 64% of respondents said that they may exceed the speed limit if they think the speed limit is too low. In London and Wales, this percentage was even higher: 78%, probably reflecting the recent reduction in the default speed limit from 30 mph down to 20 mph. See the following chart. (Brake, 2023)
- That same survey asked drivers and motorcycle riders a series of questions to elicit their views on speed limits. 57% of respondents agreed that speed limits should be enforced more strongly, and 56% of respondents agreed that everyone who speeds deserves to get caught. However, opinion was divided on what the default speed limit in built-up areas should be. 39% agreed with lowering the default speed limit from 30 mph to 20 mph (which has been done in London and Wales), but 39% disagreed. Furthermore, about 50% of respondents said it was sometimes acceptable to speed on an open road where there isn’t much traffic. Oddly, 54% of respondents said it was often safer to drive below the speed limit, yet 72% of respondents said that it’s annoying when people drive below the speed limit. (Brake, 2023)
- Finally, that same survey asked drivers and motorcycle riders about the highest speed they had ever driven or ridden on a UK road. Large percentages (but not majorities) of respondents admitted they had driven or ridden at least 10 mph over the speed limit: 49% of respondents in built-up areas where the speed limit was 20 mph, 41% in built-up areas where the speed limit was 30 mph, 33% on single carriageways where the speed limit was 60 mph, and 47% on dual carriageways where the speed limit was 70 mph. In fact, 2% of drivers and riders admitted to having travelled at 90 mph or more on single carriageways where the speed limit was 60 mph, and 7% admitted to having travelled at 100 mph or more on motorways or dual carriageways where the speed limit was 70 mph. (Brake, 2023)
- According to US data, even a 10-mph speed increase ups the risk of a crash by 9.1%. (Fortune, 2016)
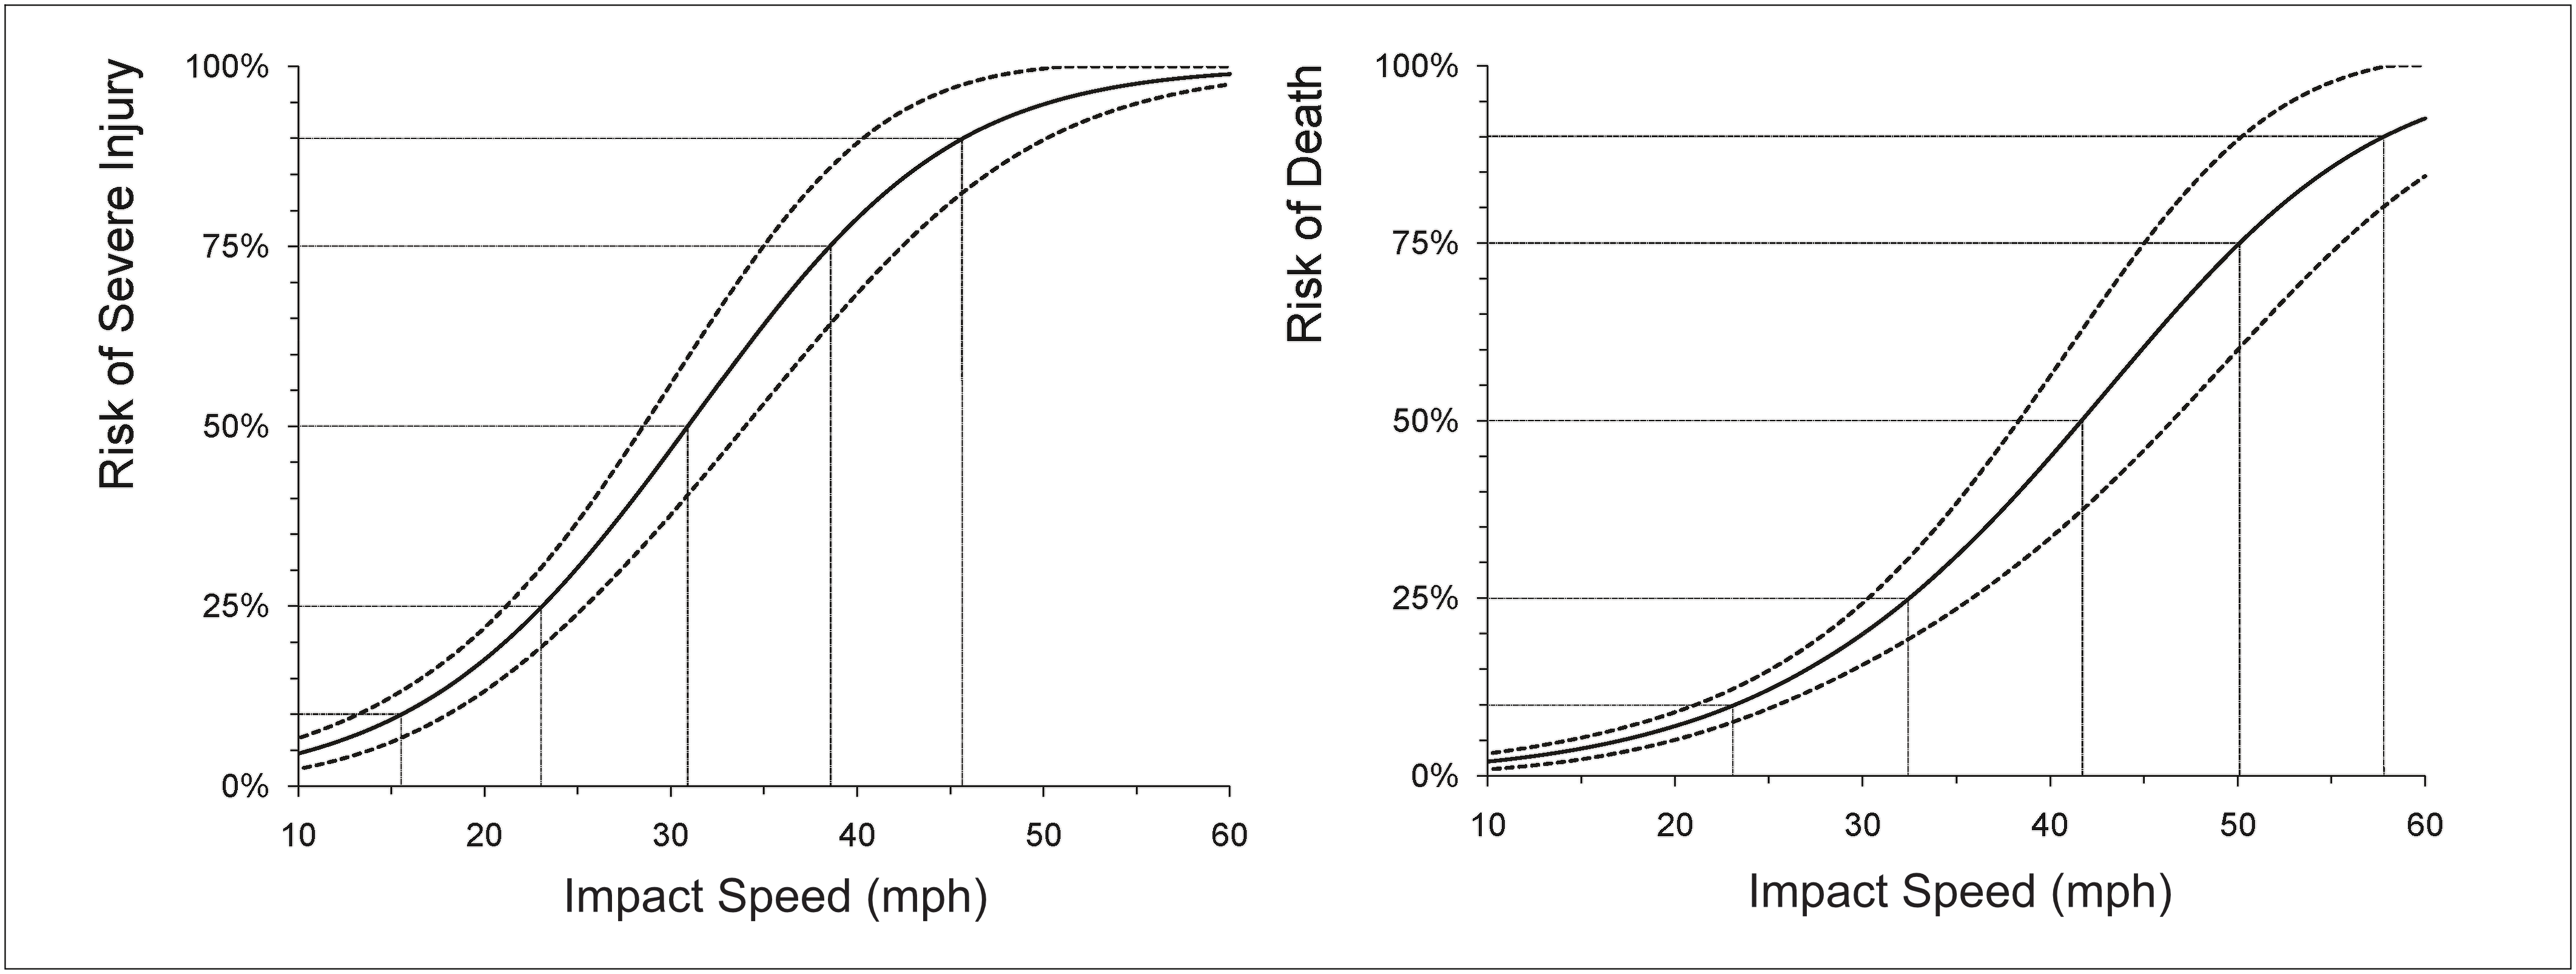
- For a pedestrian, the risk of death or serious injury increases along an S-shaped curve as the vehicle impact speed increases. The following charts from the US AAA Foundation for Traffic Safety show the risk of severe injury to a pedestrian and the risk of death to a pedestrian as a function of vehicle impact speed. The risk was calculated from a sample of 422 pedestrians who had been struck by a car or light truck during the years 1994 through 1998. (AAA Foundation for Traffic Safety, 2011; NHTSA, 2023)
Number of Accidents
- In Great Britain in 2022, there were 106,004 reported road collisions, a rate of about 323 collisions per billion vehicle miles. These collisions included 1,602 fatal collisions and 26,956 collisions involving killed or seriously injured (KSI) casualties. These figures reflect the partial recovery in road traffic in 2022 following the significant declines reached during the height of the COVID pandemic. When road traffic is considered, the number of road collisions and their rate per billion vehicle miles in 2022 had both declined from the levels reached in 2013, which were 138,660 collisions and 449 collisions per billion vehicle miles. (Department for Transport, September 2023)
- There are about 400,000 rear-end shunts (collisions) each year in the UK, accounting for 27% of all road accidents. Rear-end collisions account for about 75% of all bodily injury claims in accidents (usually resulting from whiplash for the occupants of the vehicle that was struck from behind). (RTA Assistance Limited, 2020)
Driving Ability
- More than 90% of road crashes are the result of human error or condition. (Traffic Injury Research Foundation, 2019)
- One in five new drivers will crash within a year of passing their official driving test. (Brake, 2023)
- A survey of 2,010 UK drivers in July 2020 found that 27% of the drivers surveyed knew what a smart motorway is but did not know the rules for driving on one. Another 25% of the drivers did not even know what a smart motorway is. 18% of drivers surveyed admitted to leaving less than a two-second gap to other vehicles when driving on a motorway in normal weather: 10% said they left a gap of one to two seconds, 6% left a gap of one second, and 2% left a gap of less than one second. (The Highway Code recommends a two-second gap for safety, should the vehicle in front suddenly stop or slow down.) Finally, only 26% of drivers surveyed knew that the correct stopping distance of a car at 70 mph in normal weather is 24 car lengths (96 metres). The other drivers surveyed either did not know or thought the stopping distance was less; 14% of the drivers thought that the stopping distance was only 9 car lengths (36 metres). Such drivers may underestimate the amount of room they should leave for other vehicles when driving on a motorway whose speed limit is 70 mph. (Brake, 2020)
Aggressive Driving Statistics
- In 2018, aggressive driving contributed to 3,261 road accidents, including 114 fatal accidents. (Brake, 2020)
- 43% of drivers report being victimised by other drivers who were experiencing road rage. (Brake, 2020)
- A survey of 2,019 drivers in March 2020 (after the start of the COVID pandemic in the UK) found that a significant minority of drivers admitted to engaging in certain aggressive driving behaviours often or even regularly. Moreover, a larger share of younger drivers admitted to engaging in aggressive driving. (Brake, 2021)
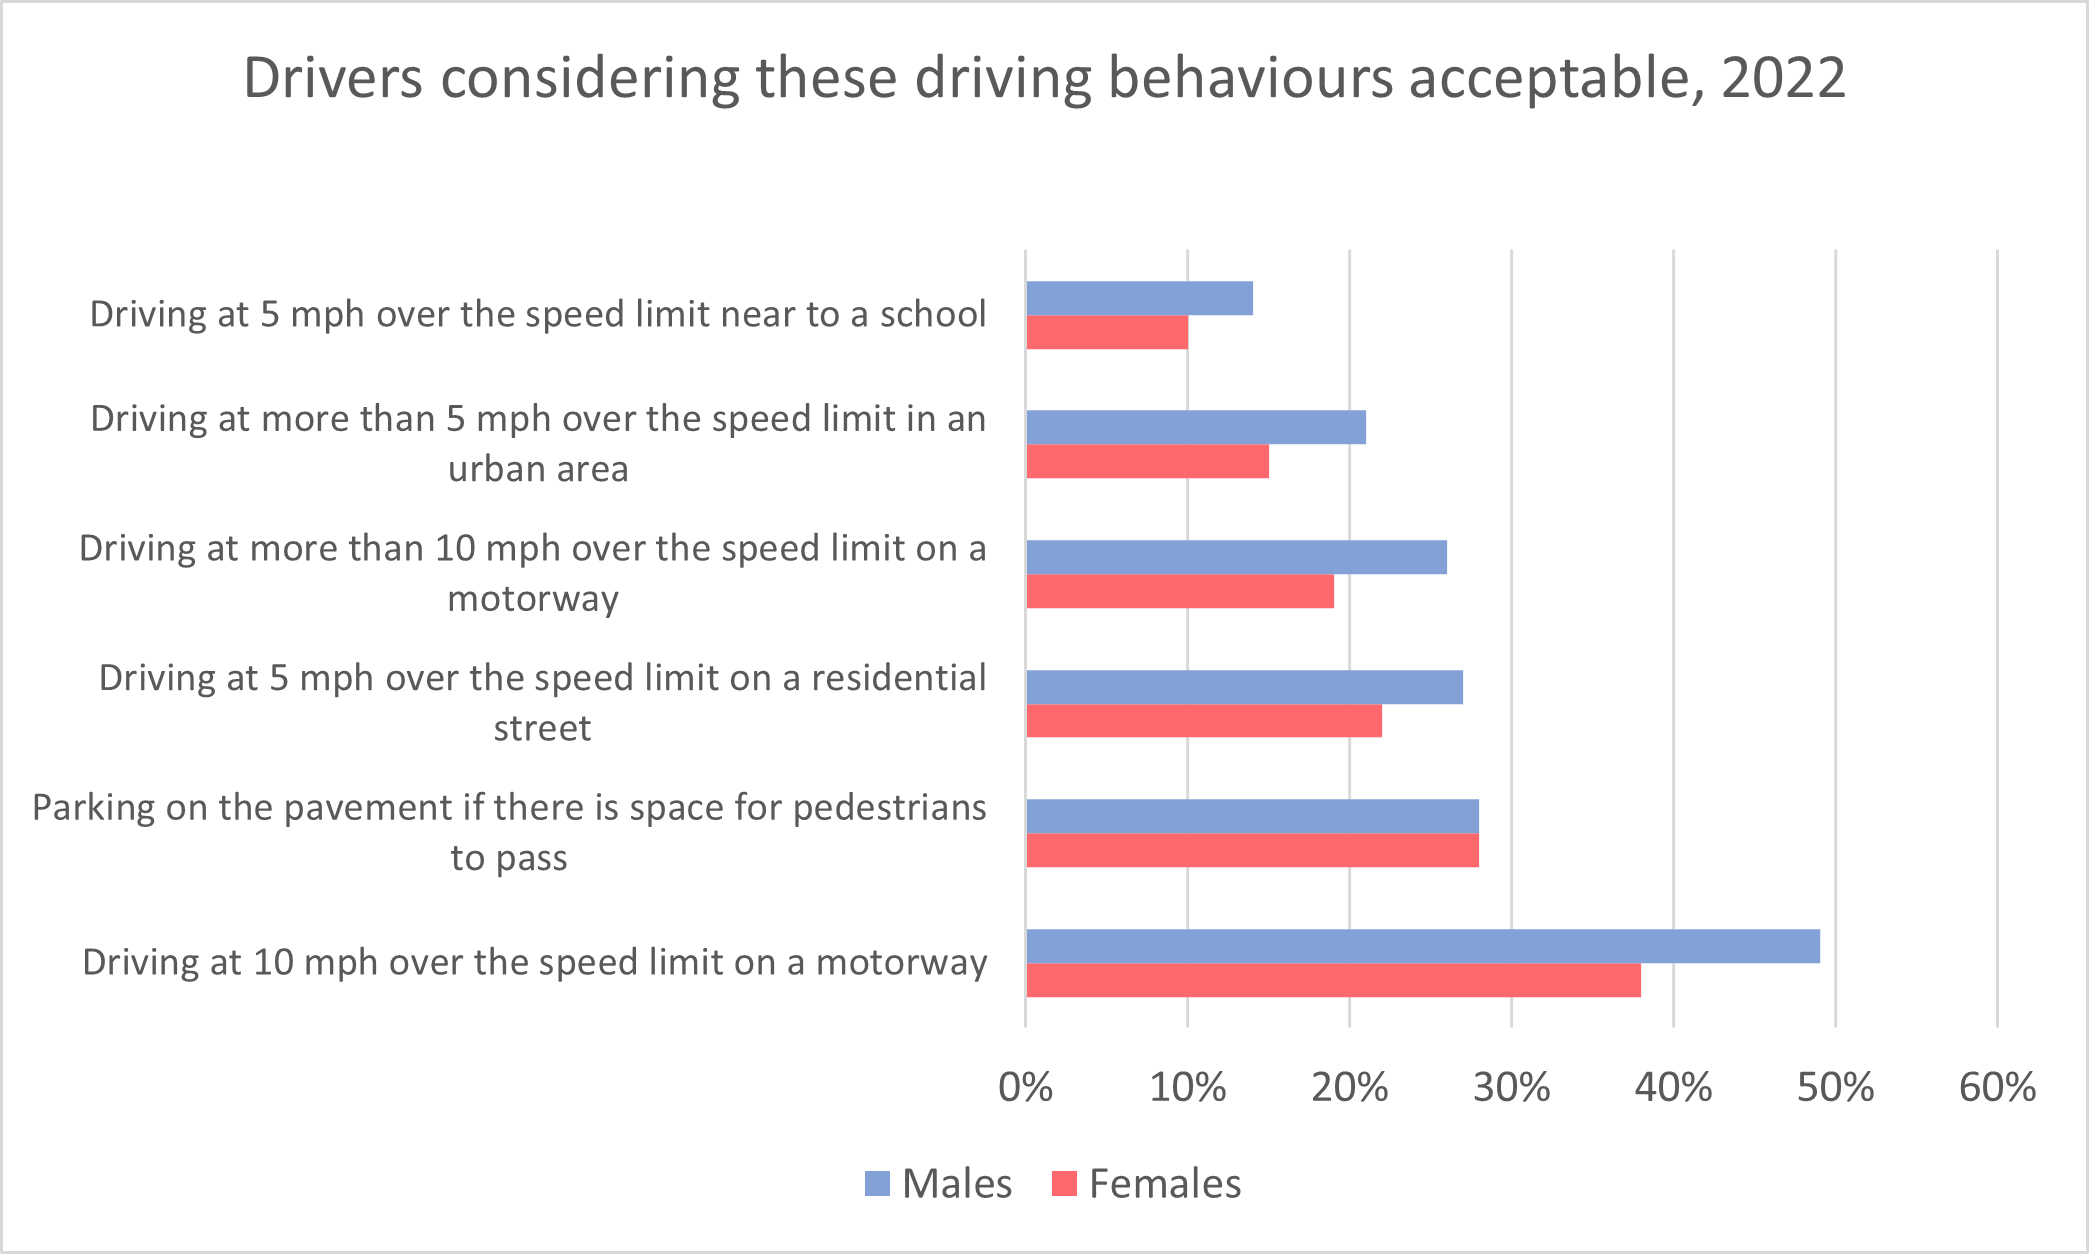
- An IAM RoadSmart survey of 2,010 UK drivers in December 2022 found that significant percentages of these drivers considered certain illegal and unwise driving behaviours acceptable. For example, 38% of female drivers and 49% of male drivers considered it acceptable to drive at 10 mph over the speed limit on a motorway. See the following chart.
- Furthermore, significant percentages of the drivers surveyed admitted to engaging in the following risky driving behaviours regularly or often within the previous 30 days:
- 9% of females, 16% of males: drove at 10 mph over the speed limit on a motorway
- 11% of females, 13% of males: parked on the pavement
- 13% of females, 15% of males: drove at 5 mph over the speed limit on a residential street
- 6% of males, 6% of females: drove while drowsy and tired (IAM RoadSmart, 2023)
- A survey of 1,000 drivers in 2018 found that 42% of drivers aged 18–34 admitted to experiencing road rage at least once a week, and 14% of younger drivers experienced road rage every day they drove. 20% of drivers aged 35–54 and 7% of drivers over 55 years of age experienced road rage once a week. (BigChange, 2018)
- That same survey found that among drivers who drove regularly for work, female drivers were more likely to experience road rage than male drivers. 27% of female drivers and 18% of male drivers experienced road rage at least once a week. (BigChange, 2018)
- From September 2019 to October 2020, there were around 330 incidents of roadworkers suffering verbal or physical abuse from motorists. (Highways England, November 2020)
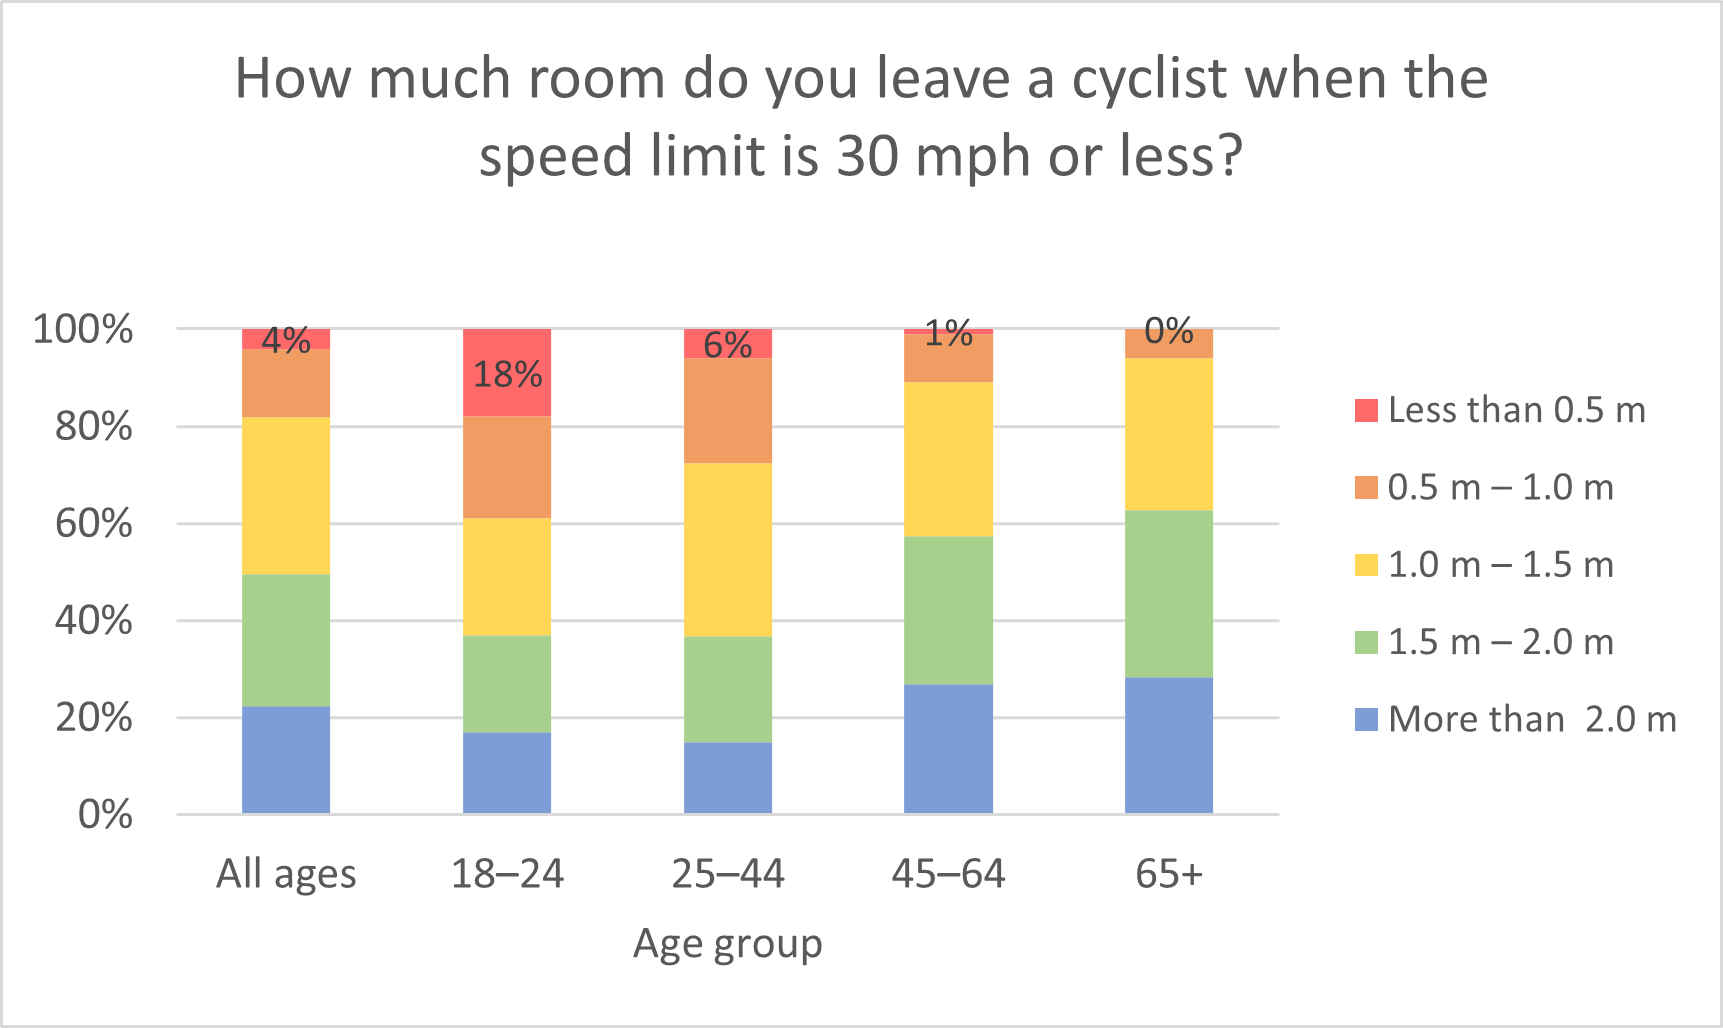
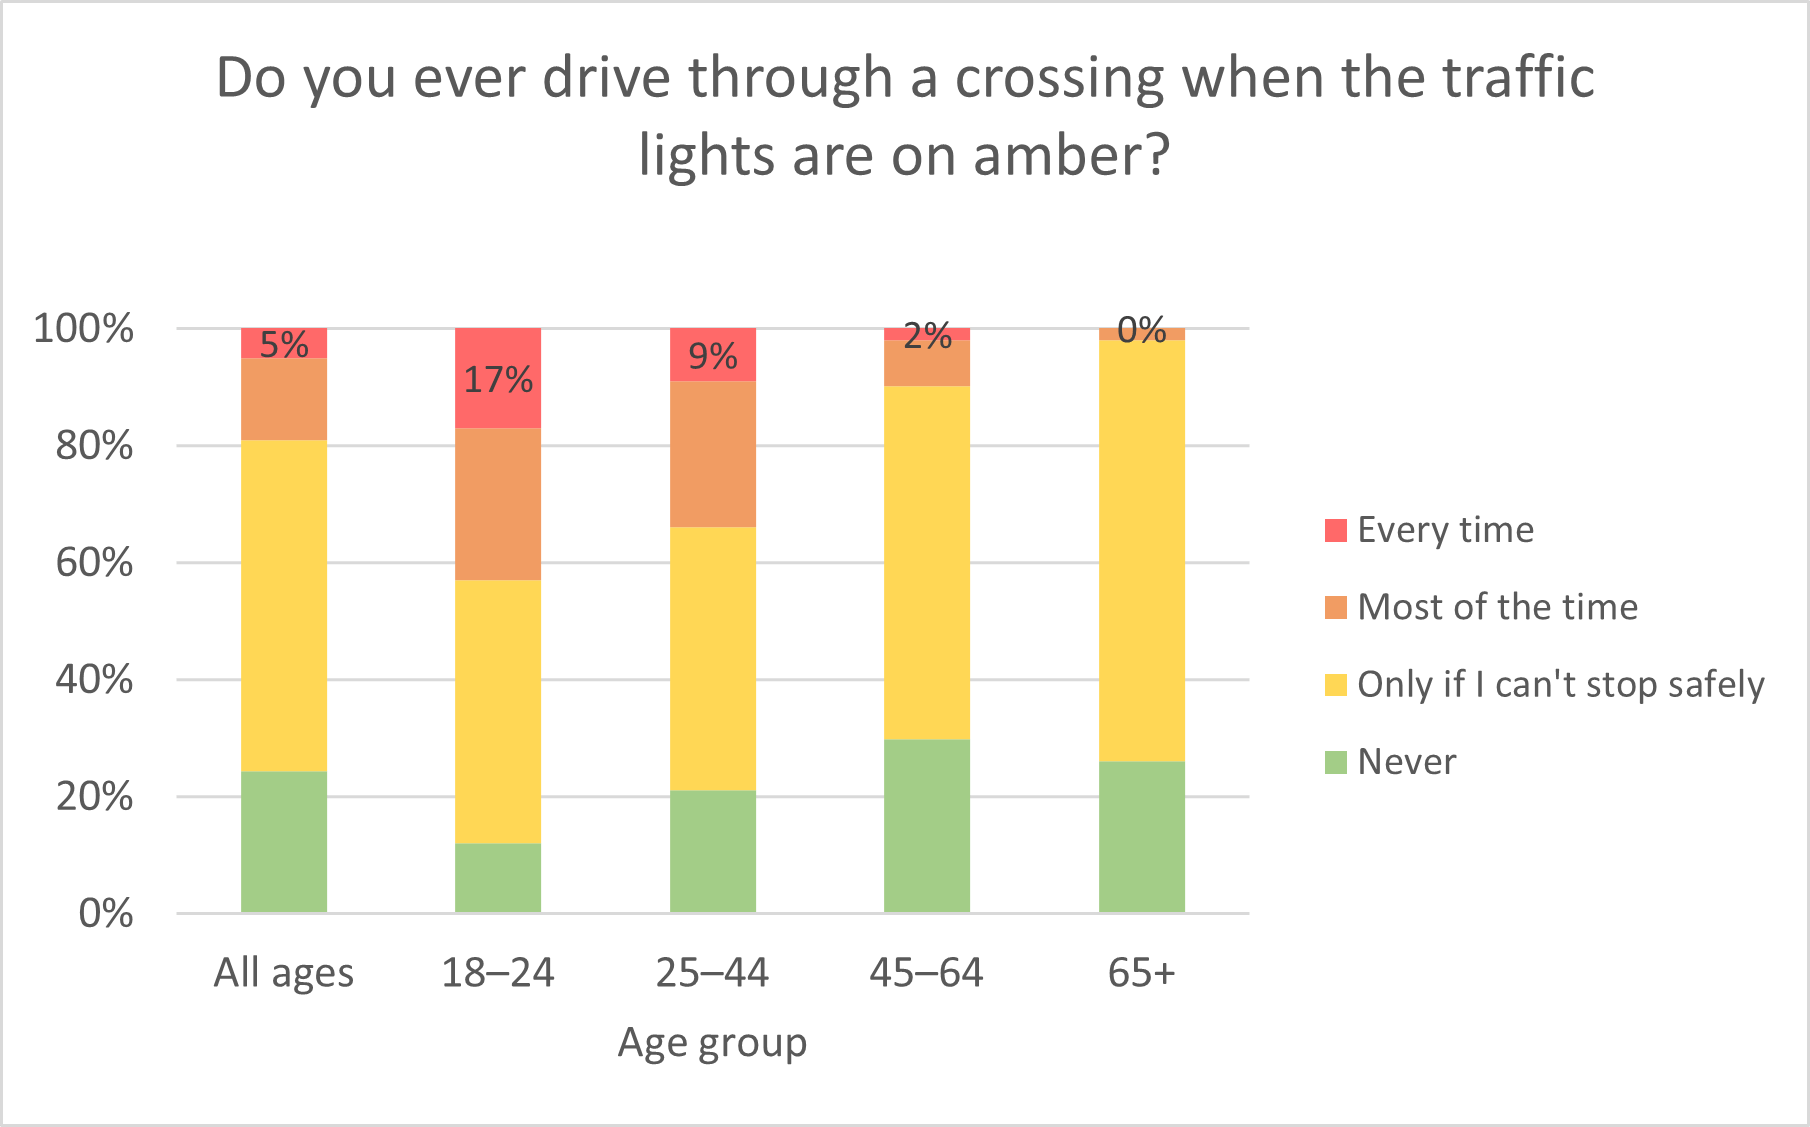
In particular, 18% of drivers aged 18 to 24 admitted to leaving less than 0.5 metres of space when passing a cyclist (which is dangerously close). Virtually no drivers aged 65 and older admitted to doing this. Also, 17% of drivers aged 18 to 24 admitted to regularly driving through crossings when the traffic lights were on amber. In contrast, 26% of drivers aged 65 and older stated that they never did this. See the following two charts. (Brake, 2021)
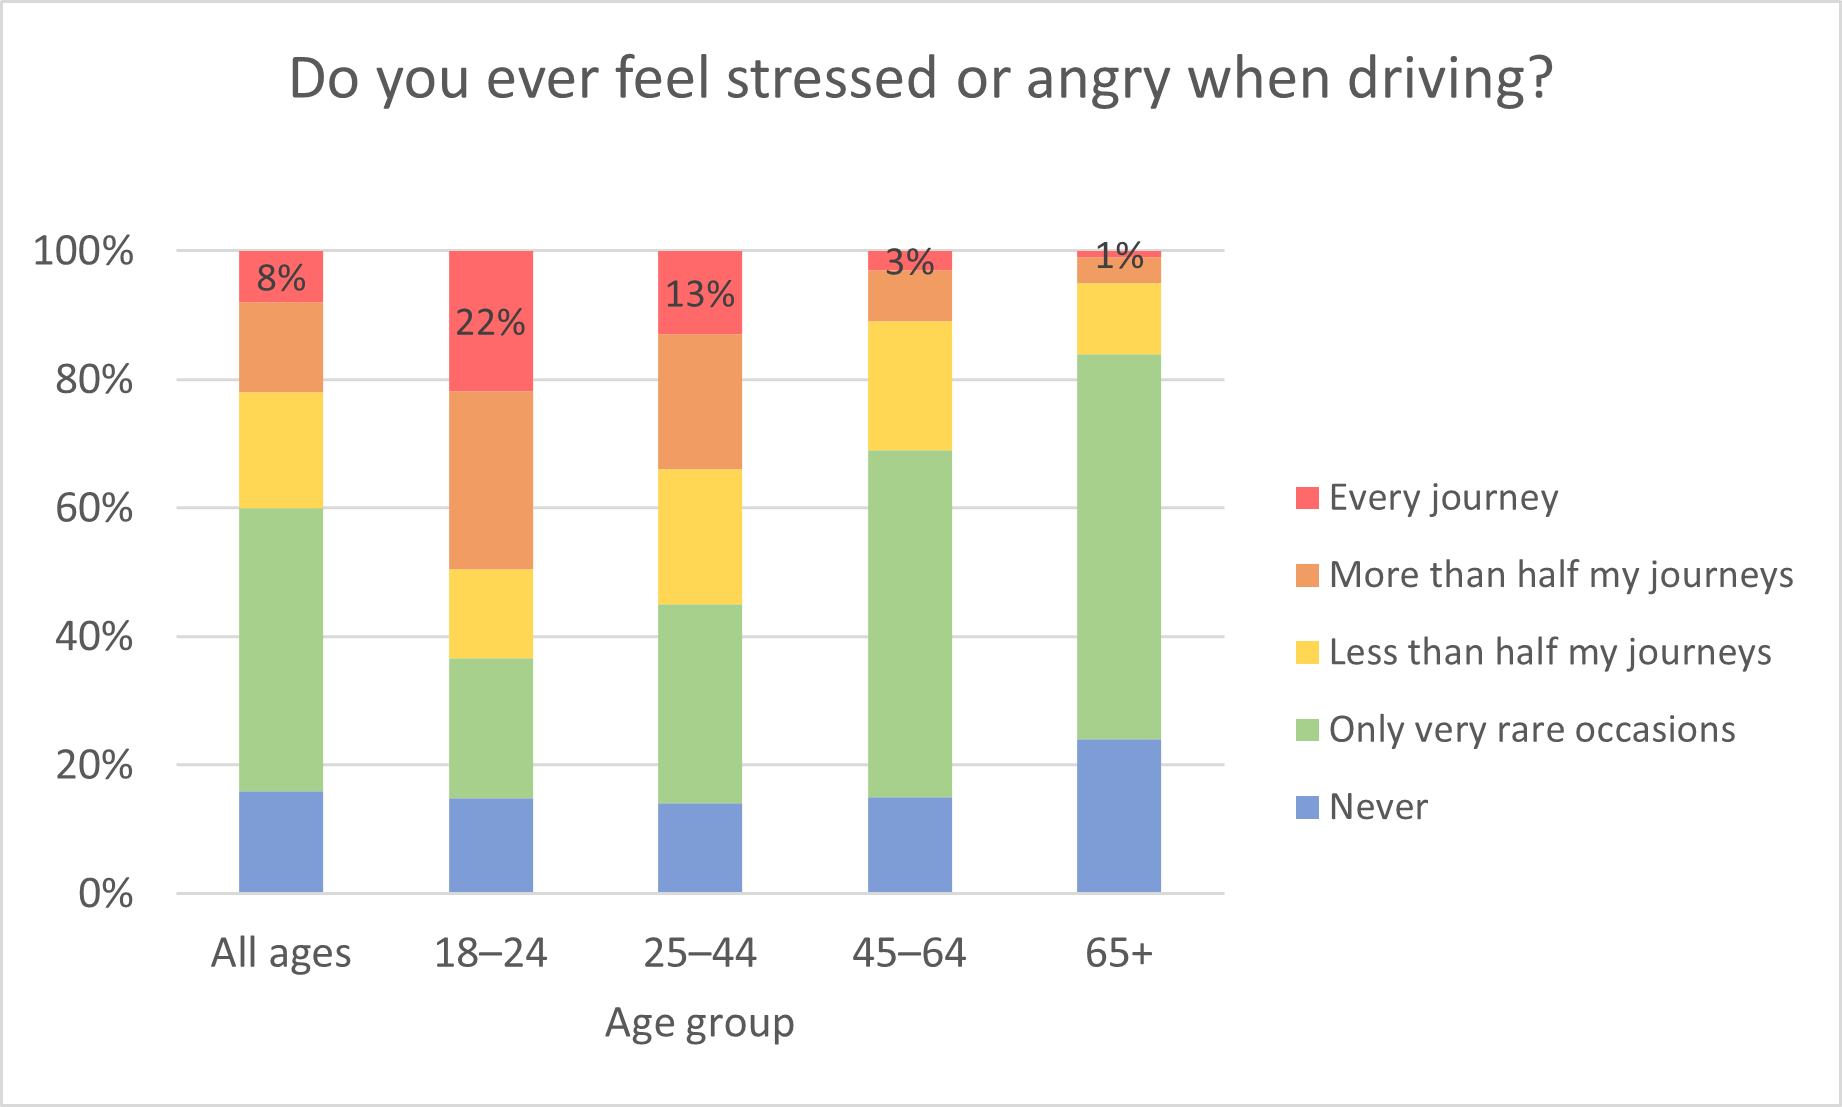
In that same survey, 8% of all surveyed drivers and 22% of drivers aged 18 to 24 (compared with just 1% of drivers aged 65 and older) stated that they always felt stressed or angry when they drove. Moreover, many drivers indicated an awareness of how stress or anger led them to drive more aggressively and distracted them from the task of driving: 15% of drivers stated that when stressed or angry, they tended to drive faster. 14% of drivers stated that they tended to drive closer to the vehicles in front. 18% said that they tended to accelerate and brake more harshly. And 15% stated that they tended to be less focused on the task of driving. See the following chart. (Brake, 2021)
In March 2021, a year into the COVID pandemic, a follow-up question on stress or anger was asked of these drivers again. The percentage of all surveyed drivers stating that they always felt stress or anger when driving had increased from 8% in 2020 to 11% in 2021. The percentage of drivers who said they never felt this way had decreased from 16% in 2020 to 10% in 2021. (Brake, 2021)
Pedestrian Safety
- Pedestrians have a 90% chance of surviving a crash at 30 km/h (19 mph) or less but only a 50% chance at higher speeds. (AutoInsurance.org, 2018)
- A pedestrian who is struck at 32 km/h (20 mph) has a 10% chance of dying. A pedestrian who is struck at 64 km/h (40 mph) has an 80% chance of dying. (Active Transportation Alliance, 2018)
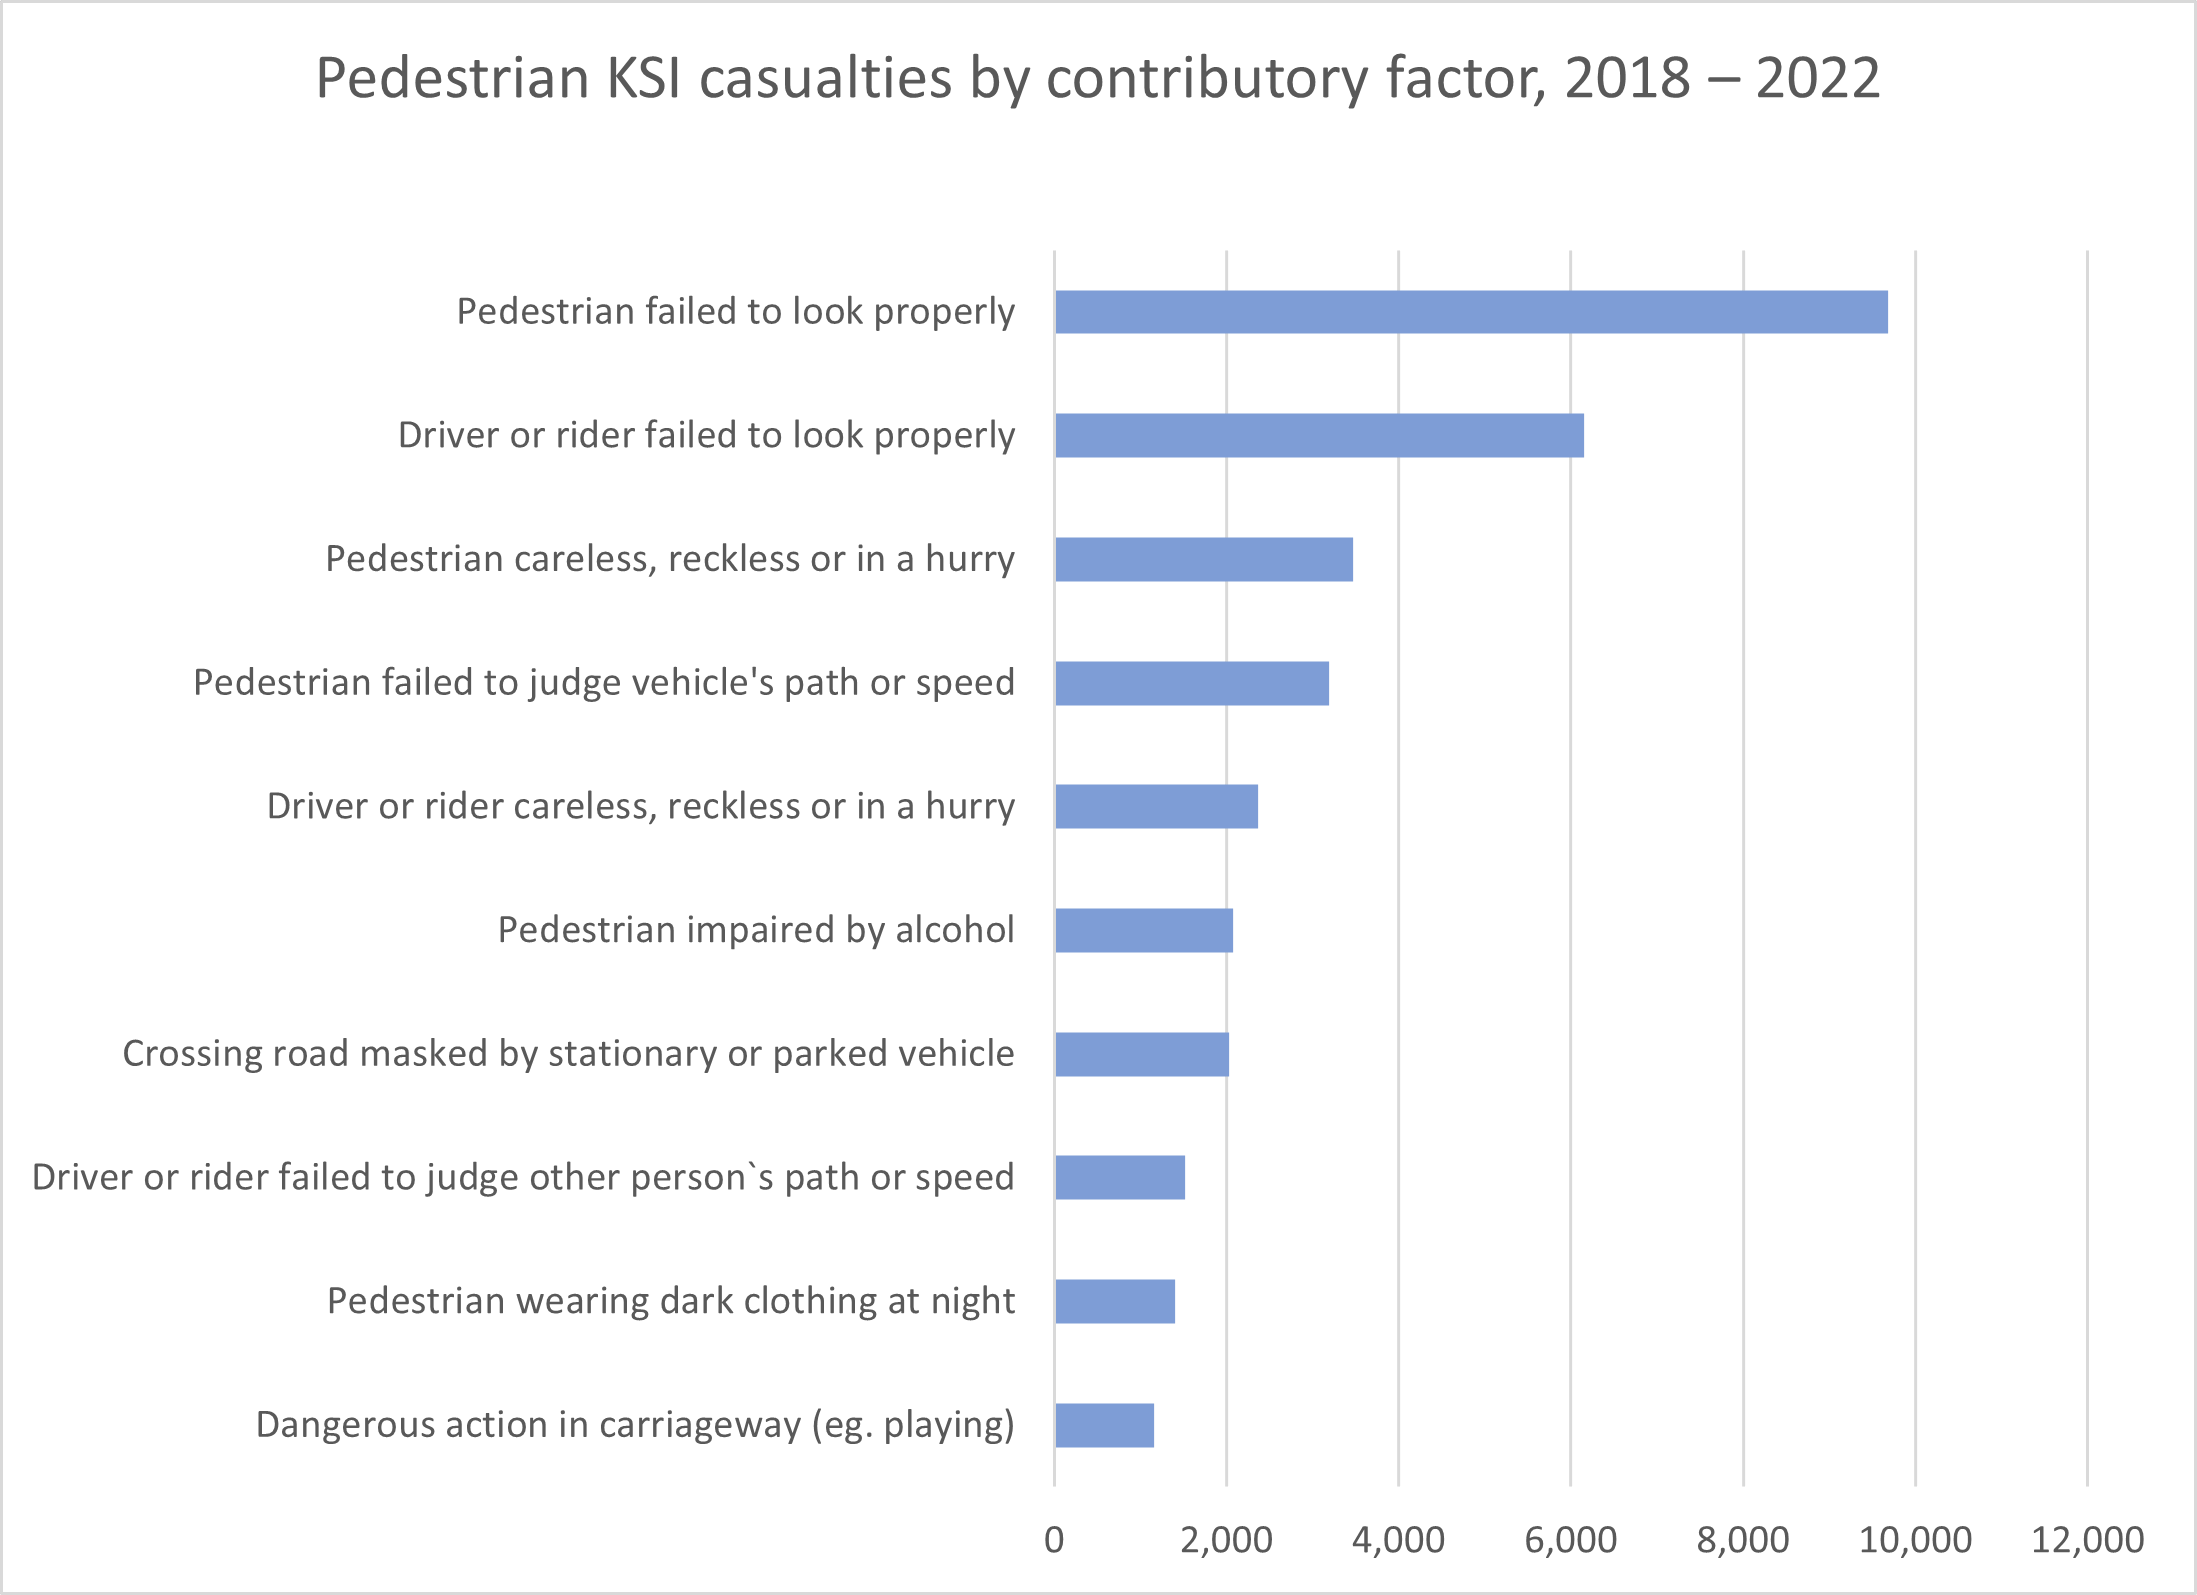
- In Great Britain from 2018 to 2022, of the 10 most common contributory factors in collisions involving pedestrians killed or seriously injured (KSI), six were pedestrian related and four were driver related. ‘Failed to look properly’ was the most common contributory factor for both drivers and pedestrians. See the following chart. Note that the pedestrians were judged careless, reckless or in a hurry more often than the drivers were. (Department for Transport, September 2023)
Pedal Cyclist Safety
- From 1979 to 2022, the pedal cyclist fatality rate per billion miles decreased by 79%. (See the section General Driving-Related Injuries and Fatalities.) (Department for Transport, 2023)
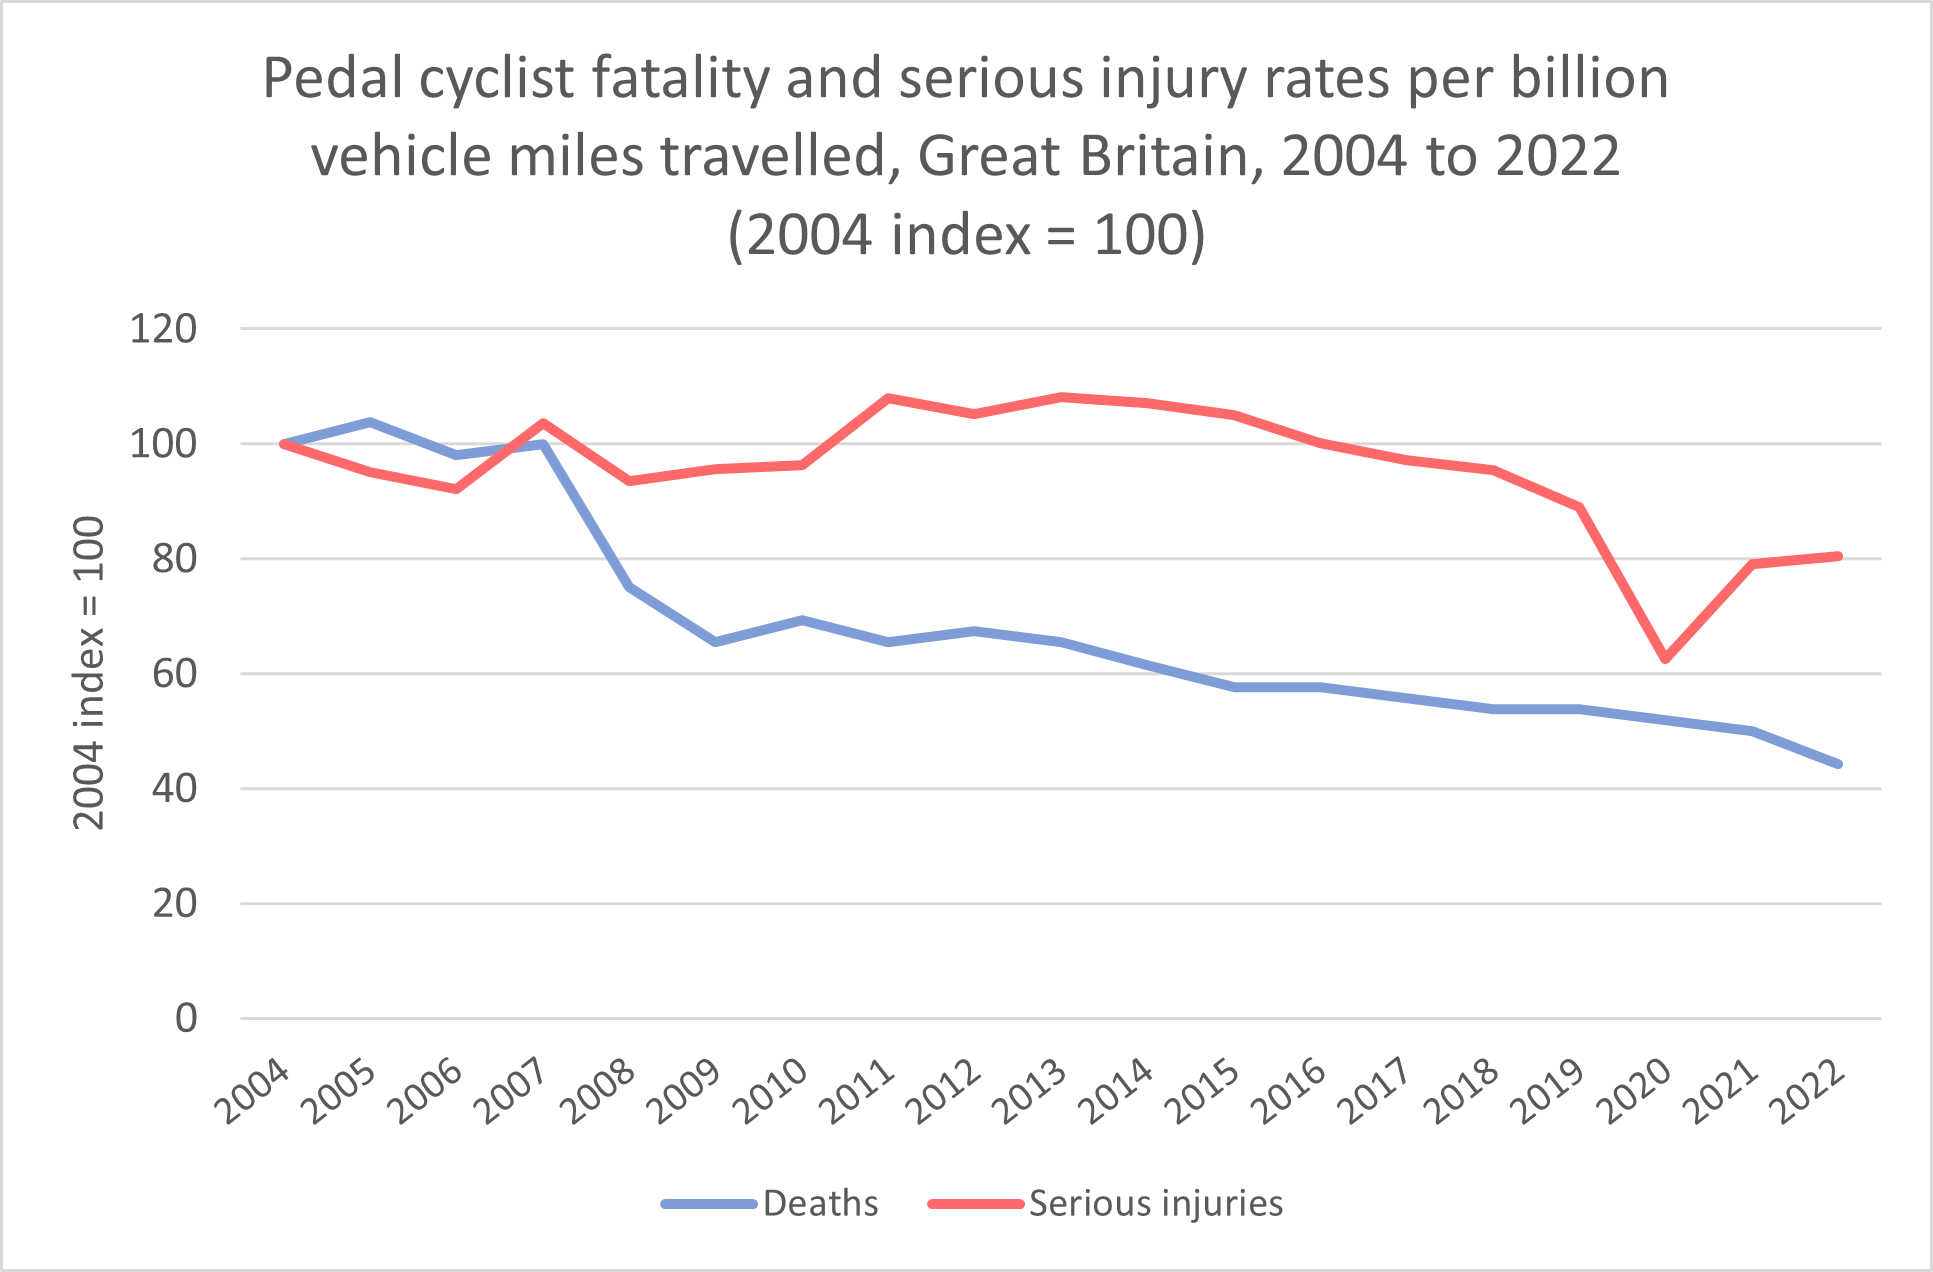
- From 2004 to 2022, the number of pedal cyclist fatalities decreased by 32% even as cycle traffic in miles increased by 51%. As a result, the fatality rate per billion vehicle miles travelled decreased by 56% in that period. The rate of serious injuries also decreased: by about 20%, although there was a temporary sharper decline in 2020 during the COVID pandemic. See the following chart. (Department for Transport, 2023)
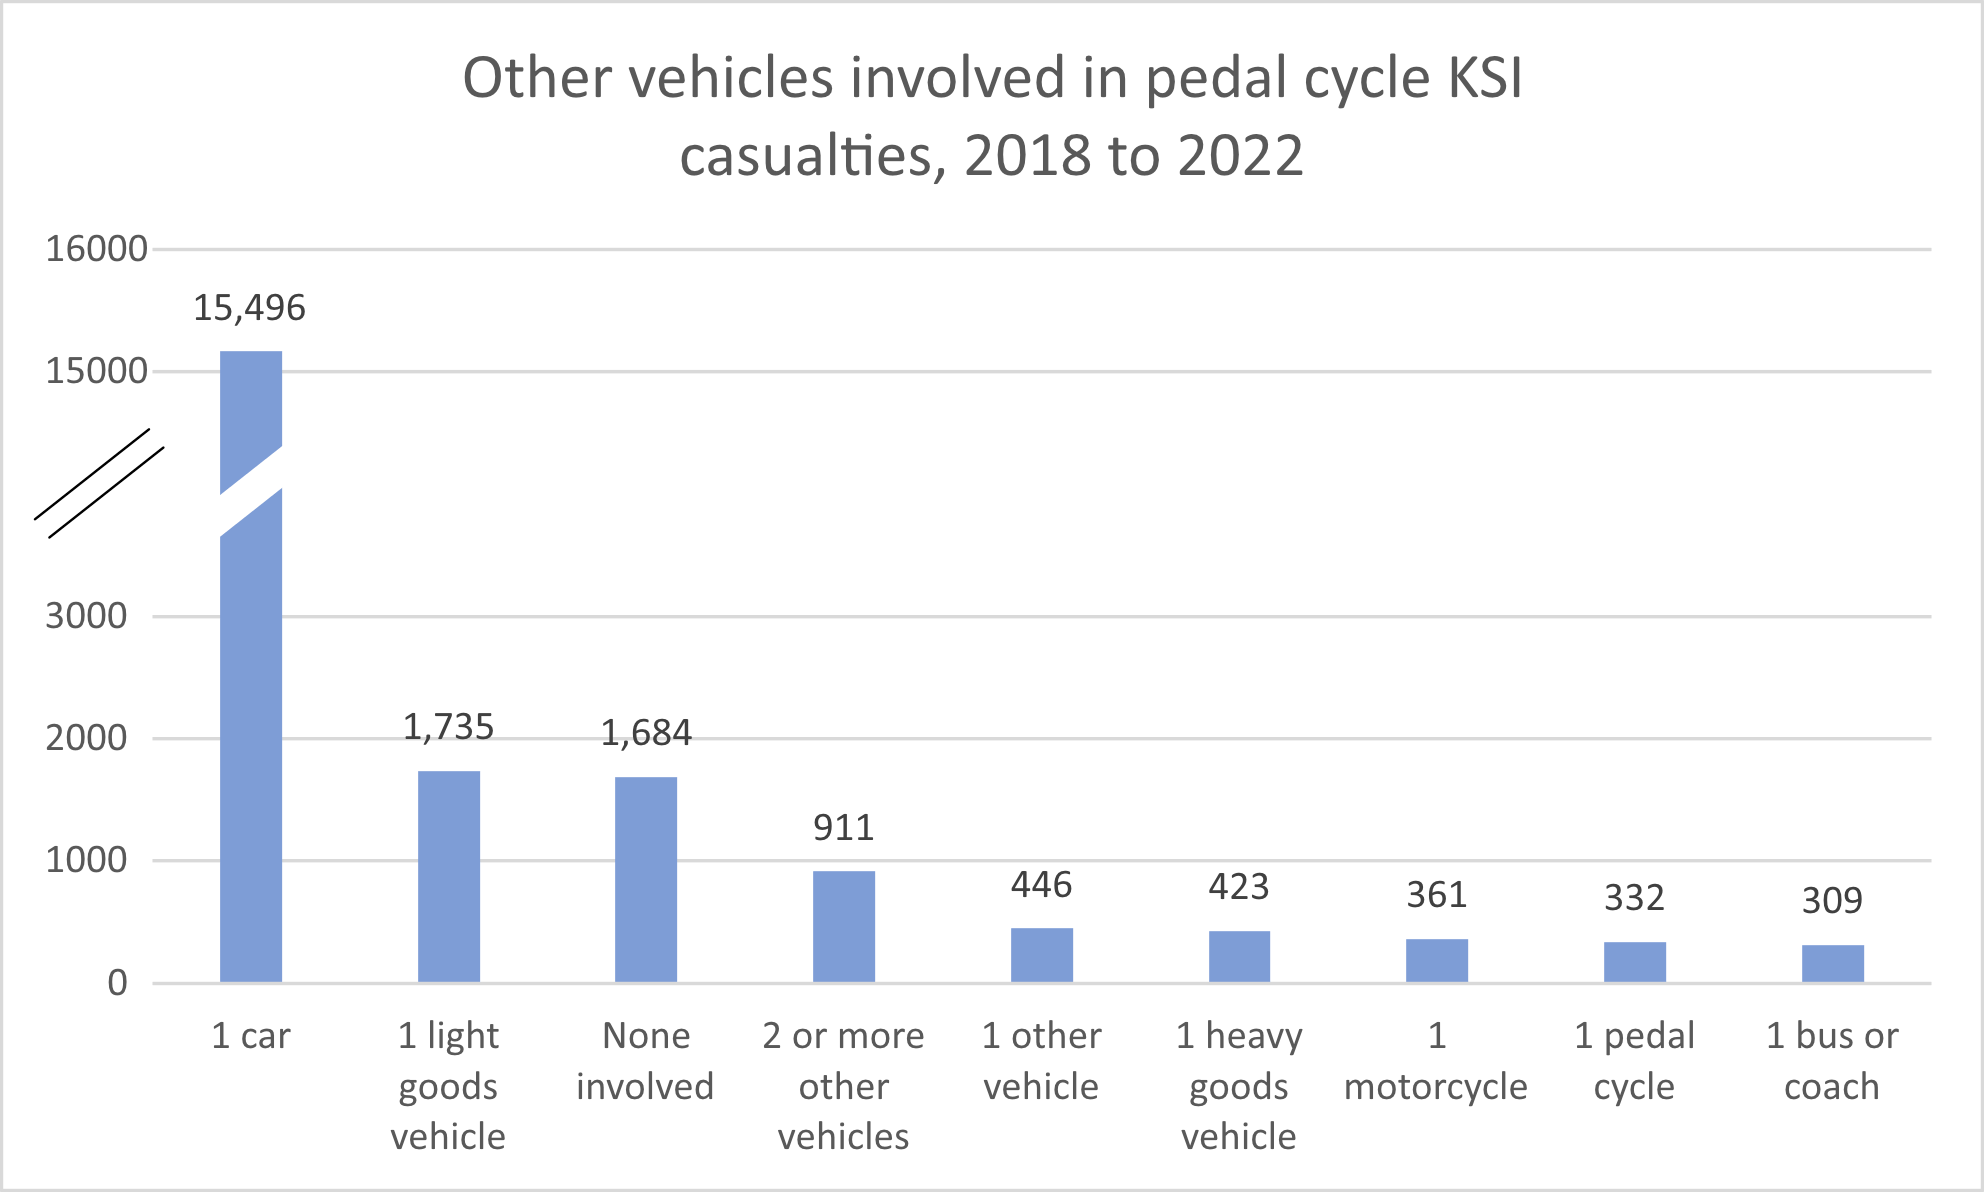
- The following chart lists vehicle types that were involved in fatal or serious-injury collisions with pedal cycles from 2018 to 2022. 71.4% of cyclist killed or seriously injured (KSI) casualties involved a collision with a car. However, there were less common scenarios as well, such as a pedal cycle being involved in a KSI collision with a bus or coach, a motorcycle, or even another pedal cycle. And in about 7.8% of pedal cycle KSI casualties, no other vehicles were involved. (Department for Transport, September 2023)
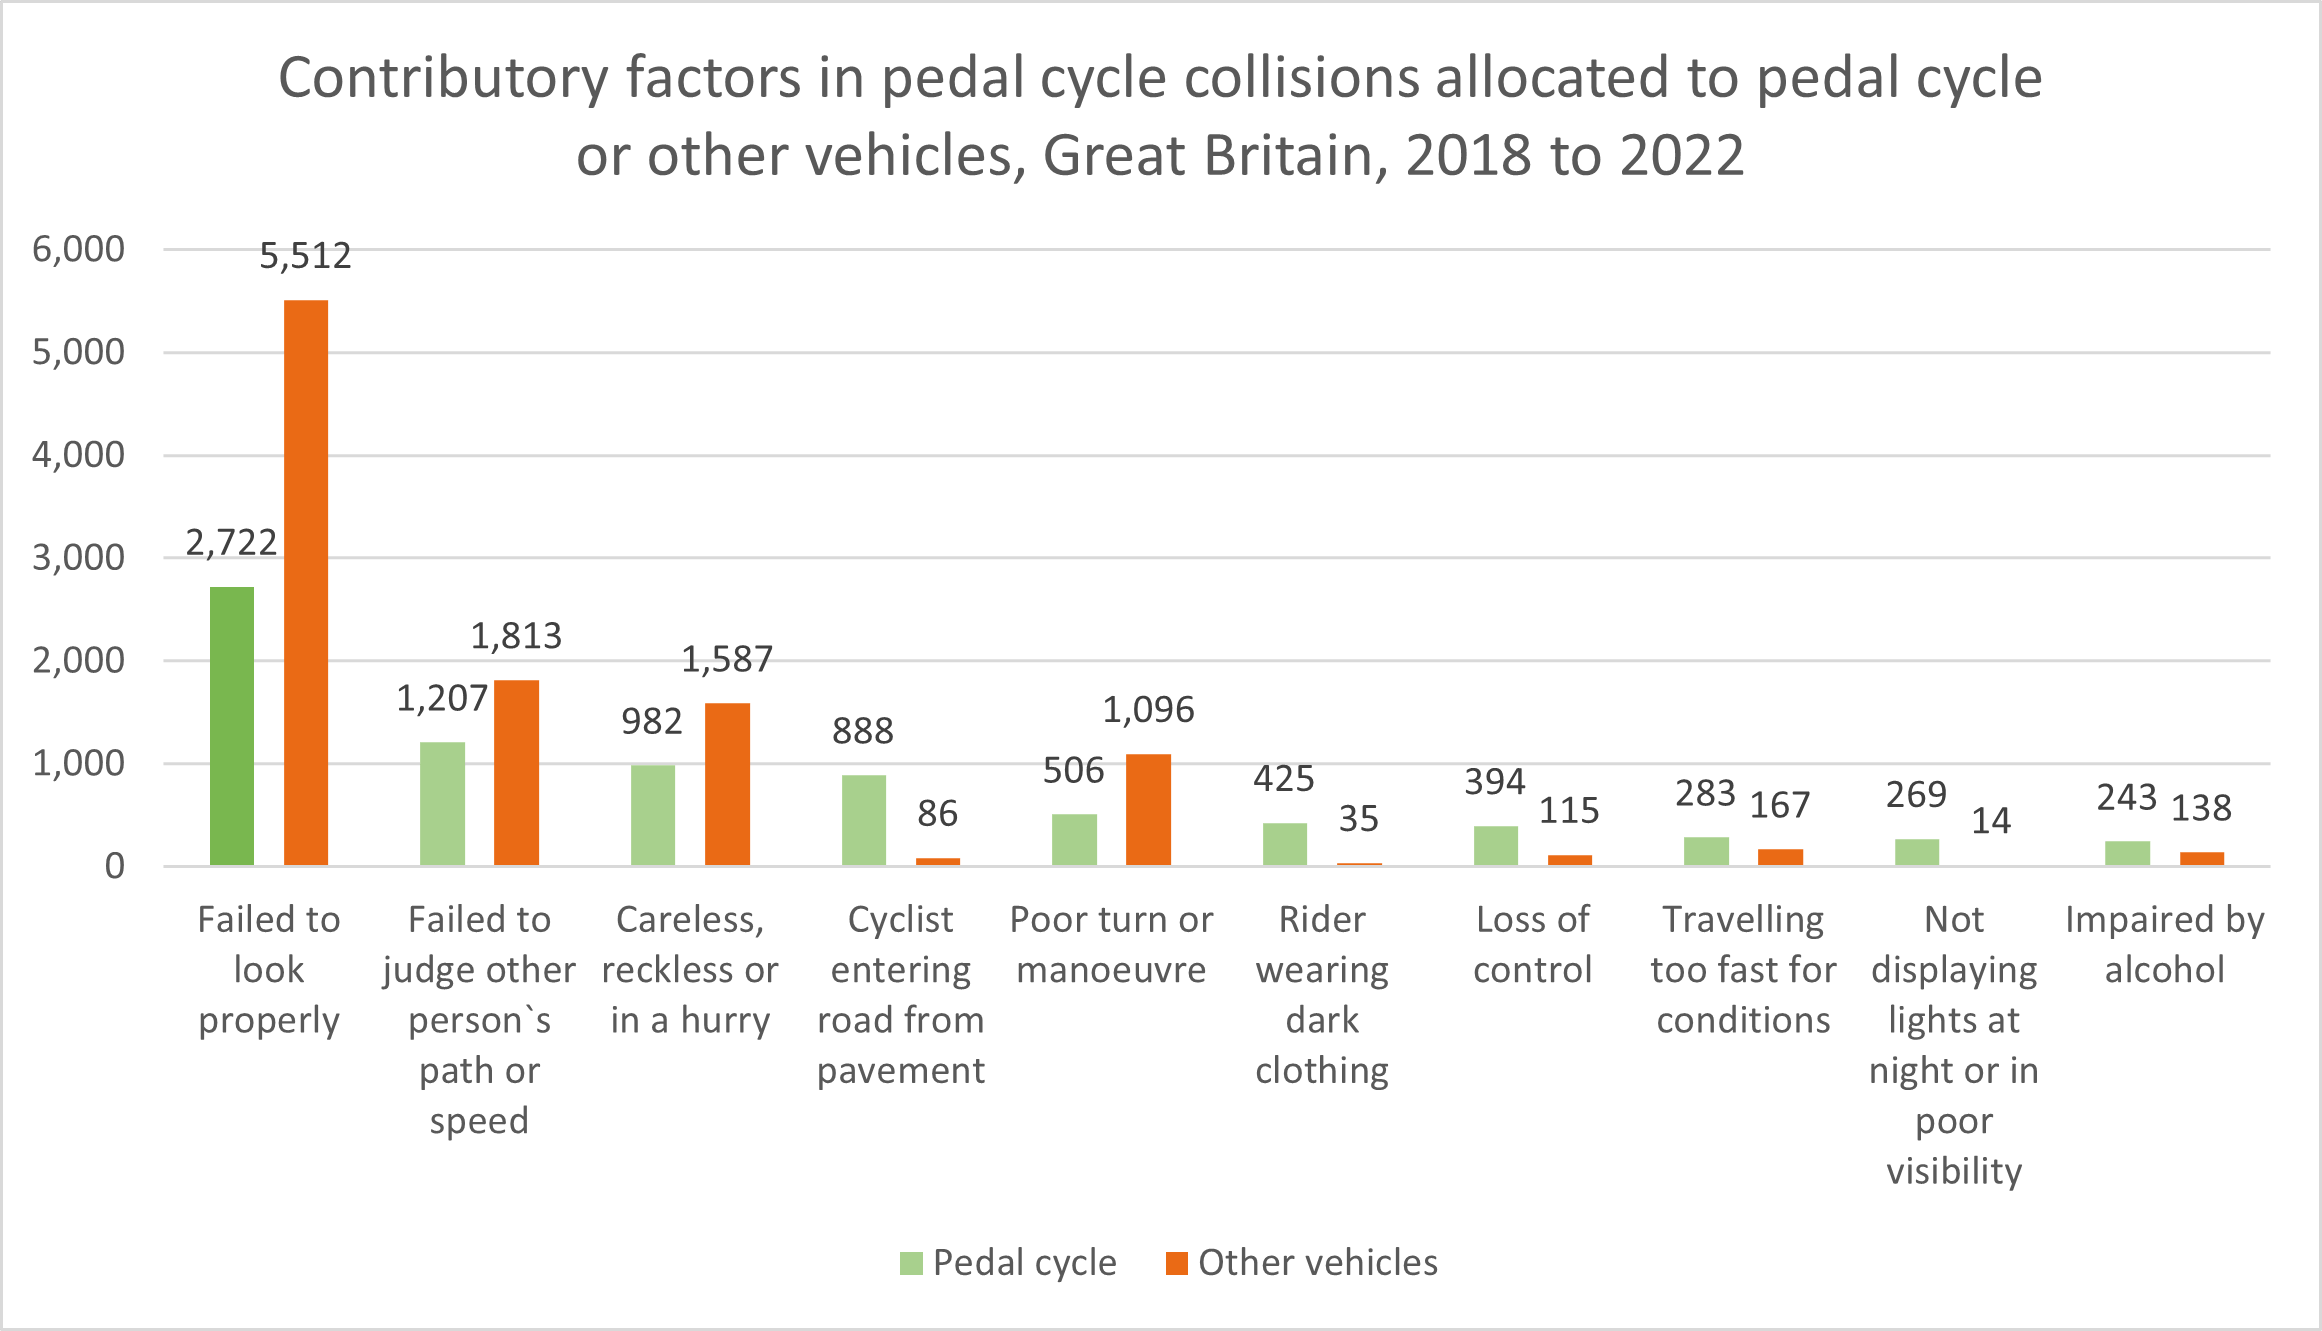
- The following chart lists the most common contributory factors in fatal or serious pedal cycle collisions from 2018 to 2022 that were allocated to the pedal cycle or the other vehicles involved in the collision. The three most common contributory factors for the pedal cyclist were also the three most common for the operators of the other vehicles: ‘failed to look properly’, ‘failed to judge another person’s path or speed’ and ‘careless, reckless or in a hurry’. However, these three factors were allocated to the operators of the other vehicles much more often than to the pedal cyclist. On the other hand, the contributory factors ‘travelling too fast for conditions’ and ‘impaired by alcohol’ were allocated to the pedal cyclist more often than to the operators of the other vehicles. (Department for Transport, September 2023)
Wildlife Safety
- One million animals and ten million birds are killed on UK roads each year. (Post Office® Car Insurance, 2008)
- Road collisions with deer are responsible for some 20 human deaths and 400 human injuries on England’s strategic road network each year. (Highways England, 2019)
- Between 40,000 and 74,000 deer are killed or injured on UK roads every year. (The British Deer Society, 2024)
- An average of 50,000 badgers, 100,000 foxes and 167,000 – 335,000 European hedgehogs are killed on UK roads each year, representing 10–20% of the European hedgehog’s annual mortality. (The Mammal Society, March 2016; US National Institutes of Health, October 2021)
During the Winter
- During the winter, UK drivers are 15% more likely to be involved in a collision than during the summer. This increase varies by region. In London, drivers are 9% more likely to be involved in a collision during the winter, but in the West of England, they are 28% more likely. (Insure the Box Limited, February 2020)
- In 2022, the following contributory factors were allocated to vehicles involved in road collisions: slippery road due to weather (3.4% of vehicles in collisions); rain, sleet, snow or fog (1.0%); and spray from other vehicles (0.1%). (Department for Transport, September 2023)
- Weather-related vehicle accidents kill more people annually than large-scale weather disasters. (The Weather Channel, 2018)
- It takes up to 10 times longer to stop on snow and ice than it does on dry pavement. (Geico Insurance, 2018)
Child Safety
- Extreme heat affects infants and small children more quickly and dramatically than adults because of their size. A study funded by General Motors of Canada found that within 20 minutes, the air temperature inside a previously air-conditioned small car exposed to the sun on a 35° C day (95° F) exceeded 50° C (122° F). Within 40 minutes, the temperature soared to 65.5° C (150° F). Leaving a window slightly open did little to prevent the inside of the vehicle from becoming dangerously hot.
- From 2001 to 2017, at least 35 children were killed in accidents on or near the driveways of their homes. 23 of those children were killed by a reversing vehicle. Three more children were killed when the vehicle’s handbrake was accidentally released (in one of those cases, by the child). (RoSPA, May 2017)
- Children under the age of 5 are at the highest risk for injury or death caused by a vehicle reversing over them. (KidsAndCars.org, 2018)
- A survey of parents conducted in 2010 found that 59% of the parents could recall a time when their child had followed them onto the driveway without their realising it. 22% had started to manoeuvre a vehicle on the driveway before realising their child was close to the vehicle. 42% recalled a time when their child had taken their car keys without their realising it. A remarkable 95% of parents had left their children alone in the vehicle temporarily while they went back into the house for some reason. Finally, 63% of parents admitted to sometimes leaving their children alone inside the car while they made a quick call to a shop or school. (RoSPA and Iain Goodwill Trust, 2010)
General Driving-Related Injuries and Fatalities
- Road traffic crashes are the eighth leading cause of death for people of all ages. (WHO, 2018)
- Every year, roughly 1.3 million people die in car accidents worldwide – an average of 3,287 deaths per day. (SaferAmerica, 2019)
- The World Health Organization (WHO) estimates that each year, road traffic crashes worldwide kill an average of about 1.19 million people (a decline of 5% since 2010) and injure 20–50 million more. This works out to over 3,200 traffic deaths per day worldwide. However, from 2010 to 2021, 10 countries reduced their annual traffic deaths by more than 50%: Belarus, Brunei Darussalam, Denmark, Japan, Lithuania, Norway, Russian Federation, Trinidad and Tobago, United Arab Emirates, and Venezuela. During that same period, 35 other countries reduced their annual traffic deaths by 30–50%. (WHO, 2023)
- Road traffic crashes cause 20–50 million injuries worldwide each year. (WHO, 2018)
- The number of annual road traffic deaths worldwide has reached 1.35 million. (WHO, 2018)
- In Great Britain in 2022, 1,711 people were killed in road collisions, and 29,741 people were killed or seriously injured (KSI) in road collisions. This means that in 2022, someone was killed or seriously injured about once every 17 minutes. (Department for Transport, September 2023; IAM RoadSmart, September 2023)
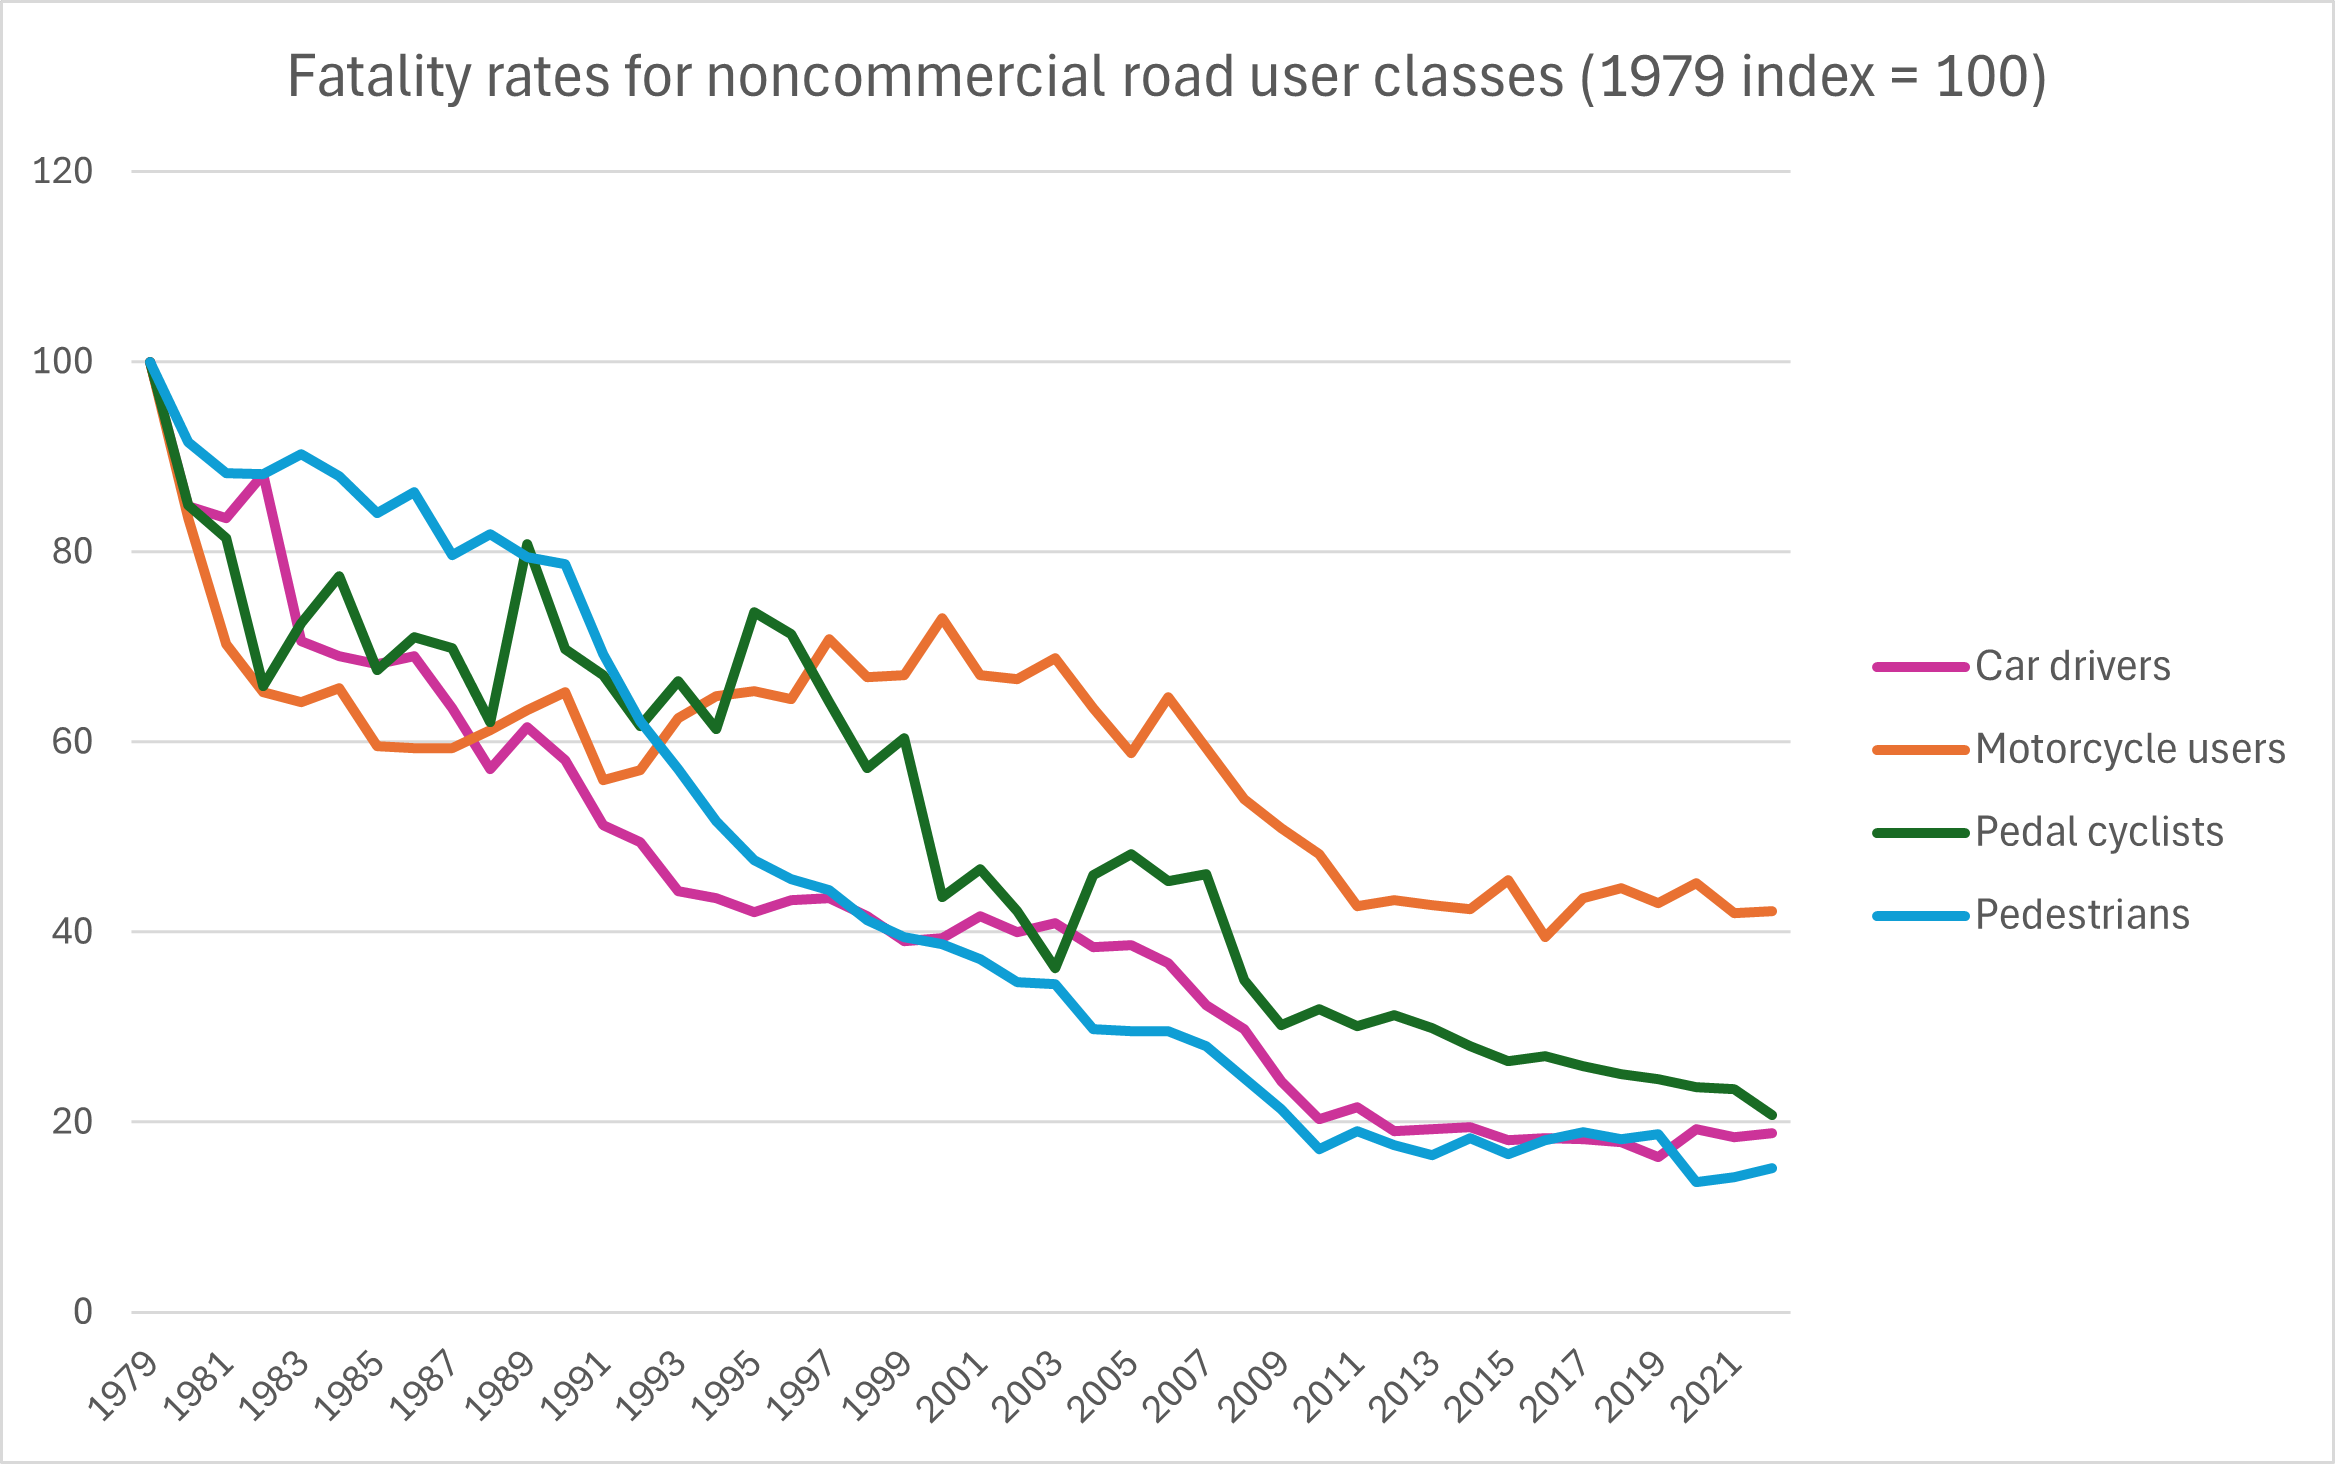
- The last four decades saw dramatic declines in fatality rates for non-commercial road users. From 1979 to 2022, the pedestrian fatality rate per million population declined by 84.9%, and the car driver fatality rate per billion miles declined by 81.2% (although these two rates have remained rather stable since 2012). The pedal cyclist fatality rate declined by 79.2%. However, the motorcyclist fatality rate per billion miles declined less: by 57.8%, and this rate has remained rather stable since 2012. See the following chart. (Department for Transport, 2023)
- In Great Britain from 2009 to 2019, road traffic (in vehicle miles) increased by 7%, but traffic deaths decreased by 24% and total casualties (killed, seriously injured, and slightly injured) decreased by 29%. (Department for Transport, 2019)
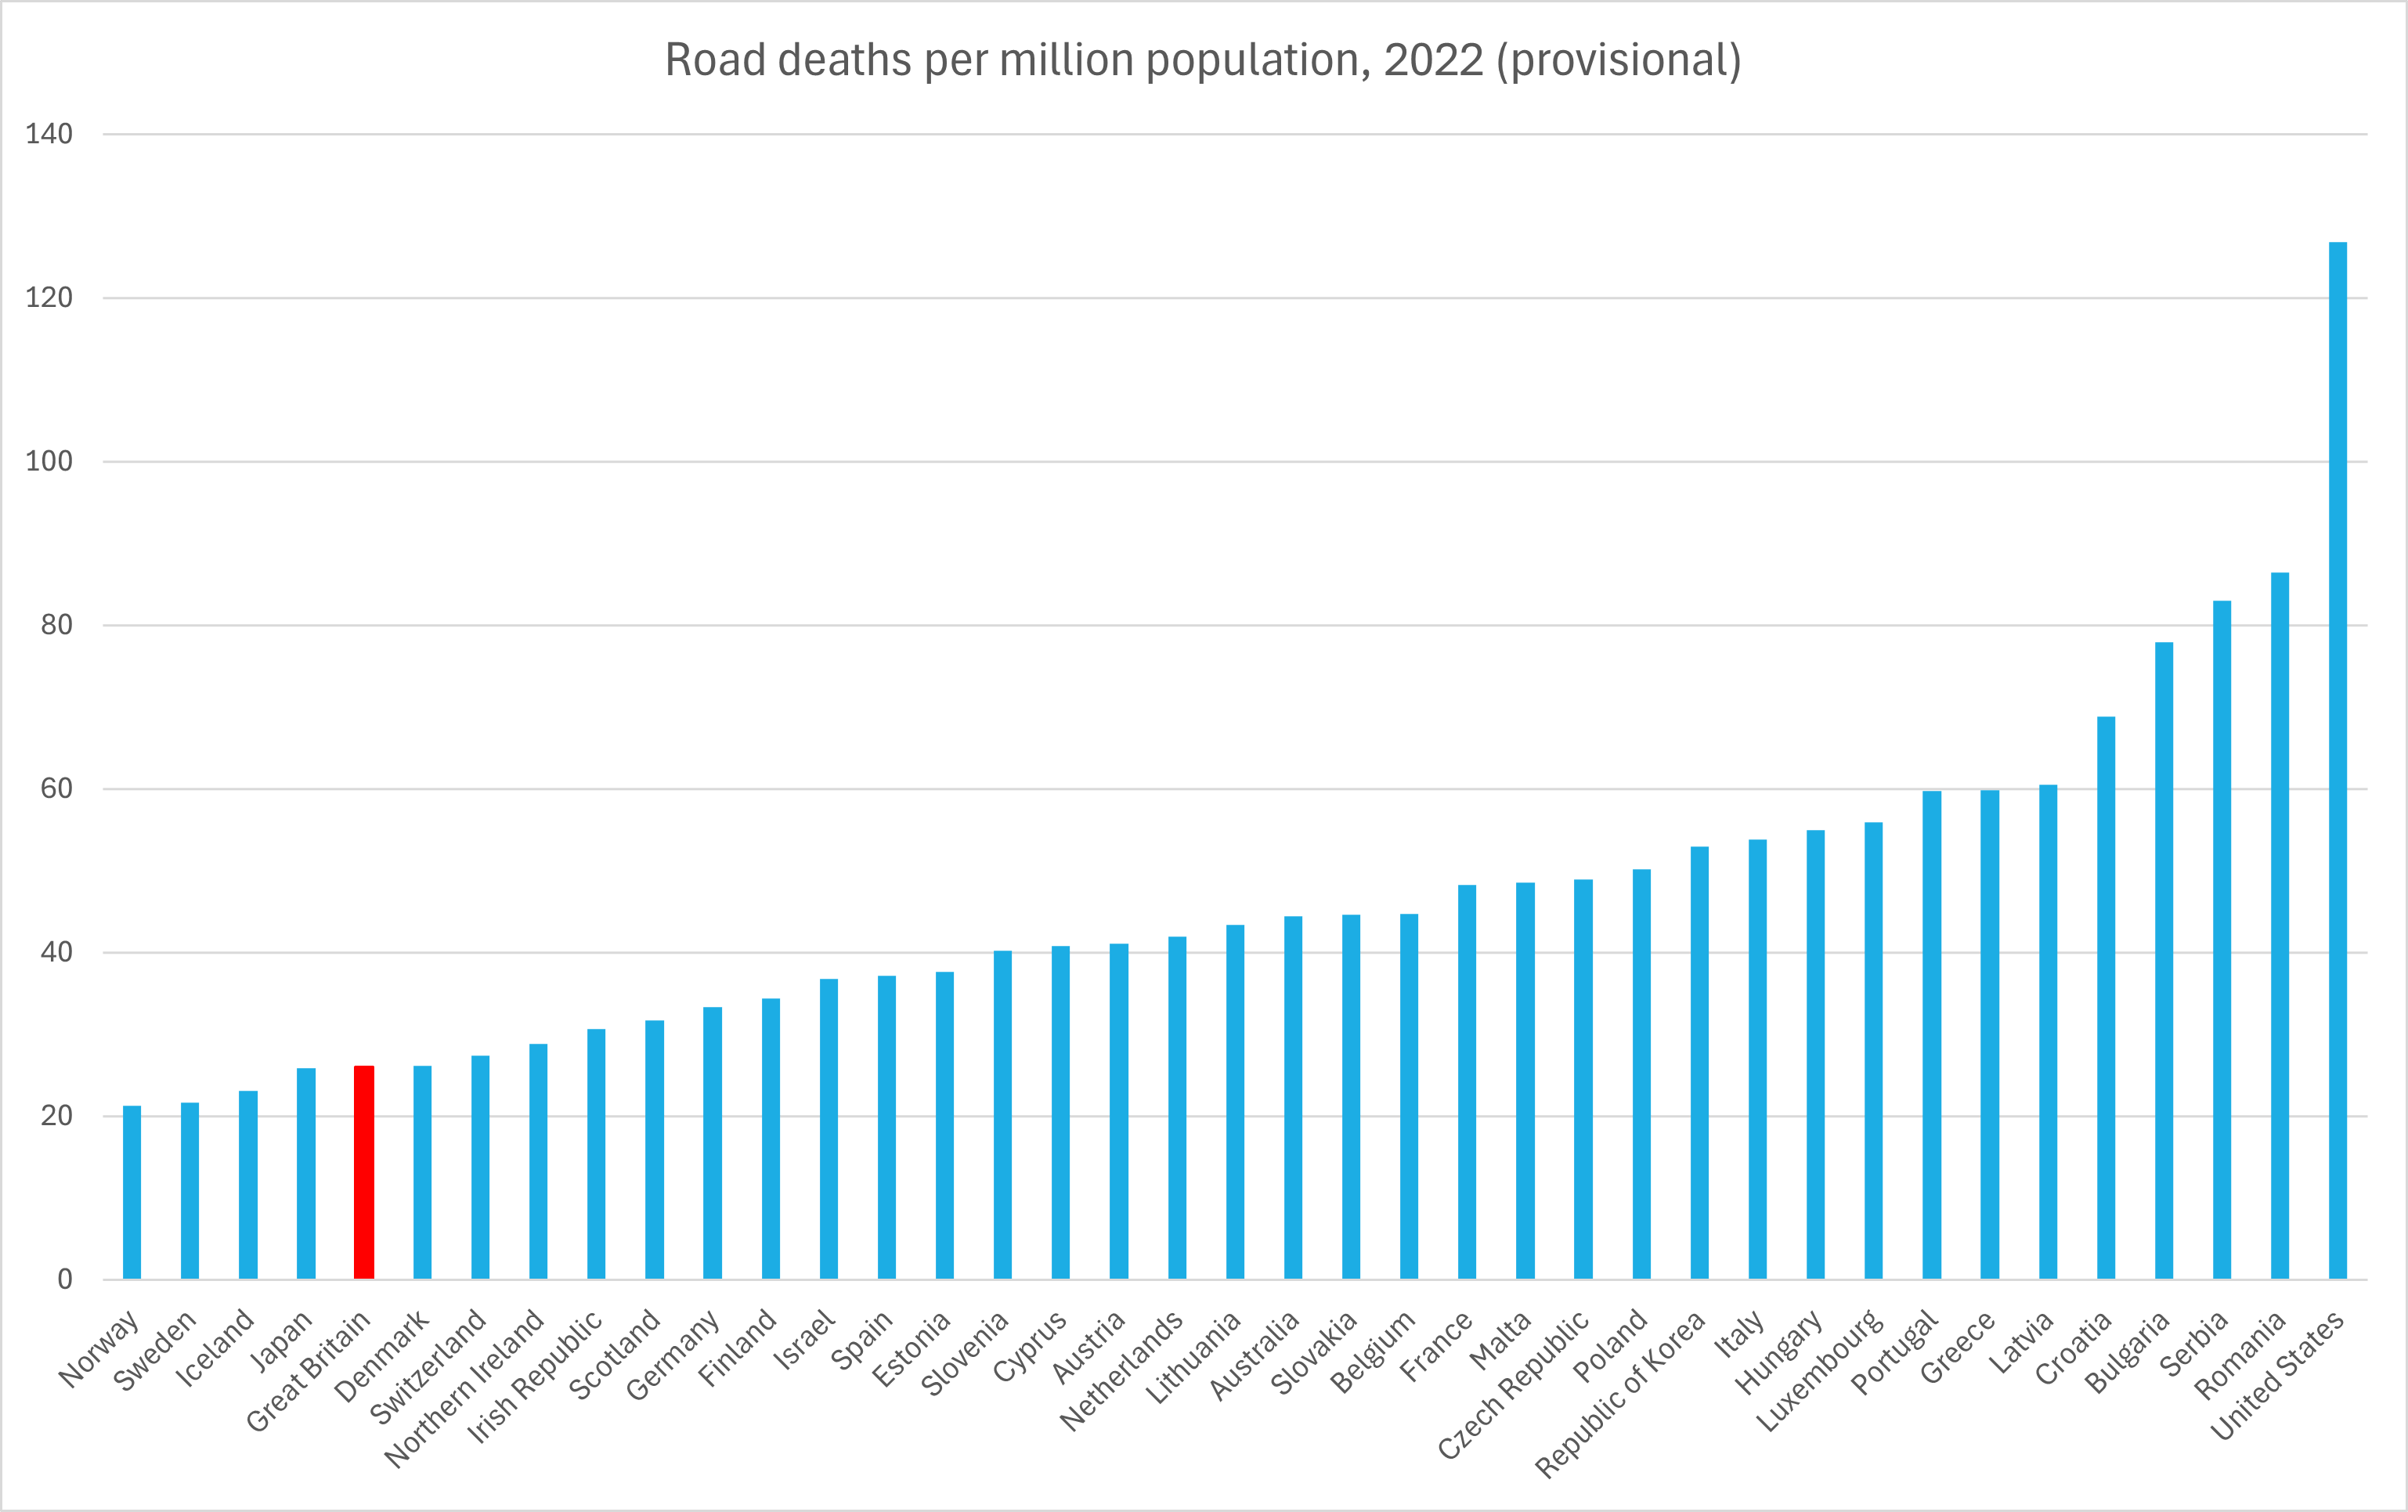
- For many years, Great Britain has had one of the lowest rates of road fatalities per million population in the world. In 2022, Britain ranked fifth out of the 38 countries shown in the following chart. (Department for Transport, September 2023)
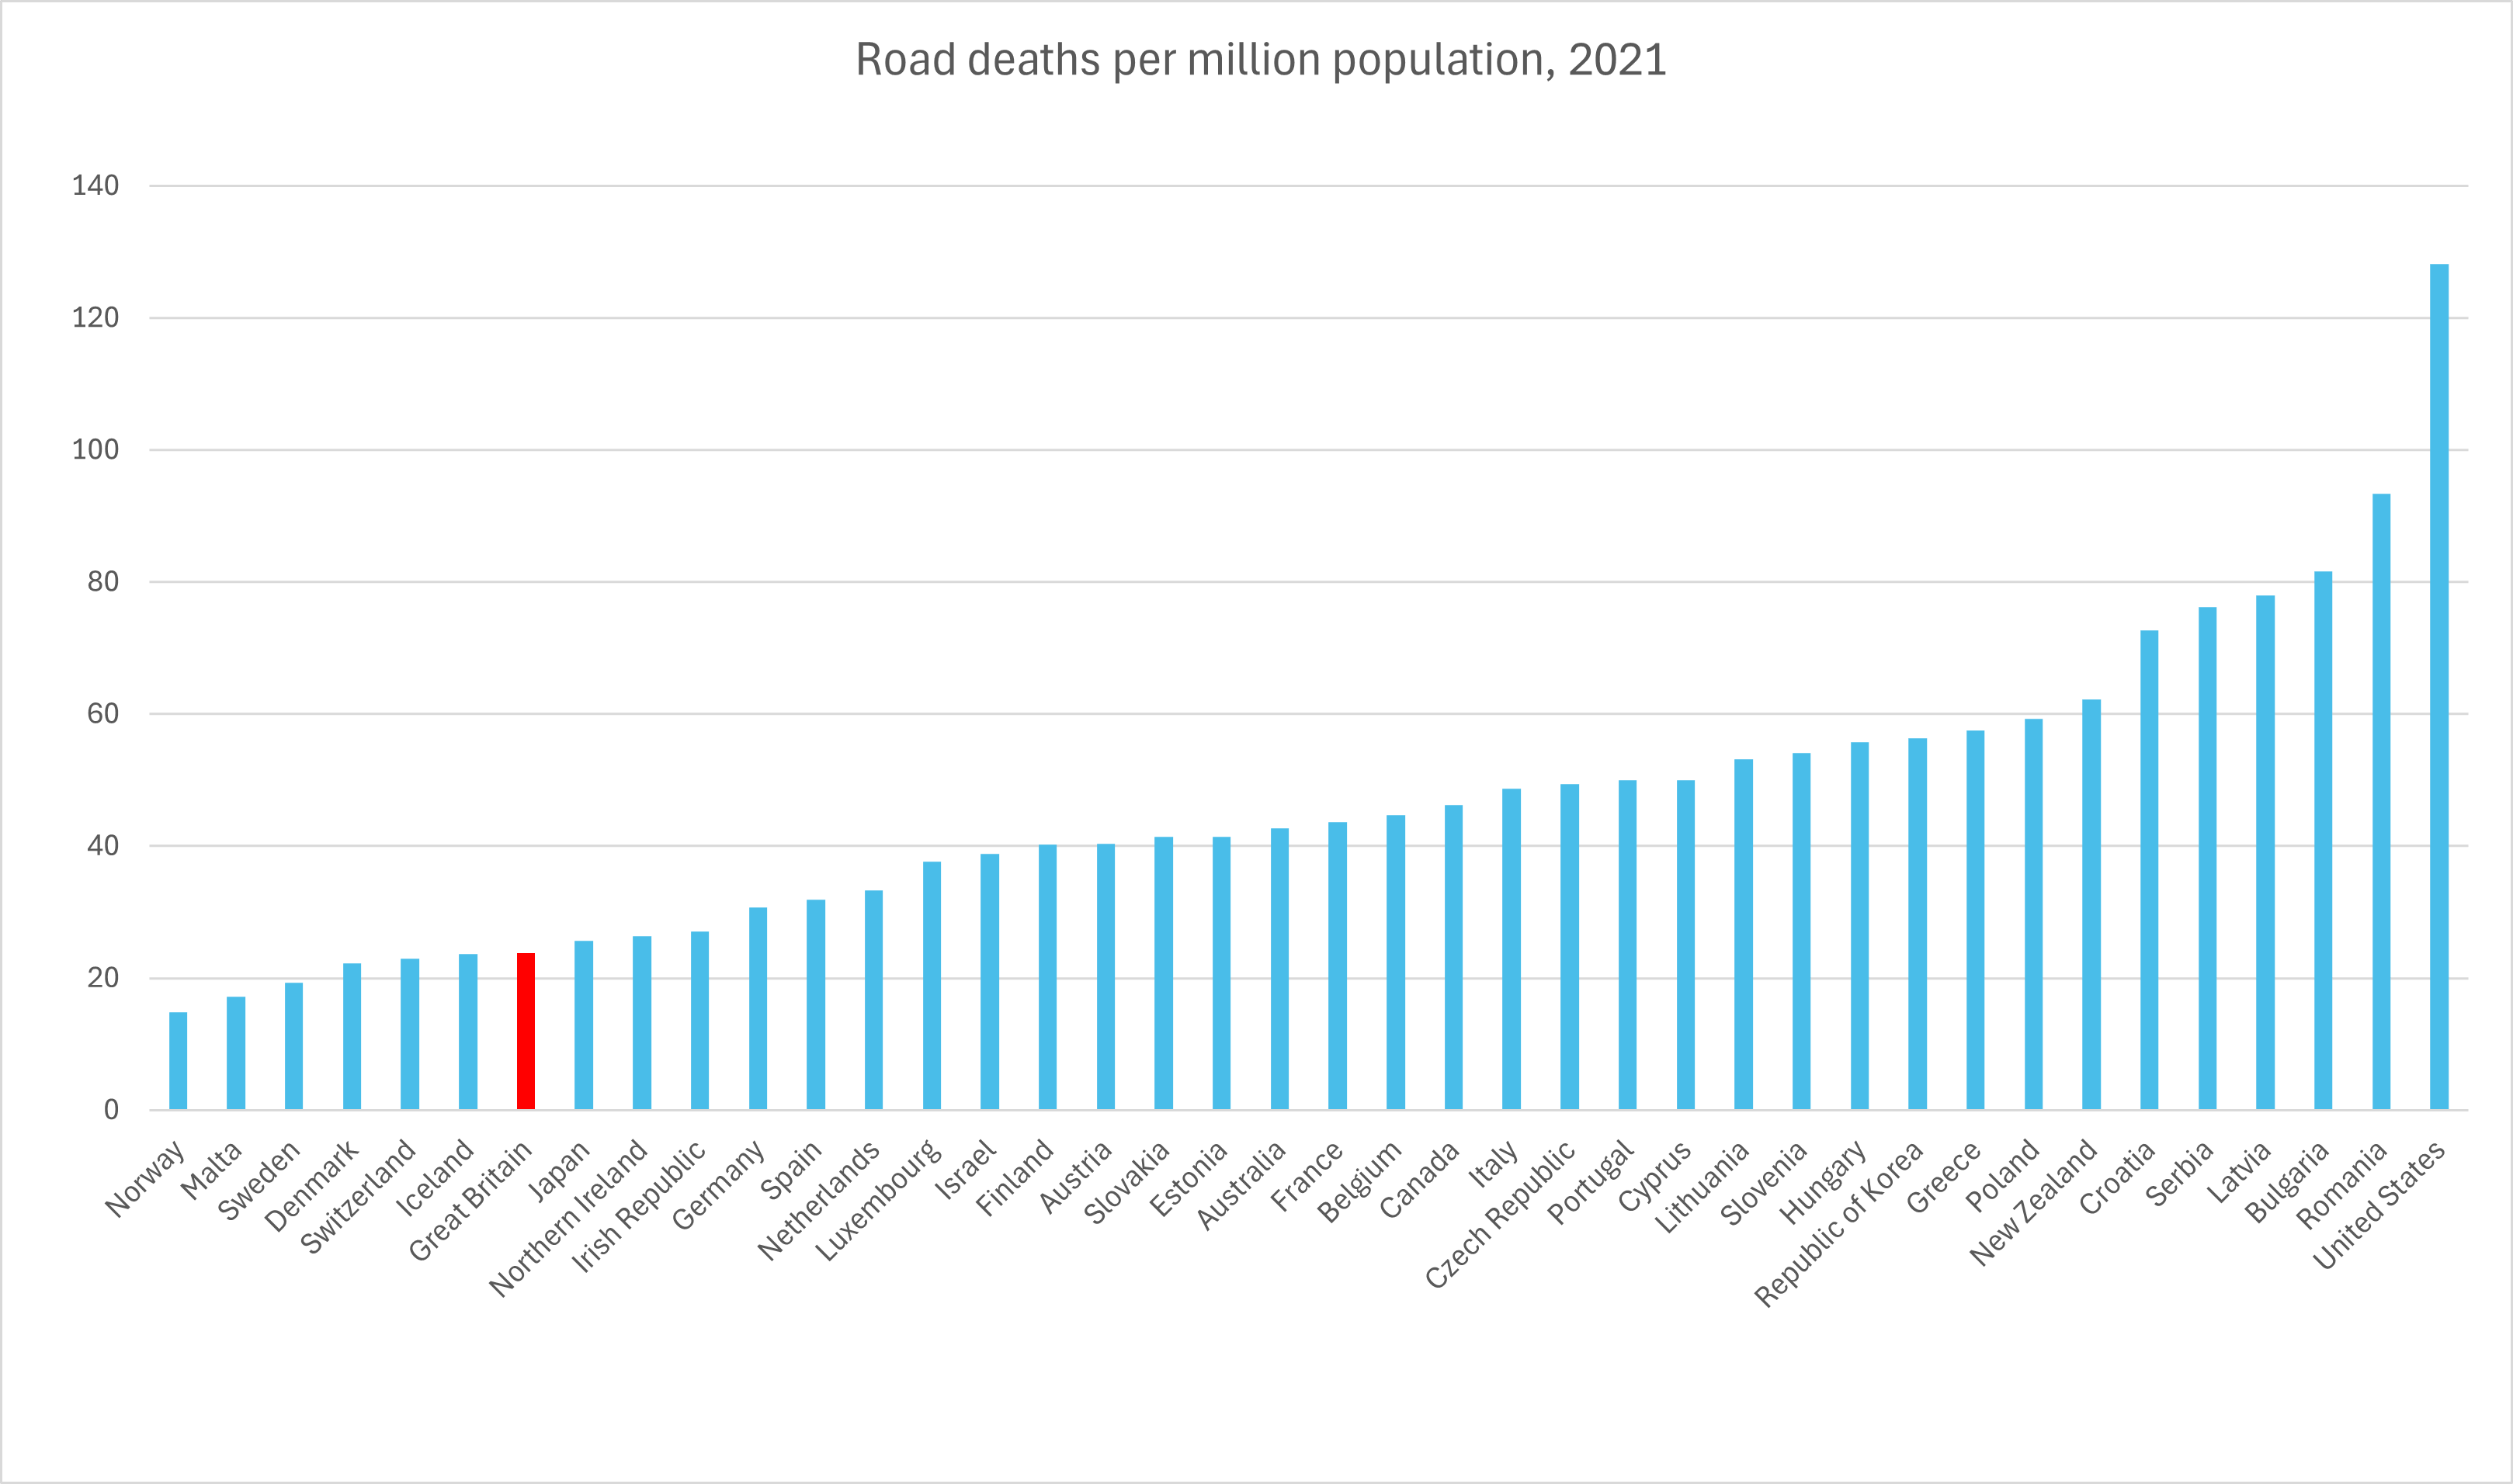
- Unfortunately, this 2022 dataset still uses provisional data and still lacks data for Canada and New Zealand. Here is a similar chart for 2021, but with more complete data. In 2021, Britain ranked seventh:
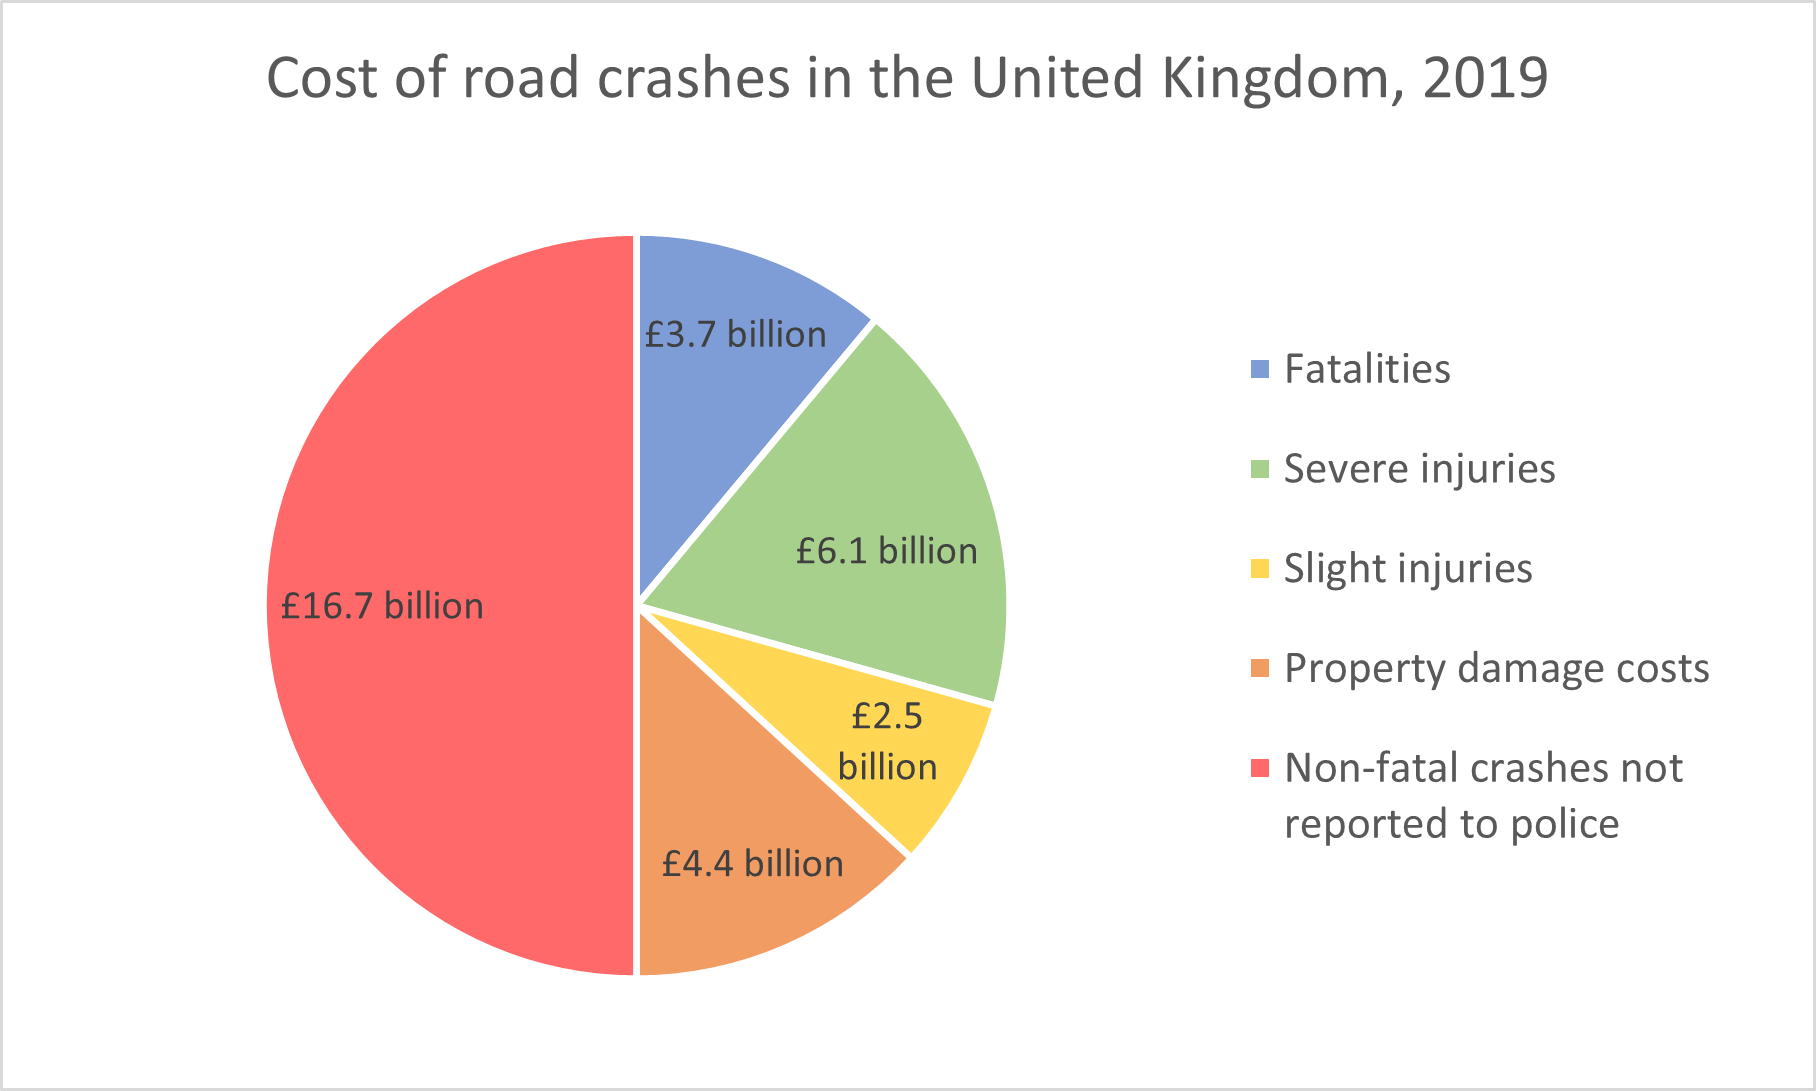
- The Organisation for Economic Cooperation and Development (OECD) estimated that the total social cost of road crashes in the United Kingdom was about £33.4 billion in 2019, or 1.5% of UK GDP that year. This estimate considered that many non-fatal road crashes are not reported to the police, yet they still carry a high cost. See the following chart. (International Transport Forum, 2021)
Injuries and Fatalities by Location
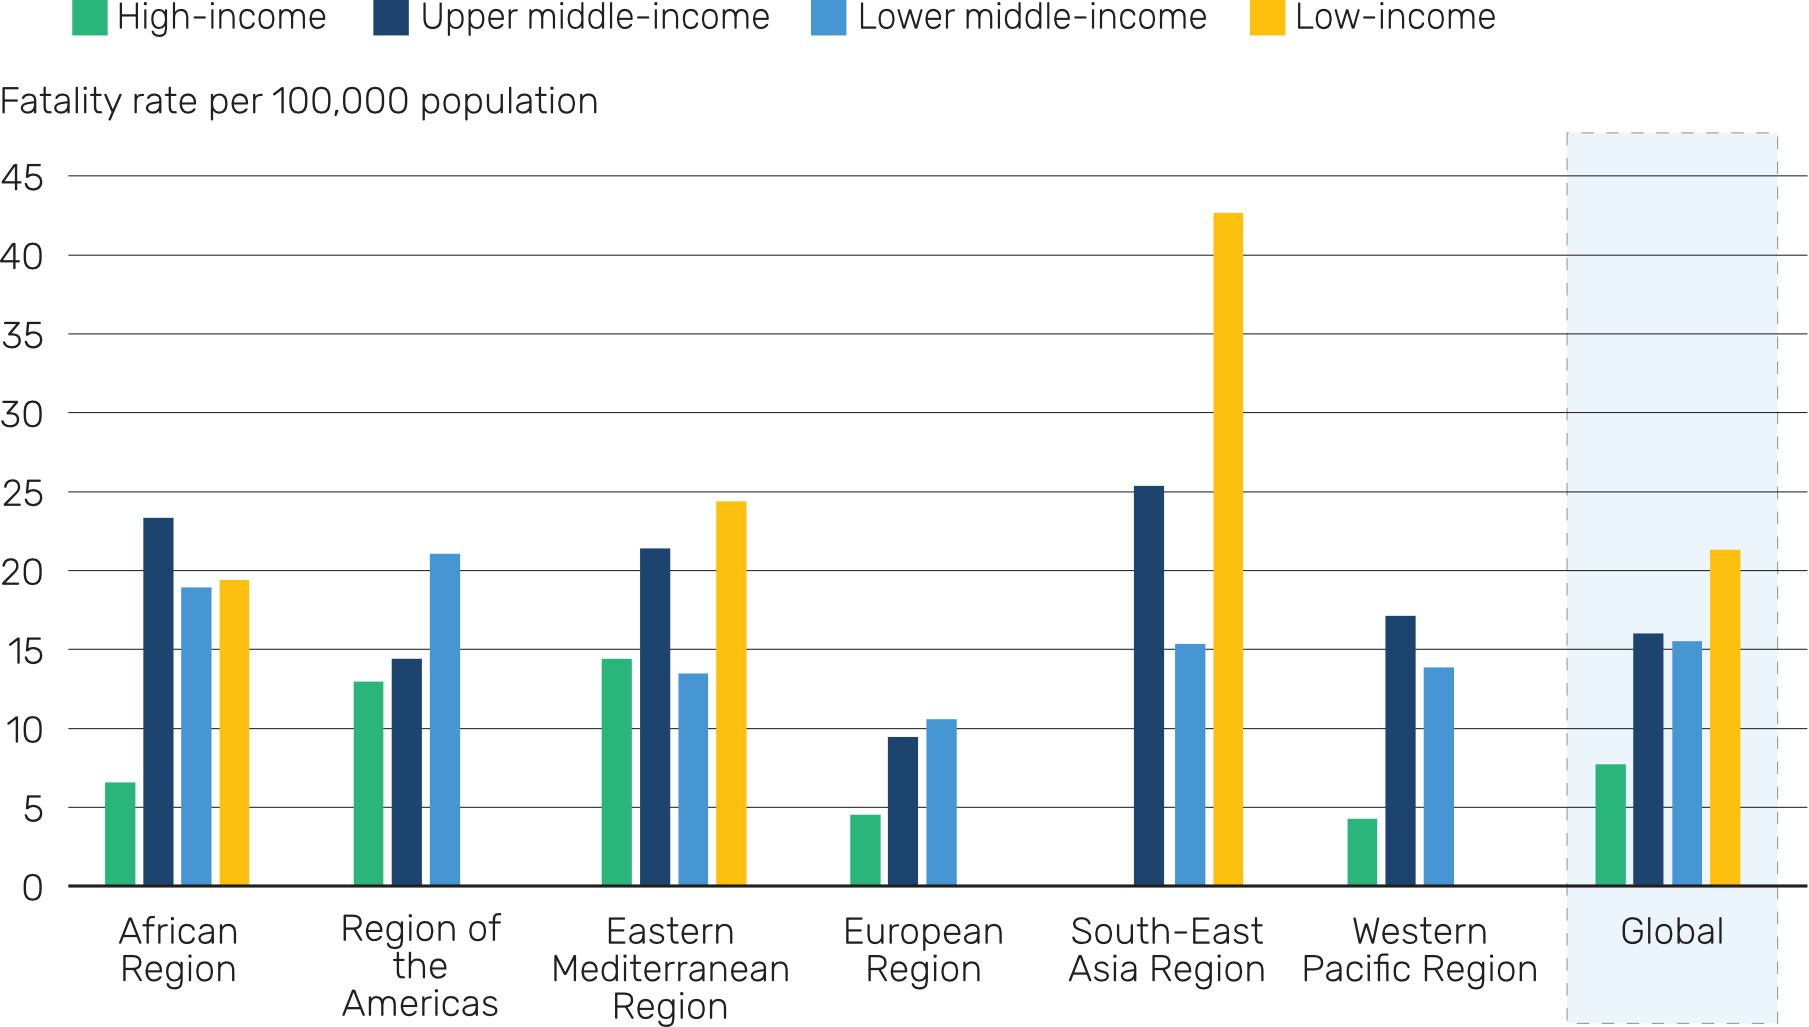
- Low-income countries have 9% of the world’s population and fewer than 1% of the world’s powered vehicles, yet they account for 13% of the world’s road fatalities. In contrast, high-income countries have 16% of the world’s population and 28% of the world’s powered vehicles, yet they account for just 8% of the world’s road fatalities. Low-income countries also have the highest road fatality rates per 100,000 population. See the following chart, which breaks down road fatality rates by world regions. (WHO, 2023)
- In the European Union, there were 23,328 road fatalities in 2018, a decline of 56% compared with road fatalities in the year 2000. Road fatalities decreased every year except 2015 (when they increased by 1.0% compared with 2014) and 2021 (when they increased by 5.7% compared with 2020). In 2021, 44.6% of road fatalities were drivers or passengers in passenger cars. Another 18.1% of fatalities were pedestrians, and 16.6% were motorcyclists. (However, in the period 2011 to 2021, more than 60% of the fatalities were drivers.) Of all EU member countries, Romania had the highest fatality rate in 2021: 93 persons per million inhabitants. This represents an average of 49 road deaths per one million inhabitants. (Eurostat, June 2023)
- In the European Union, there were about 20,600 road fatalities in 2022, which was 3% higher than in 2021 but 10% lower than in 2019. (European Commission, February 2023)
- In the European Union in 2022, Sweden had the lowest road fatality rate (22 road deaths per million inhabitants), and Romania had the highest fatality rate (86 road deaths per million inhabitants). The EU average was 46 road deaths per million inhabitants. (European Commission, February 2023)
- Death rates from road traffic accidents are three times higher in low-income countries than in high-income countries. (World Health Organization, 2018)
- In 2018, there were 28,080 persons killed or severely injured in road accidents: 24,424 in England, 1,131 in Wales, 1,740 in Scotland, and 785 in Northern Ireland. (Department for Transport, 2019)
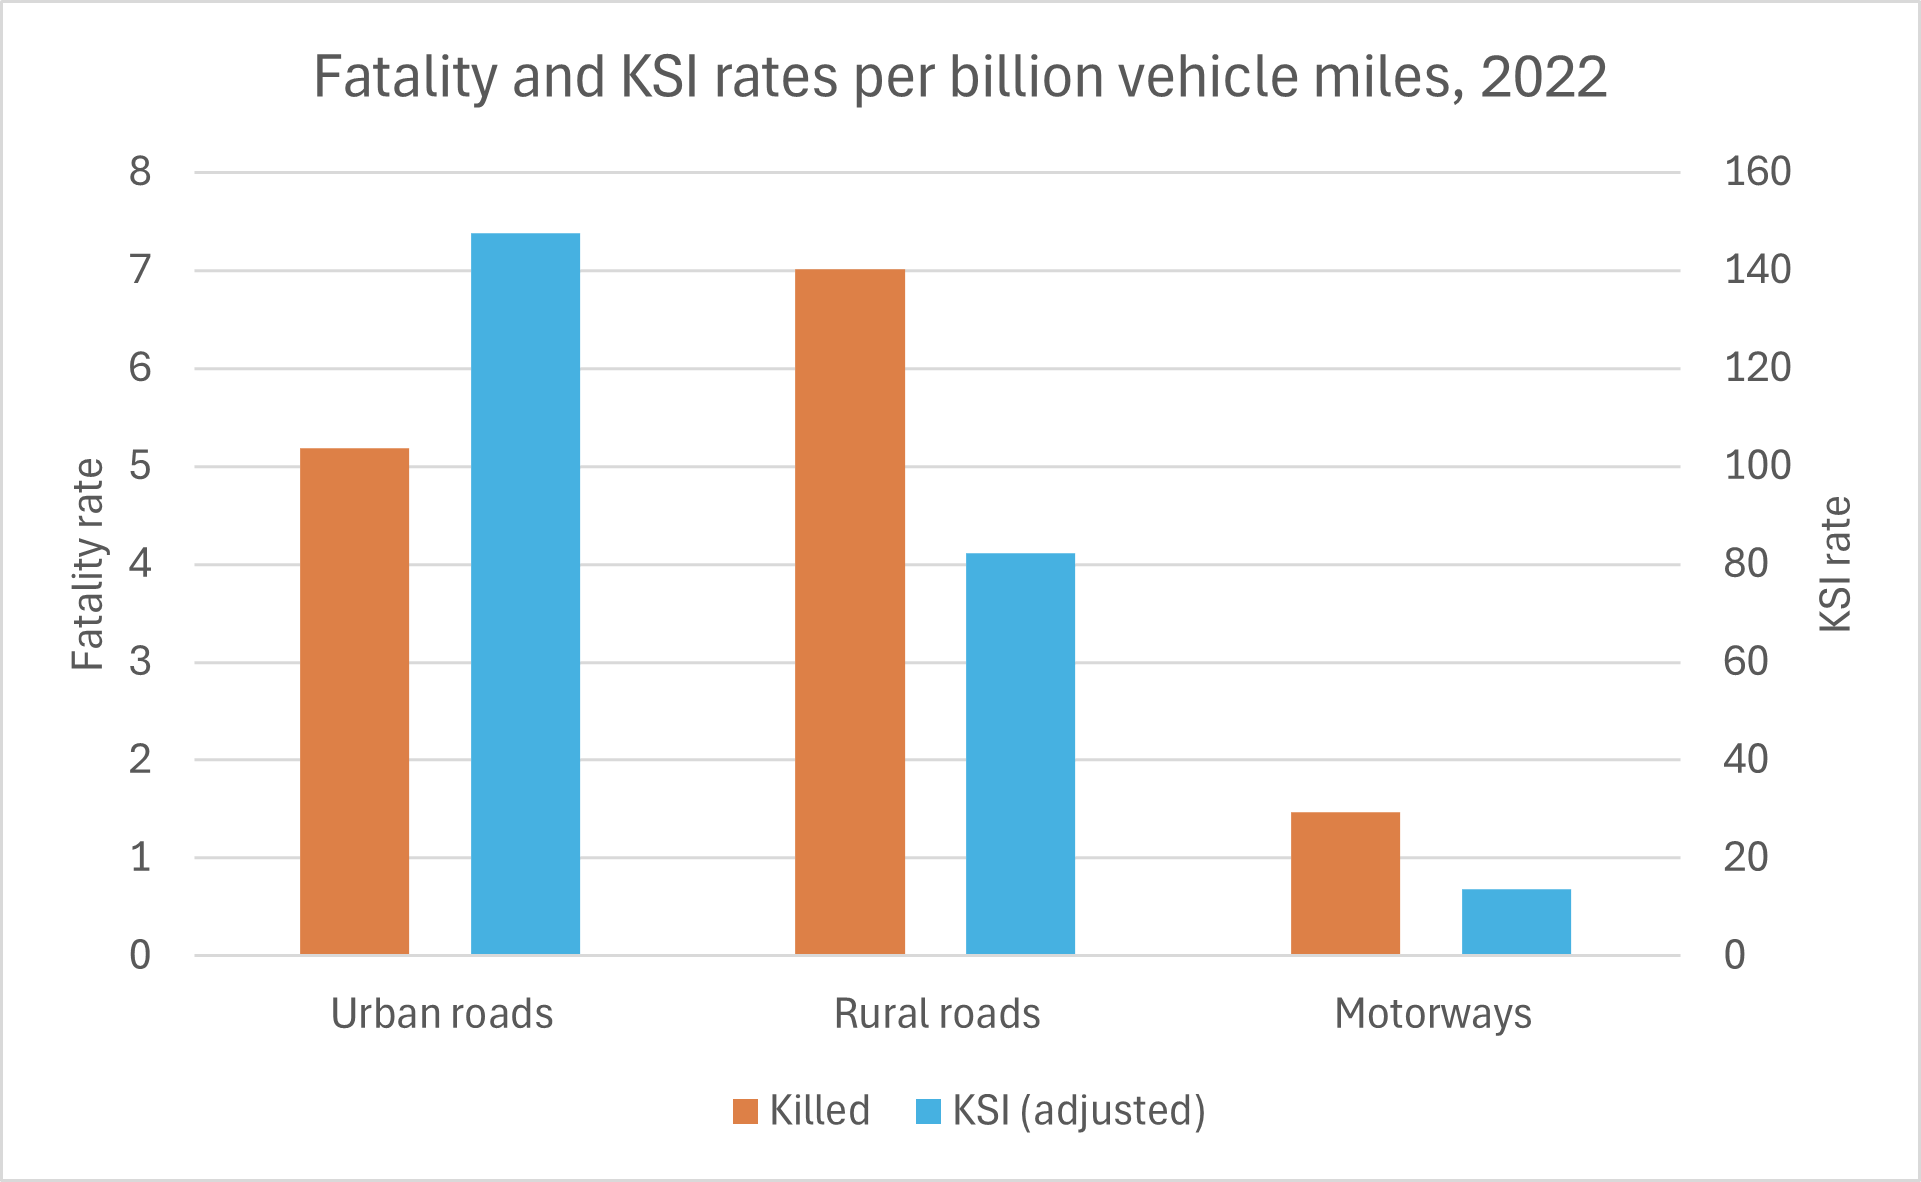
- In the UK, rural roads are generally more lethal than urban roads, both in terms of numbers of road fatalities per year and in the rates of fatalities per billion vehicle miles. On the other hand, the rate of serious injuries per billion vehicle miles is higher for urban roads than for rural roads. Motorways are the safest roads. Only 10.7% of fatalities per billion vehicle miles and 5.6% of killed or seriously injured (KSI) casualties per billion vehicle miles occurred on motorways. See the following chart. (Department for Transport, September 2023)
- In 2015–2016, 1,784 road workers were killed or seriously injured on England’s strategic road network, with an accident frequency rate of 0.77 accidents per 100,000 hours worked. (Highways England, 2017)
- In the period October 2017 to October 2020, road workers reported nearly 6,500 roadwork incursions, in which motorists drove through cones and into roadworks sites. This was an average of 175 such incidents per month. (Highways England, November 2020)
- In just the first five months of 2023, 123 road incursions occurred. A road incursion is when a vehicle drives through a closed-off section of road. (Highways England, July 2023)
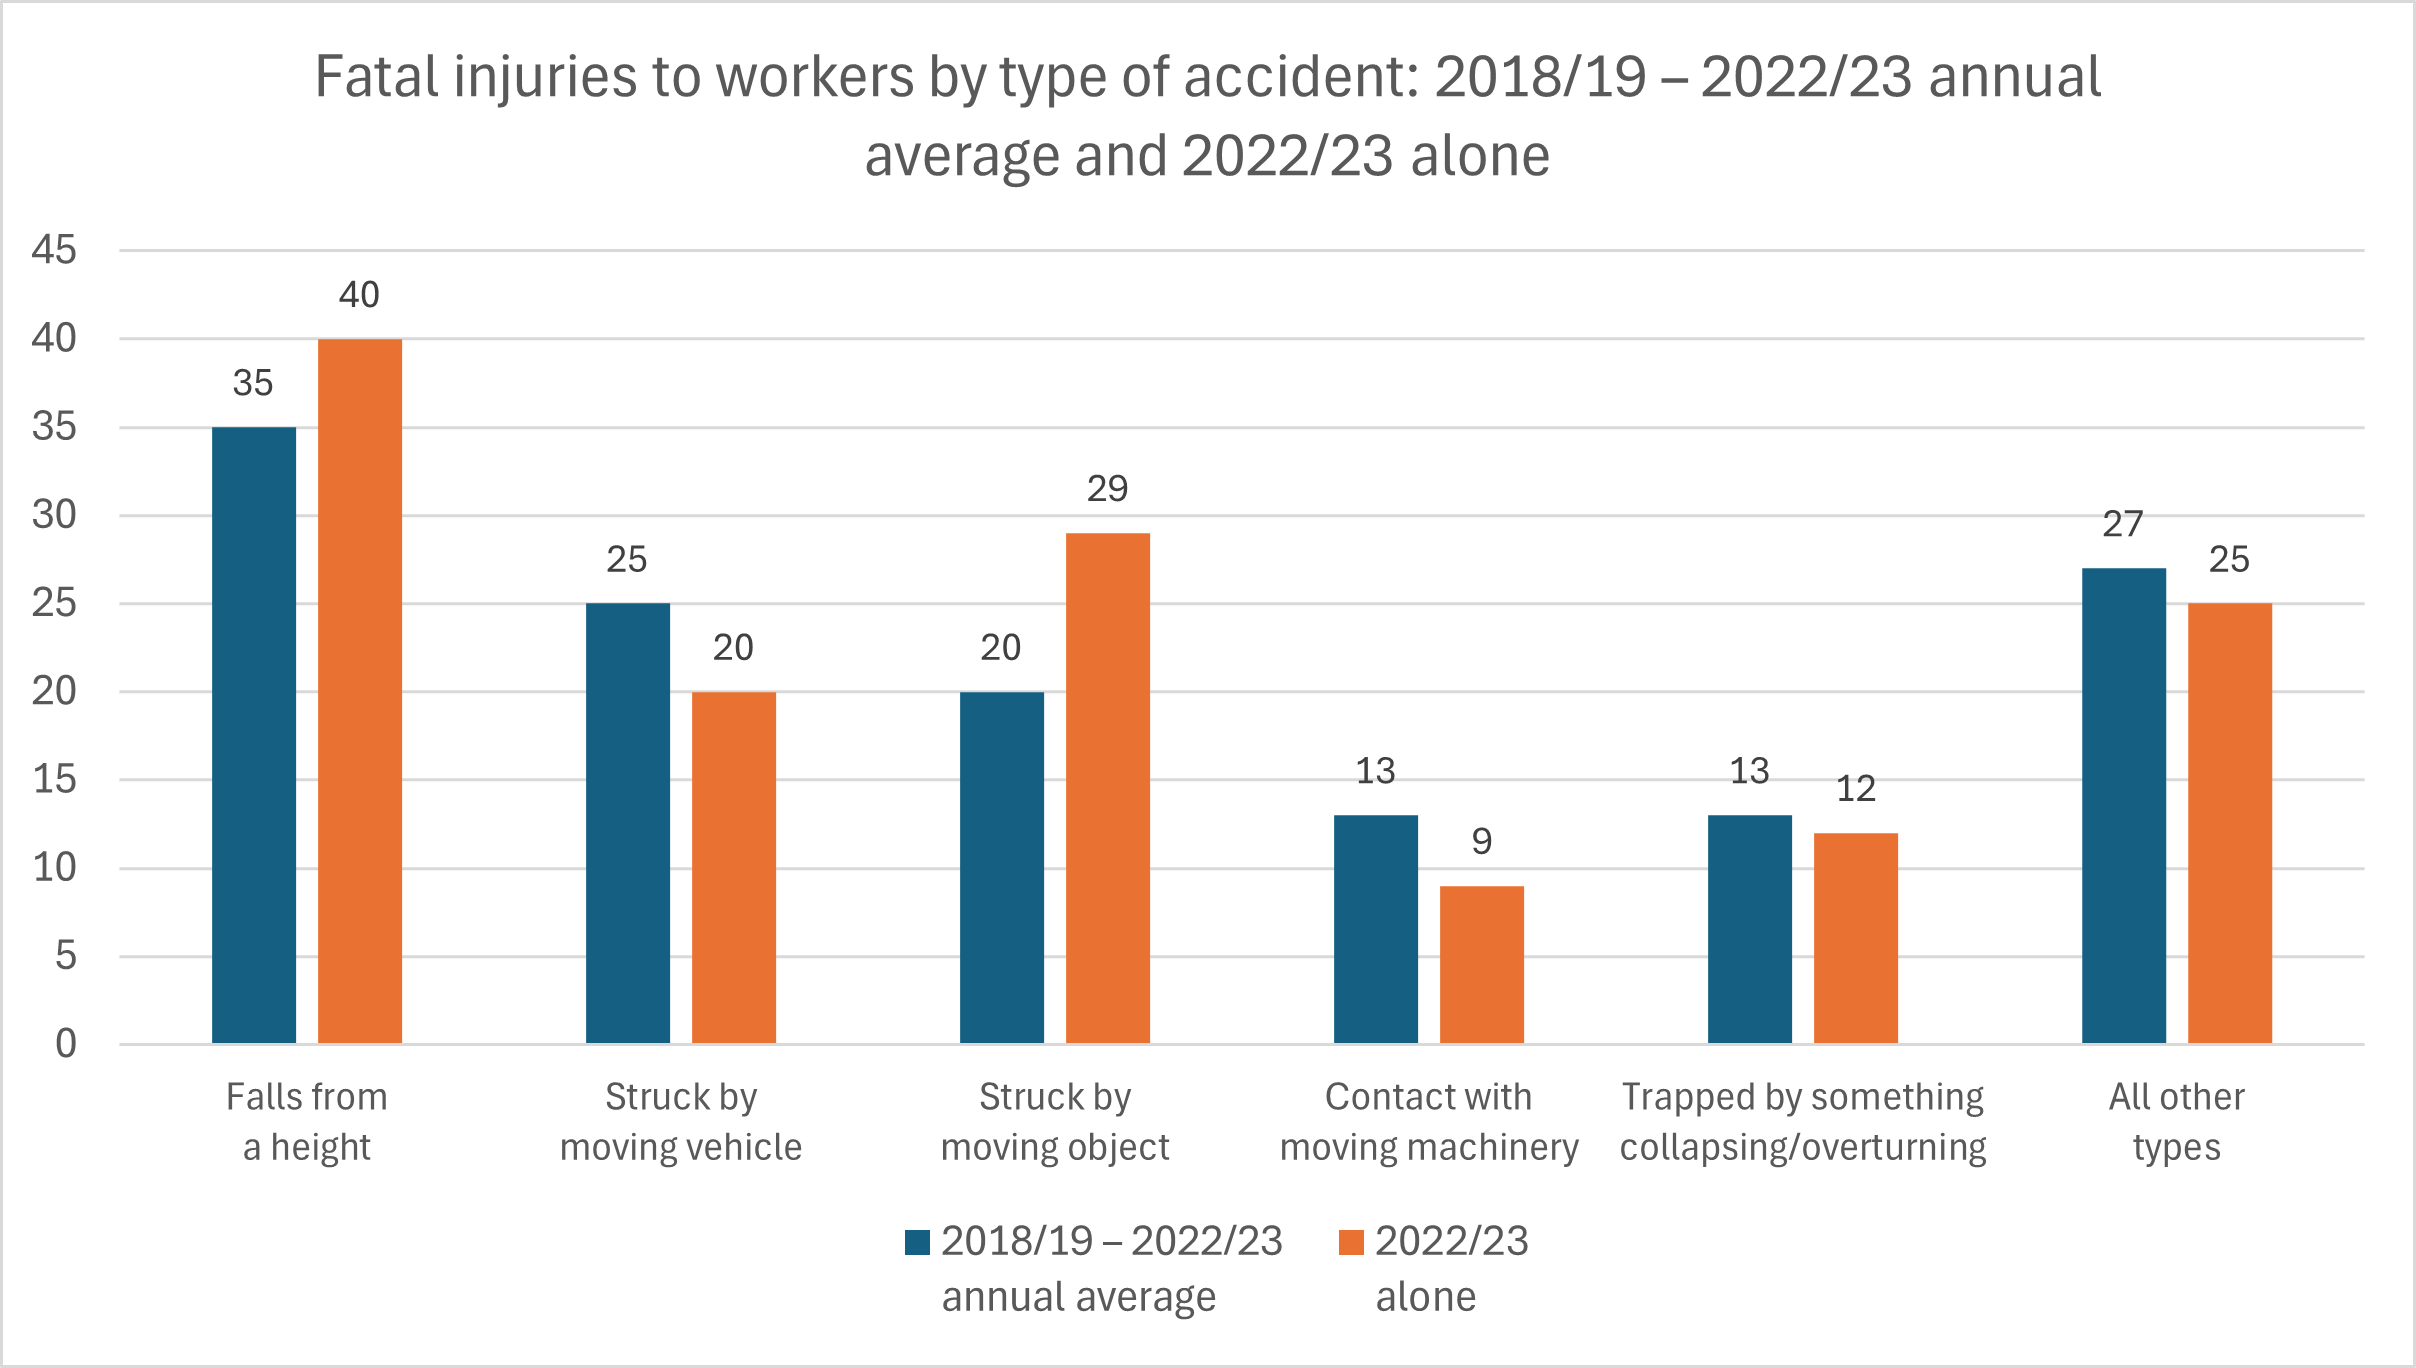
- The following chart depicts the numbers of fatal injuries to workers as an annual average of the years 2018/19 – 2022/23 and for 2022/23 alone by the type of accident. Falls from a height, being struck by a moving vehicle, and being struck by a moving object are the three most common types of accidents resulting in worker deaths. Combined, these three types of accidents have accounted for over half of all fatal injuries to workers since 2001/02. (HSE, July 2023)
- A YouGov poll of over 2,000 British adults in 2021 found that only 42% of respondents believed that enough was being done to protect road workers. This ranged from 38% in Wales to 45% in the South of England. 31% of respondents said that they had witnessed motorists driving carelessly or even dangerously past roadworks in the previous 12 months. (Highways, July 2021)
Injuries and Fatalities by Type of Road User
- More than half of all road traffic deaths worldwide are among pedestrians, cyclists, and motorcyclists. Worldwide, road traffic injuries are the leading cause of death for children and young adults aged 5–29, yet two-thirds of road traffic fatalities occur among people aged 18–59. Males are three times as likely to be killed as females. (WHO, 2023)
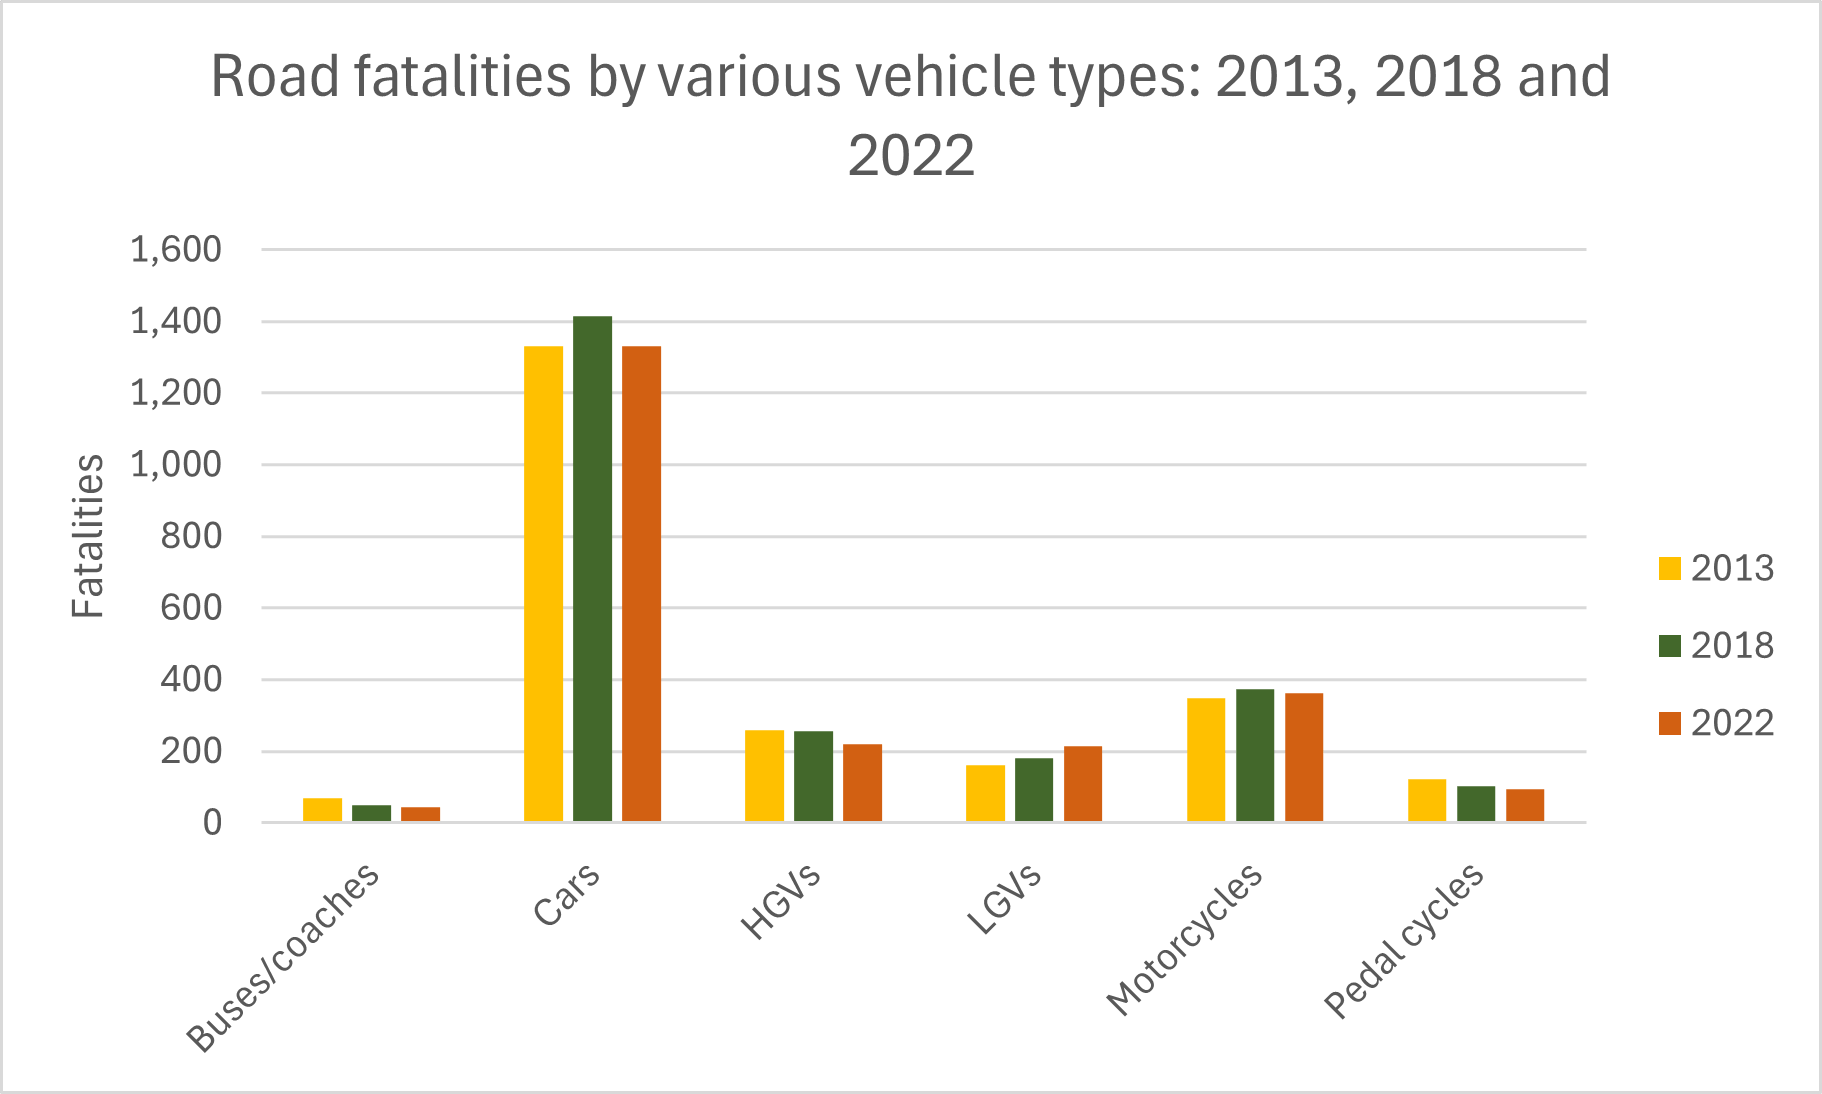
- In Great Britain in 2022, most road fatalities involved at least one car. There were fewer fatalities involving buses or coaches than those involving any other type of vehicle. This has been the pattern for some time. See the following chart. (Department for Transport, September 2023)
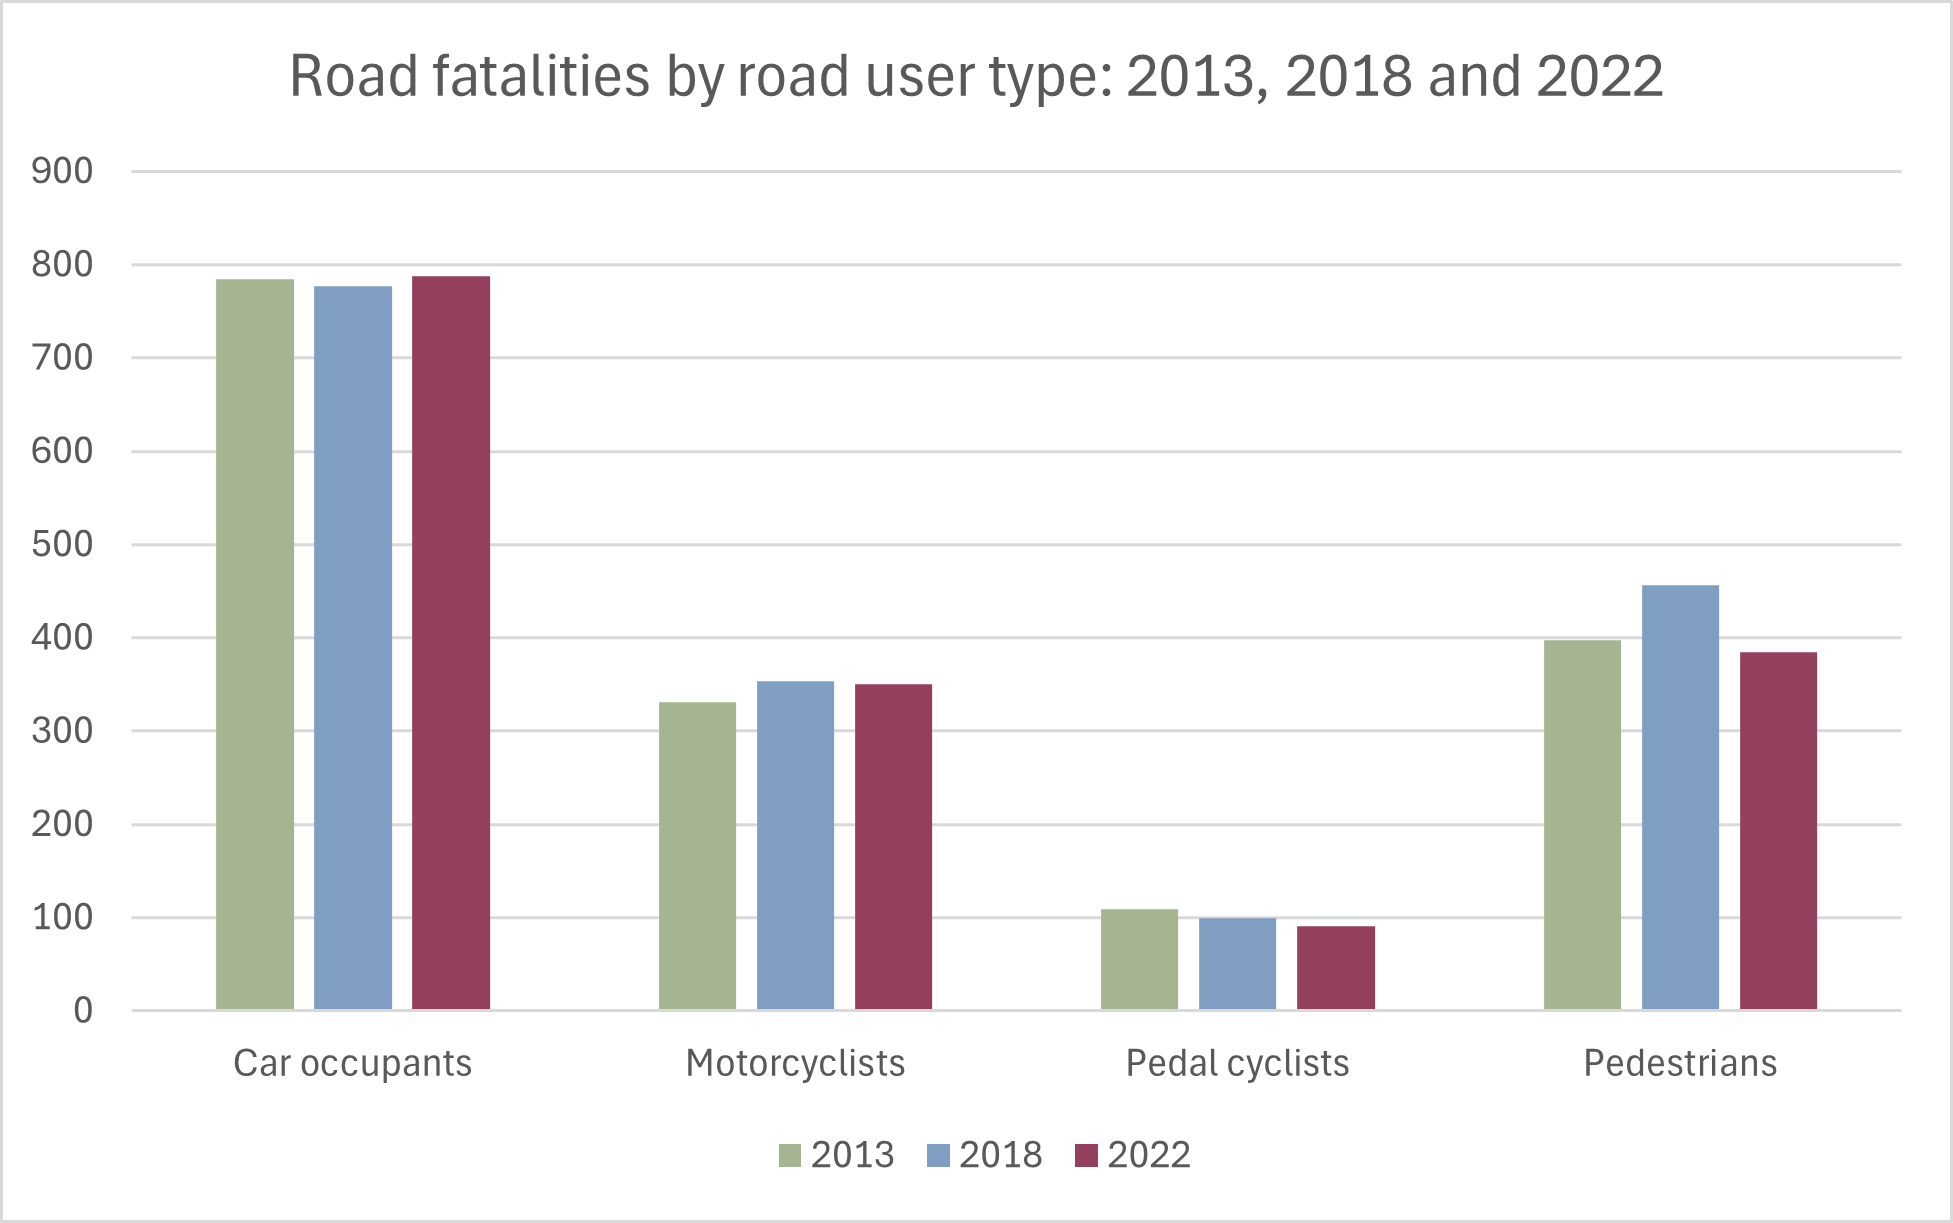
- When road fatalities are broken down by road user type, most fatalities were car occupants, and relatively few were occupants of buses or coaches. This general pattern has held for a decade, although the number of cyclist fatalities decreased by 16.5% and the number of motorcyclist fatalities increased by 5.7%. See the following chart. (Department for Transport, September 2023)
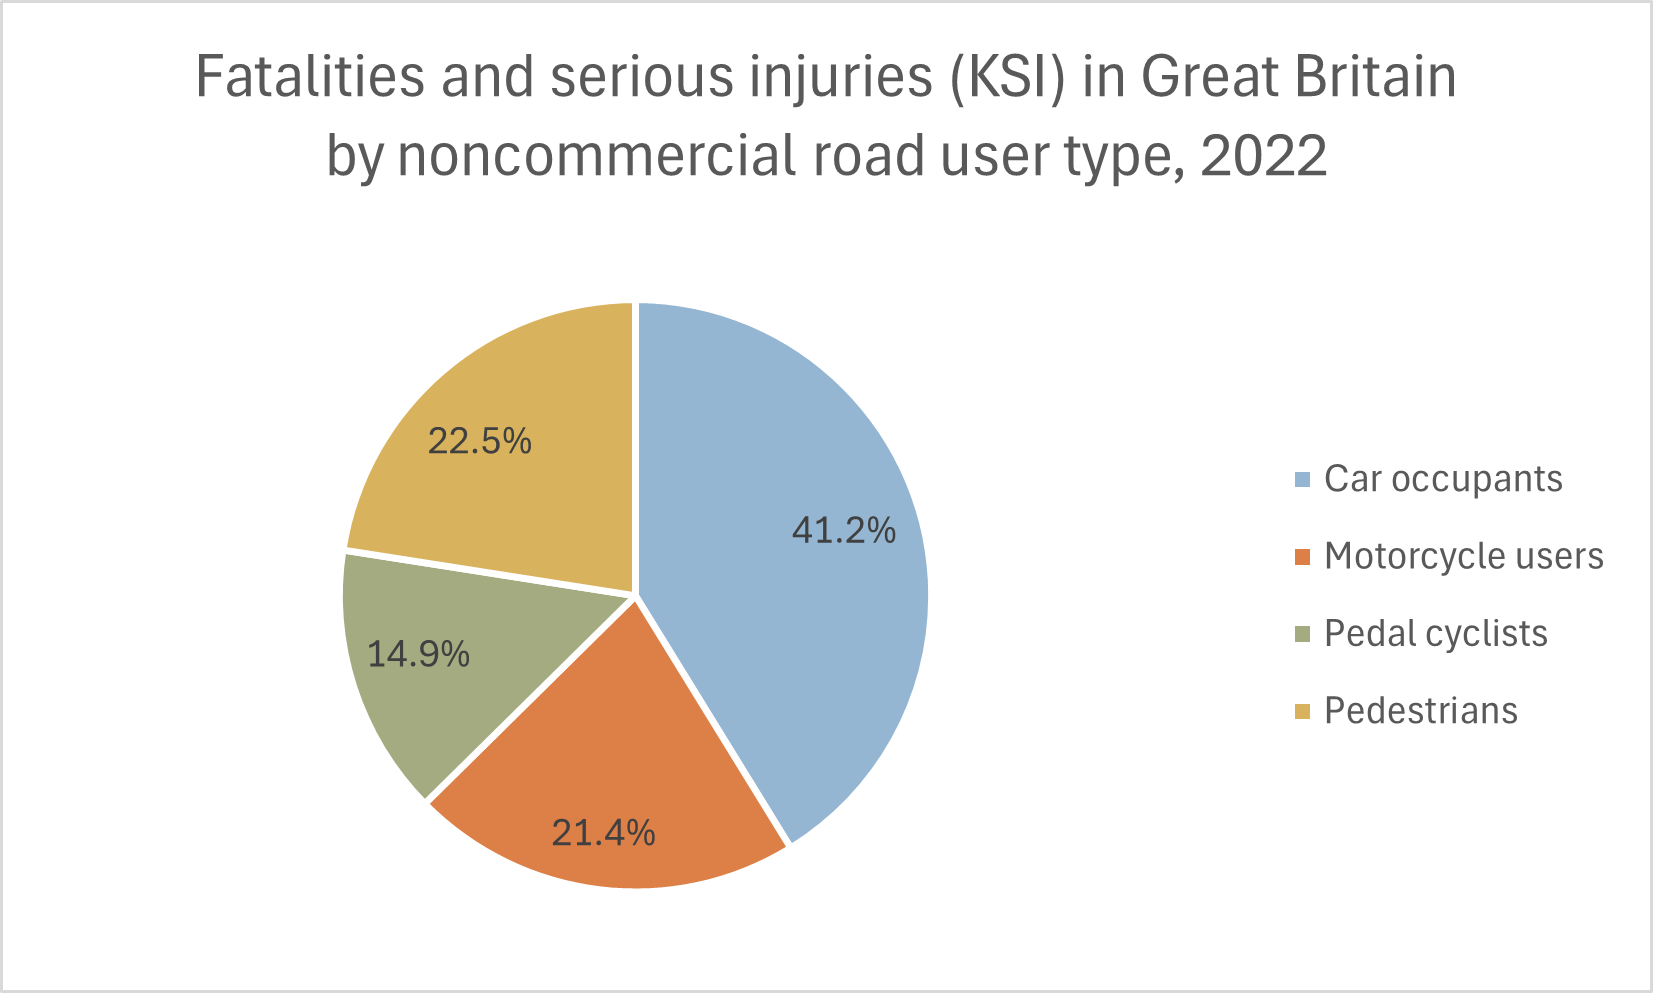
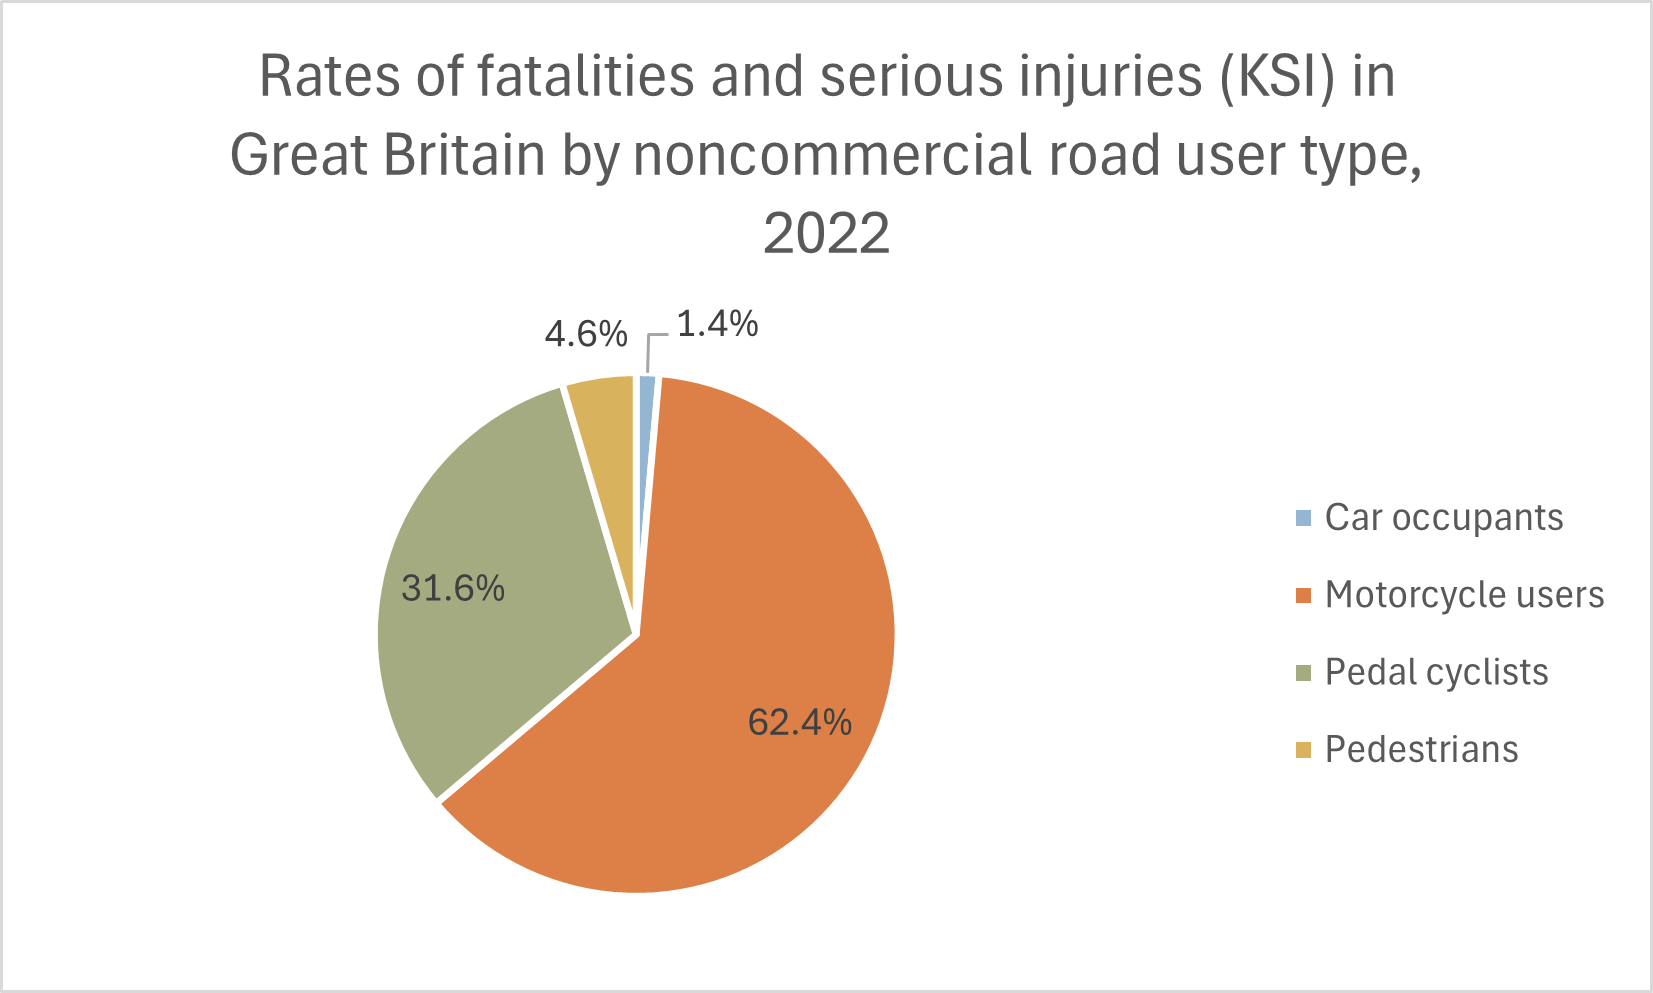
- In Great Britain in 2022, among non-commercial road users, 41.2% of the persons killed or seriously injured (KSI) were in cars (as either drivers or passengers), 22.5% were pedestrians, 21.4% were riding motorcycles, and 14.9% were riding bicycles. That is no surprise, given that cars account for most vehicle traffic. But for KSI casualty rates (per billion vehicle kilometres or per million population for pedestrians), the statistics look quite different: Motorcycle users accounted for 62.4% of non-commercial KSI casualties per billion vehicle kilometres, pedal cyclists accounted for 31.6%, and car occupants accounted for just 1.4%. (The remaining 4.6% were pedestrians per million population.) Motorcyclists, pedal cyclists and pedestrians are considered ‘vulnerable road users’. See the following two charts. (Department for Transport, September 2023)
- Another way to look at the persons killed or seriously injured is by the types of vehicles involved in the casualties. See the following chart for 2018. (Department for Transport, 2019)
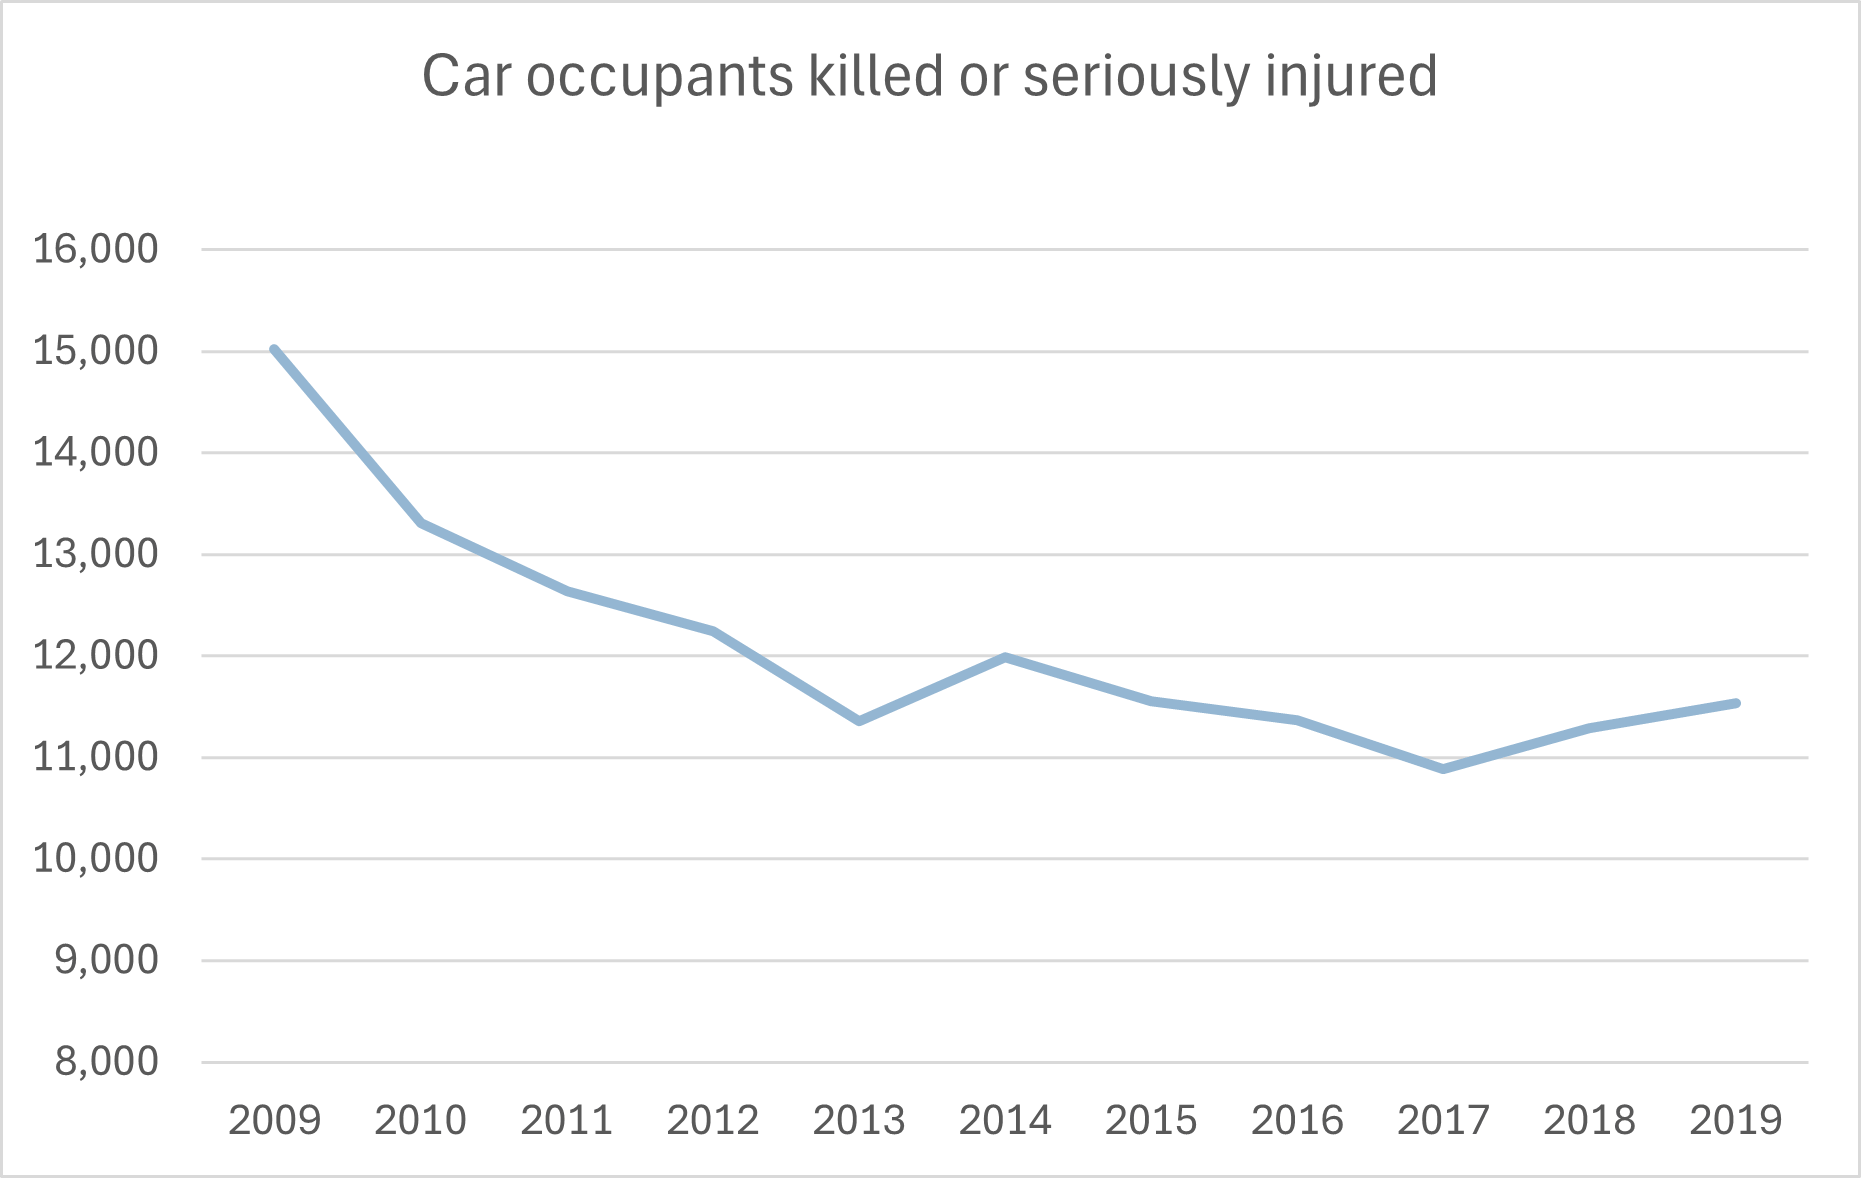
- The number of car occupants who were killed or seriously injured decreased from 15,027 in 2009 to 11,539 in 2019, a decline of 23.2%. See the following chart. (Ministry for Transport, 2019)
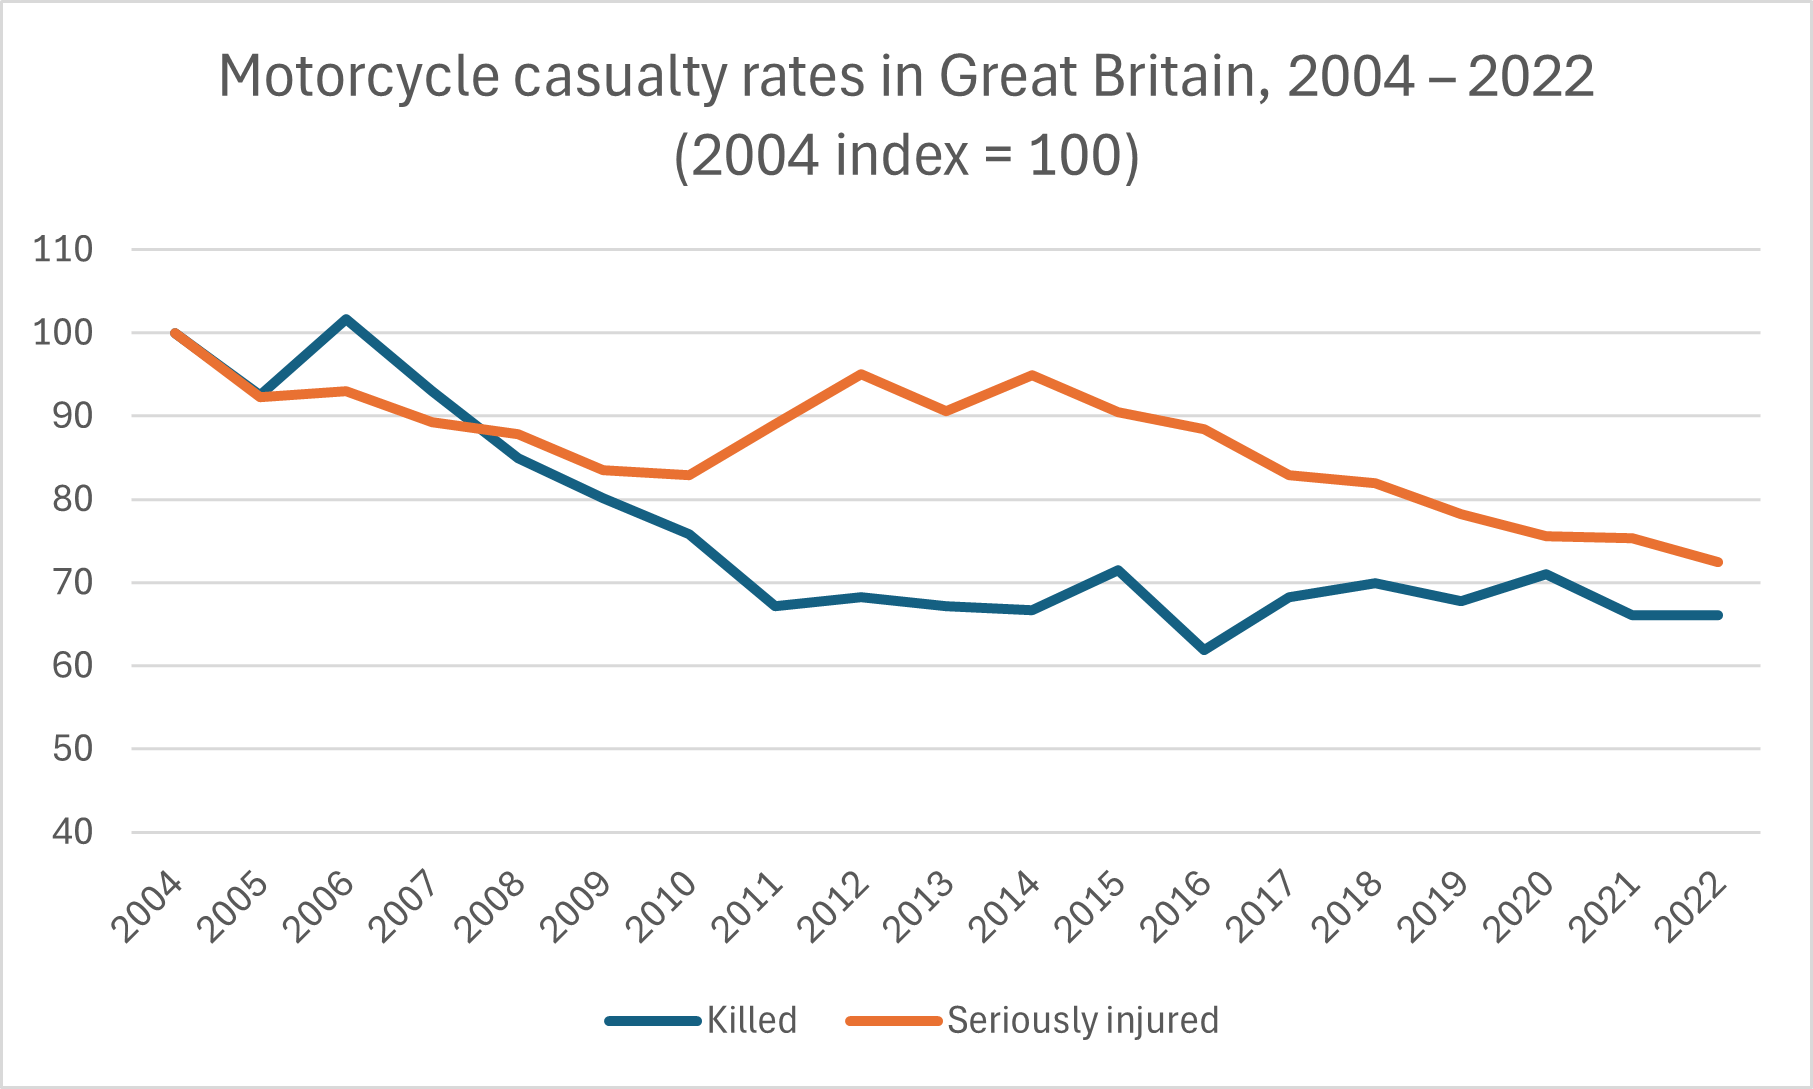
- The number of motorcycle fatalities in Great Britain decreased from 585 in 2004 to 350 in 2022, a drop of 40%. In that period, the number of seriously injured motorcyclists also decreased, by 35%. However, at least part of this decline in casualties reflects the decline in motorcycle traffic that took place in that period, from 3.15 billion vehicle miles in 2004 to 2.84 billion vehicle miles in 2022. In that period, the rate of motorcycle fatalities per billion vehicle miles travelled (VMT) declined by 33.9% and the rate of serious injuries per billion VMT declined by 27.5%. See the following chart. (Department for Transport, September 2023)
- The number of motorcycle users (operators and passengers) who were killed or seriously injured decreased from 7,438 in 2009 to 5,892 in 2019, a decline of 20.8%. (However, at least part of this decline in casualties may reflect the decline in motorcycle traffic that took place in that period. See the Index of Vehicle Miles chart in the Driver Demographics section.) See the following chart. (Ministry for Transport, 2019)
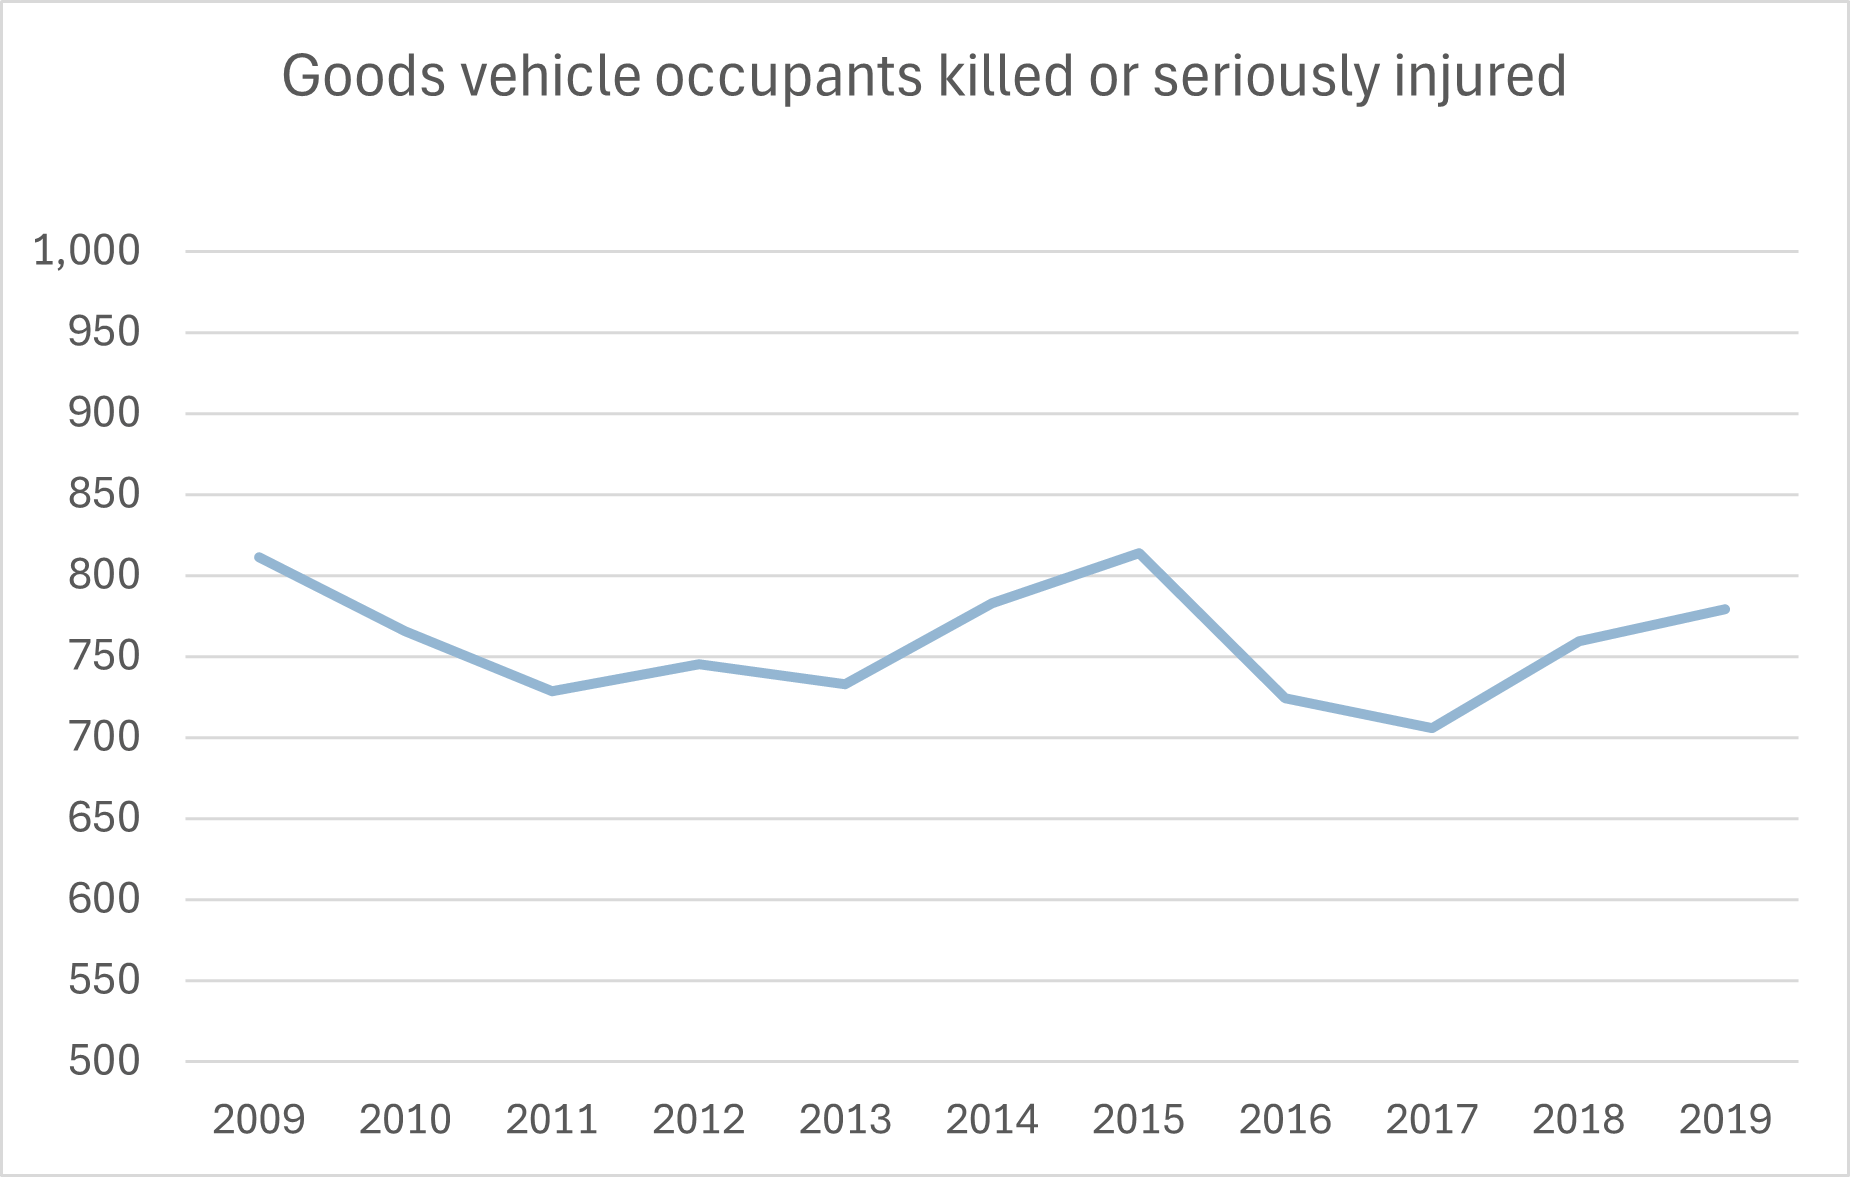
- The number of occupants of goods vehicles (both heavy- and light-goods vehicles) who were killed or seriously injured decreased from 811 in 2009 to 779 in 2019, a decline of 3.9%. This decline occurred despite the sharp increase in commercial van traffic during that period. (See the Index of Vehicle Miles chart in the Driver Demographics section.) See the following chart. (Ministry for Transport, 2019)
- In Great Britain in 2022, 91 pedal cyclists were killed and 4,056 were seriously injured in road collisions. Compared with 2004, this represents a drop of 32% in fatalities and an increase of 21% in serious injuries. (Department for Transport, September 2023)
- In Great Britain in 2022, 82% of the pedal cyclists killed or seriously injured were male. (Department for Transport, September 2023)
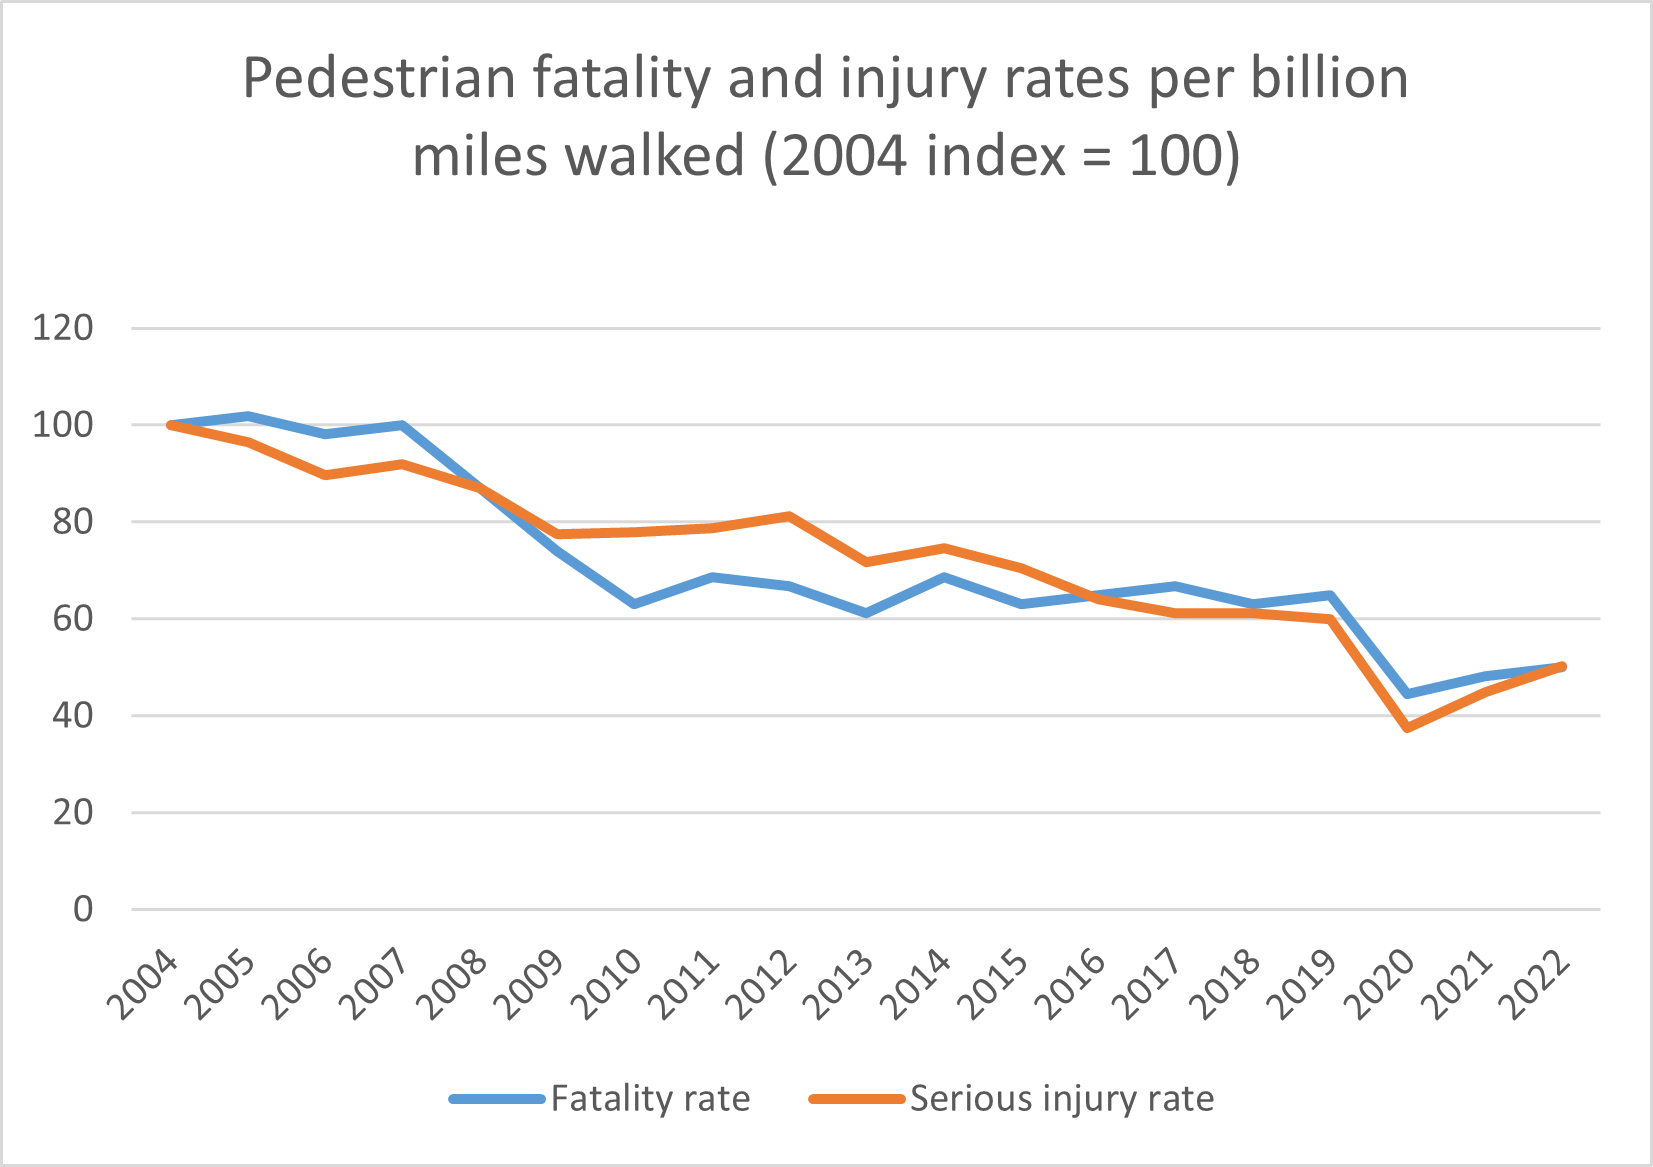
- In Great Britain in 2022, 385 pedestrians were killed and 5,901 were seriously injured. Even though pedestrian traffic (in billion miles walked) had risen by 16.0% from 2004 to 2022, pedestrian fatalities decreased by 42.6% and serious injuries decreased by 41.7%. As a result, the rates of pedestrian fatalities and pedestrian serious injuries per billion miles walked decreased by even larger percentages: 50.0% and 49.2% respectively. See the following chart. (Department for Transport, September 2023)
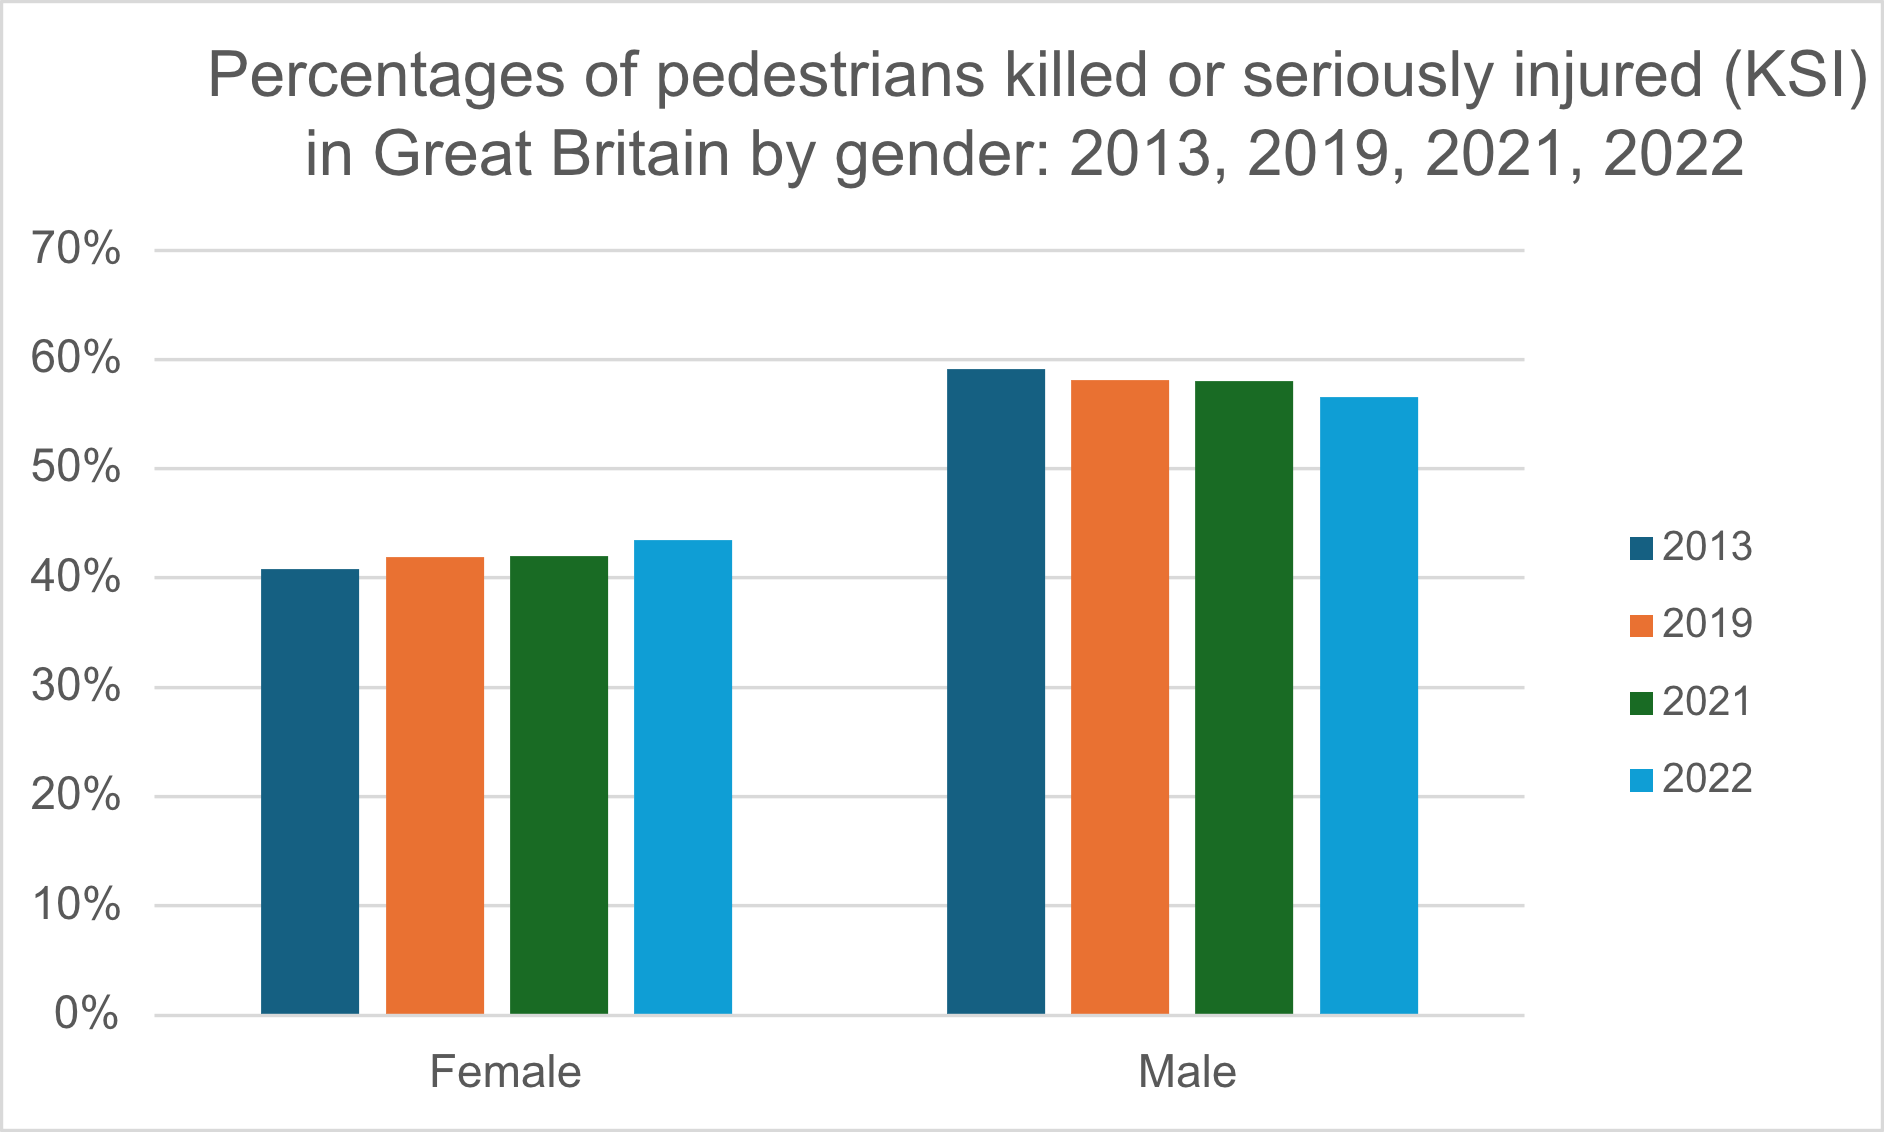
- In the period 2018 to 2022, 57.8% of the pedestrians killed or seriously injured were male, and 42.2% were female. There were more male than female pedestrian casualties in every age group except pedestrians aged 70 or older, (Department for Transport, September 2023)
Injuries and Fatalities by Gender
- Men account for 73% of all road traffic deaths worldwide, three times the rate of women. (Brake, 2020)
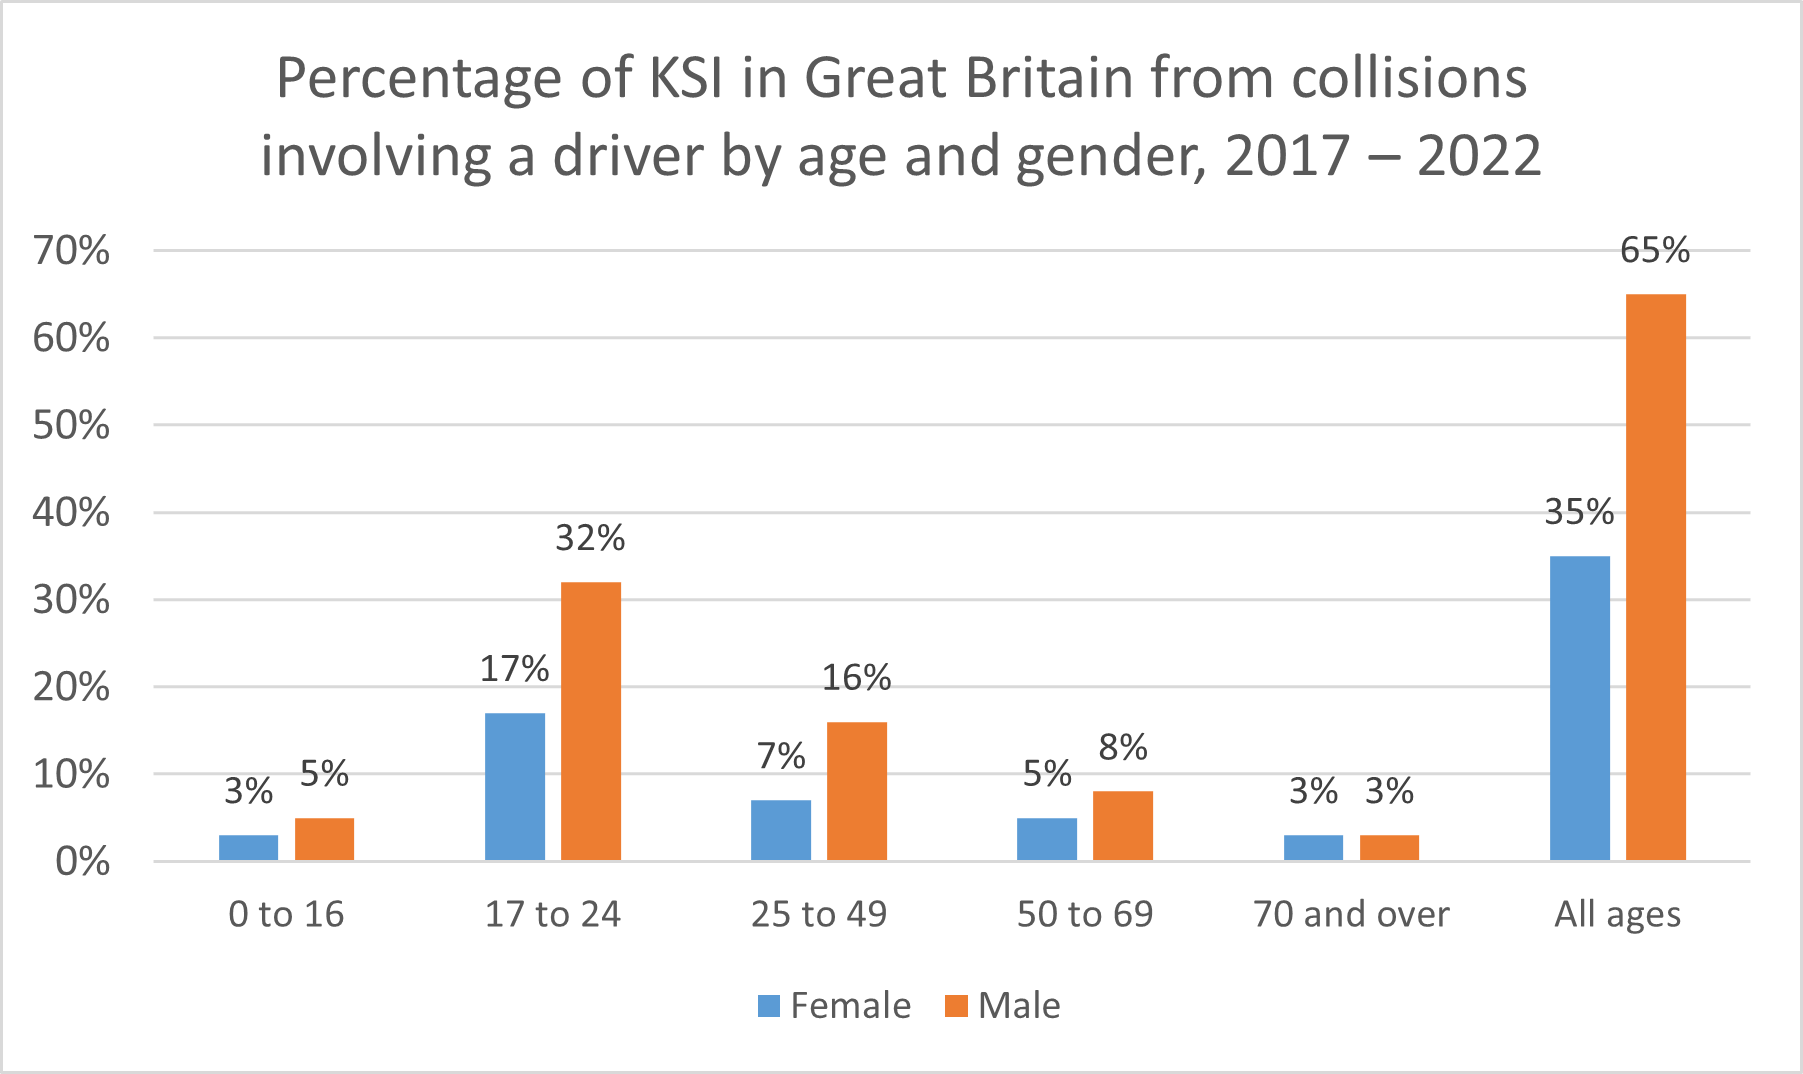
- In Great Britain from 2017 to 2022, male drivers accounted for 65% of killed or seriously injured (KSI) road casualties. In every age group younger than 70 years of age, male drivers accounted for more KSI casualties than female drivers did. Male drivers aged 17 to 24 accounted for 32% of all KSI casualties in 2022. See the following chart. (Department for Transport, September 2023)
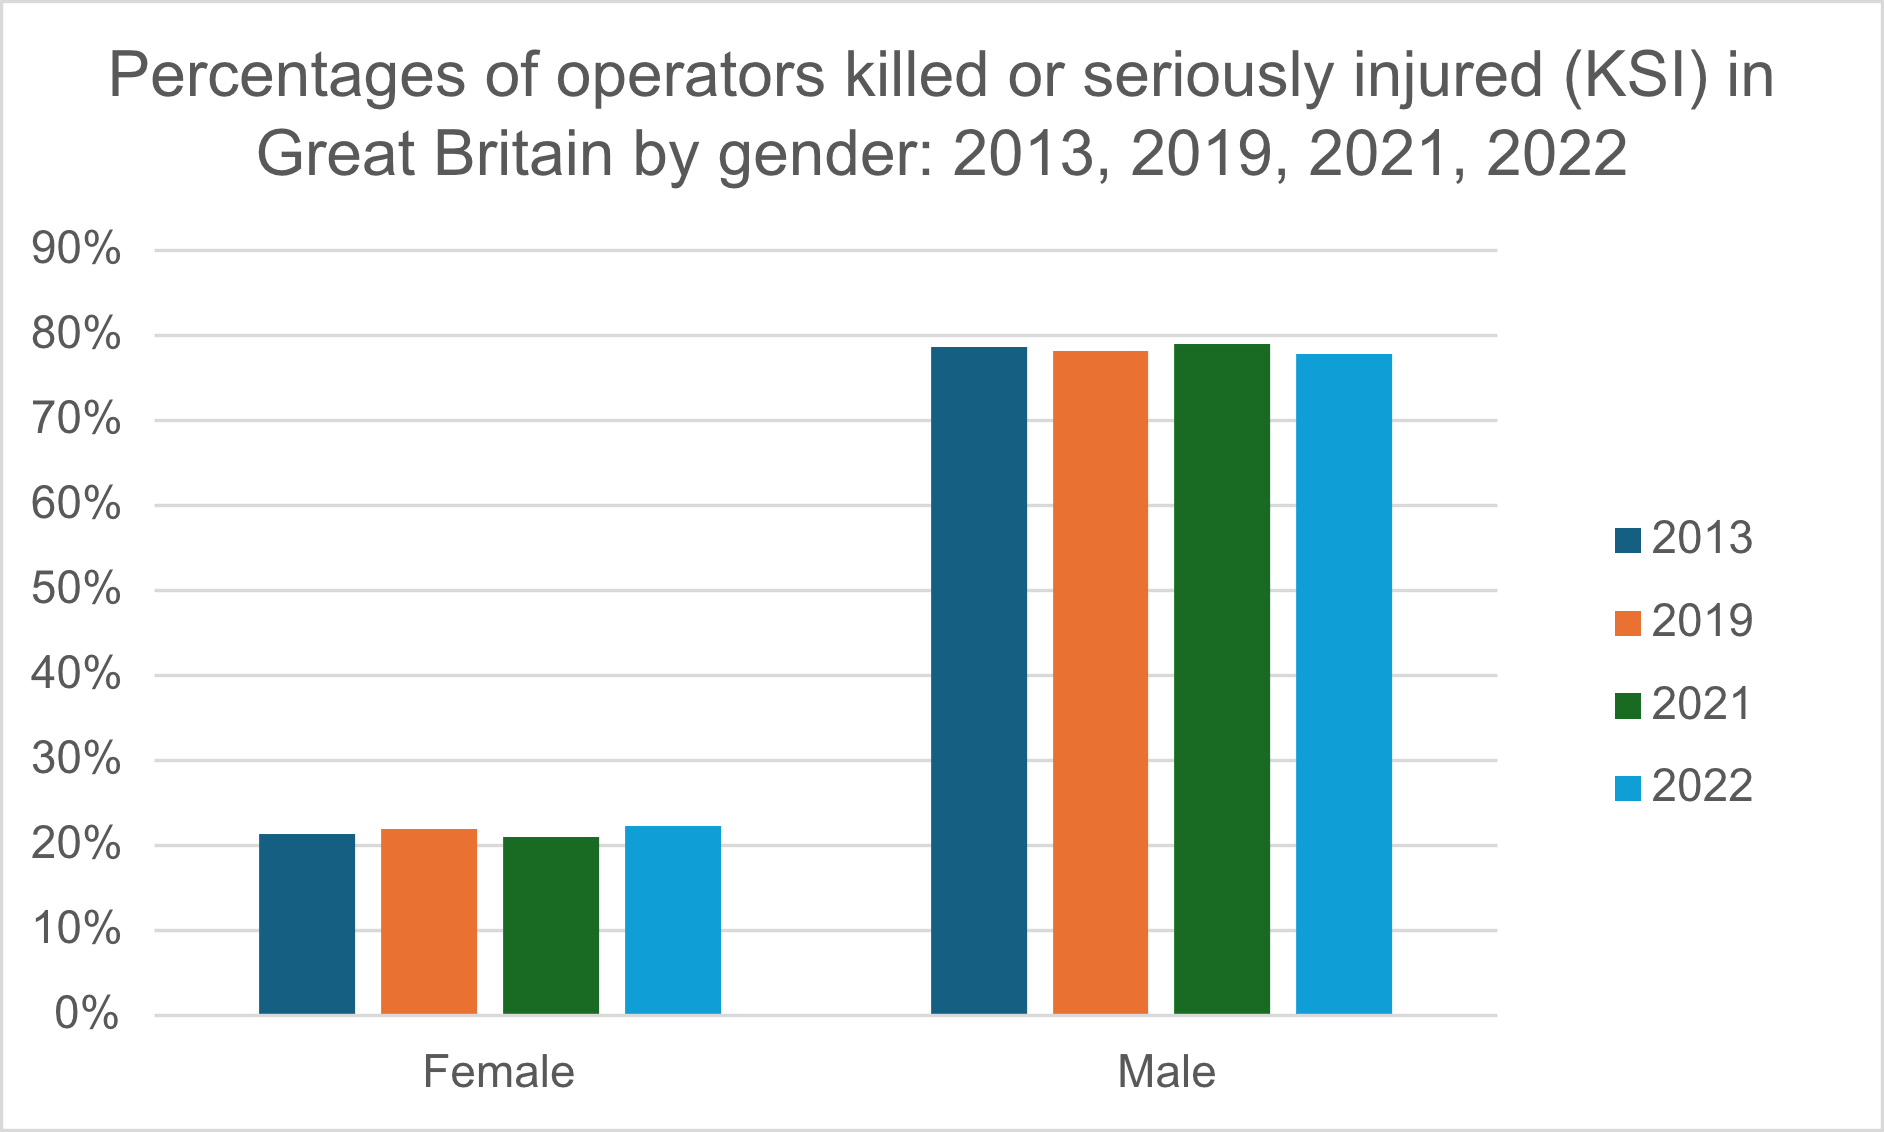
- In Great Britain, among operators of vehicles (including pedal cycles), the vast majority who were killed or seriously injured (KSI) in road accidents were male. In 2022, 77.8% of operator KSI casualties were male and 22.2% were female. From 2013 to 2022, the percentage of operator KSI casualties who were male decreased only slightly from 78.7% in 2013. In 2022, males made up 62.1% of car driver KSI casualties, 81.5% of cyclist KSI casualties, and 94.0% of motorcyclist KSI casualties. Males also made up 56.6% of pedestrian KSI casualties. See the following two charts. (Department for Transport, September 2023)
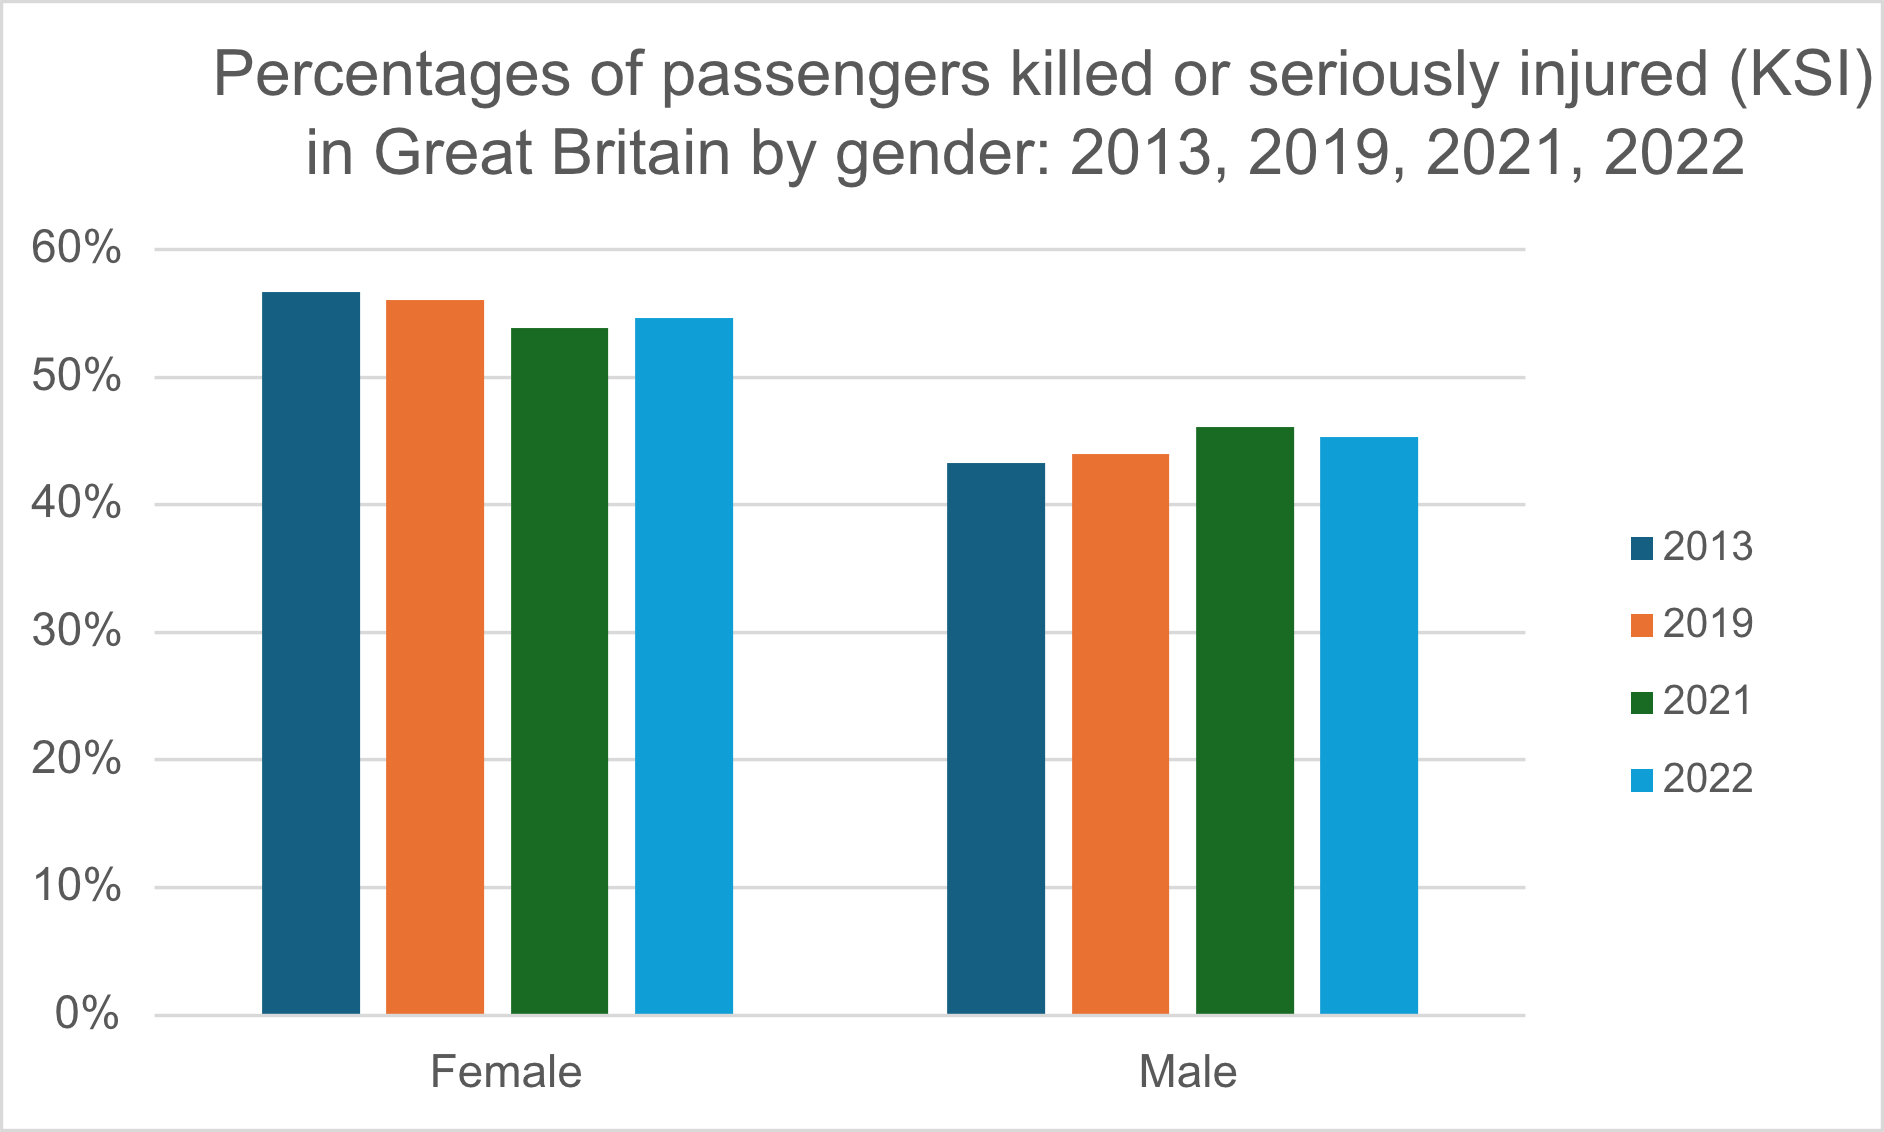
- However, for passengers of vehicles in 2022, the situation was reversed: a majority (54.7%) of KSI casualties among passengers of vehicles were female, down from 56.7% in 2013. In 2022, females made up 55.9% of car passenger KSI casualties. However, a slim majority (51.0%) of motorcycle passenger KSI casualties were male. See the following chart. (Department for Transport, September 2023)
Injuries and Fatalities by Age
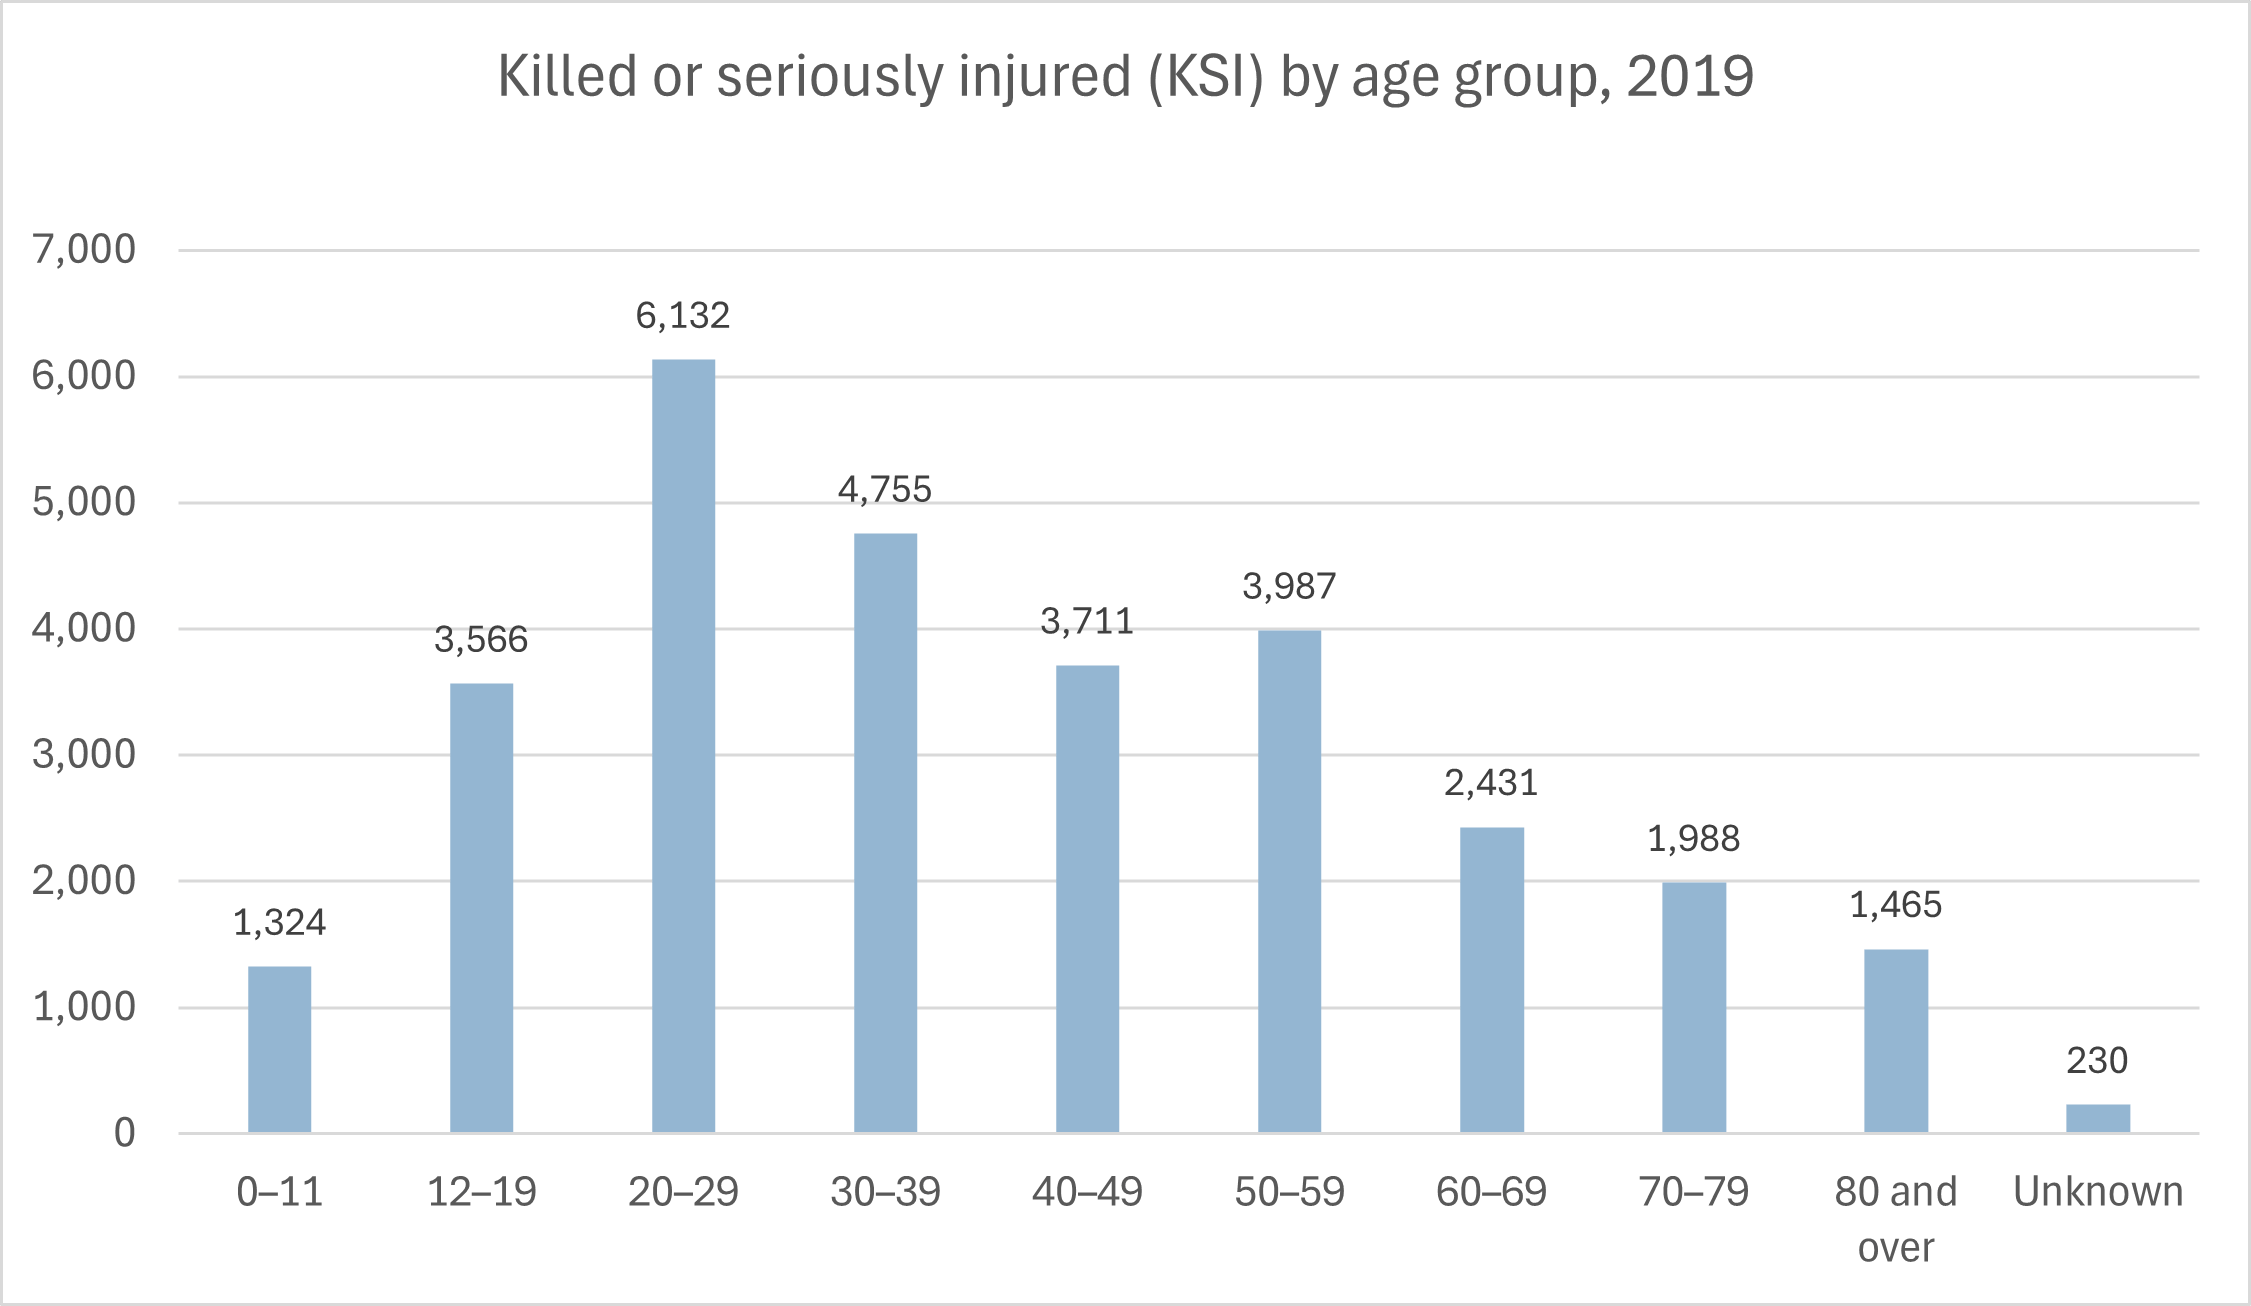
- The following chart shows the distribution of fatalities and serious injuries by age group in 2019. The data includes young people in all roles: car drivers, car passengers, motorcyclists, etc. As can be seen from the chart, more people in the 20–29 age group were killed or seriously injured than in any other age group. (Department for Transport, 2020)
- For UK car drivers in 2018, the rates of deaths and serious injuries per million population by age were as follows (Department for Transport, 2020):
- In Great Britain in 2022, about one-fifth of collisions resulting in persons killed or seriously injured (KSI) involved a young car driver. (In this context, a ‘young’ driver is a driver aged 17 to 24.) Still, from 2004 to 2022, KSI casualties involving a young car driver decreased by 60% from 12,333 in 2004 to 4,935 in 2022. (Department for Transport, September 2023)
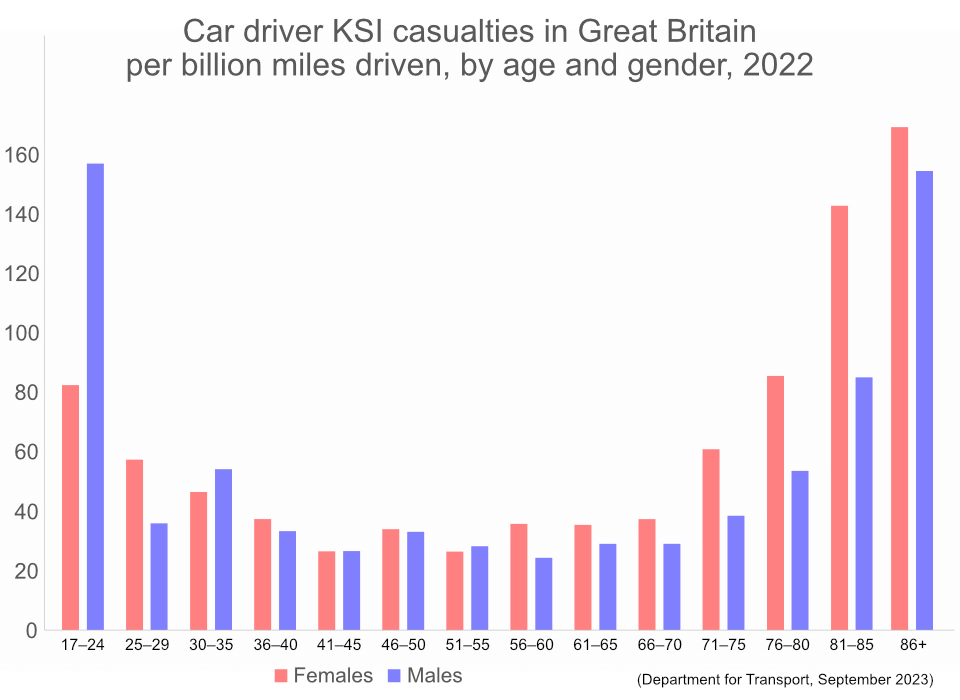
- In Great Britain in 2022, the rate of KSI car driver casualties per billion miles driven was generally higher for both the youngest drivers and the oldest drivers. The rate of KSI car driver casualties per billion miles driven was higher for male drivers aged 17 to 24 than the rates for all other age groups. In fact, it was four times as high as for male drivers aged 25 to 29. However, the rate of KSI car driver casualties also increased for older drivers (those aged 71 or older). The rate of KSI car driver casualties for male drivers aged 86 or older was second only to the rate for male drivers aged 17 to 24. See the following chart from the Department for Transport. (Department for Transport, September 2023)
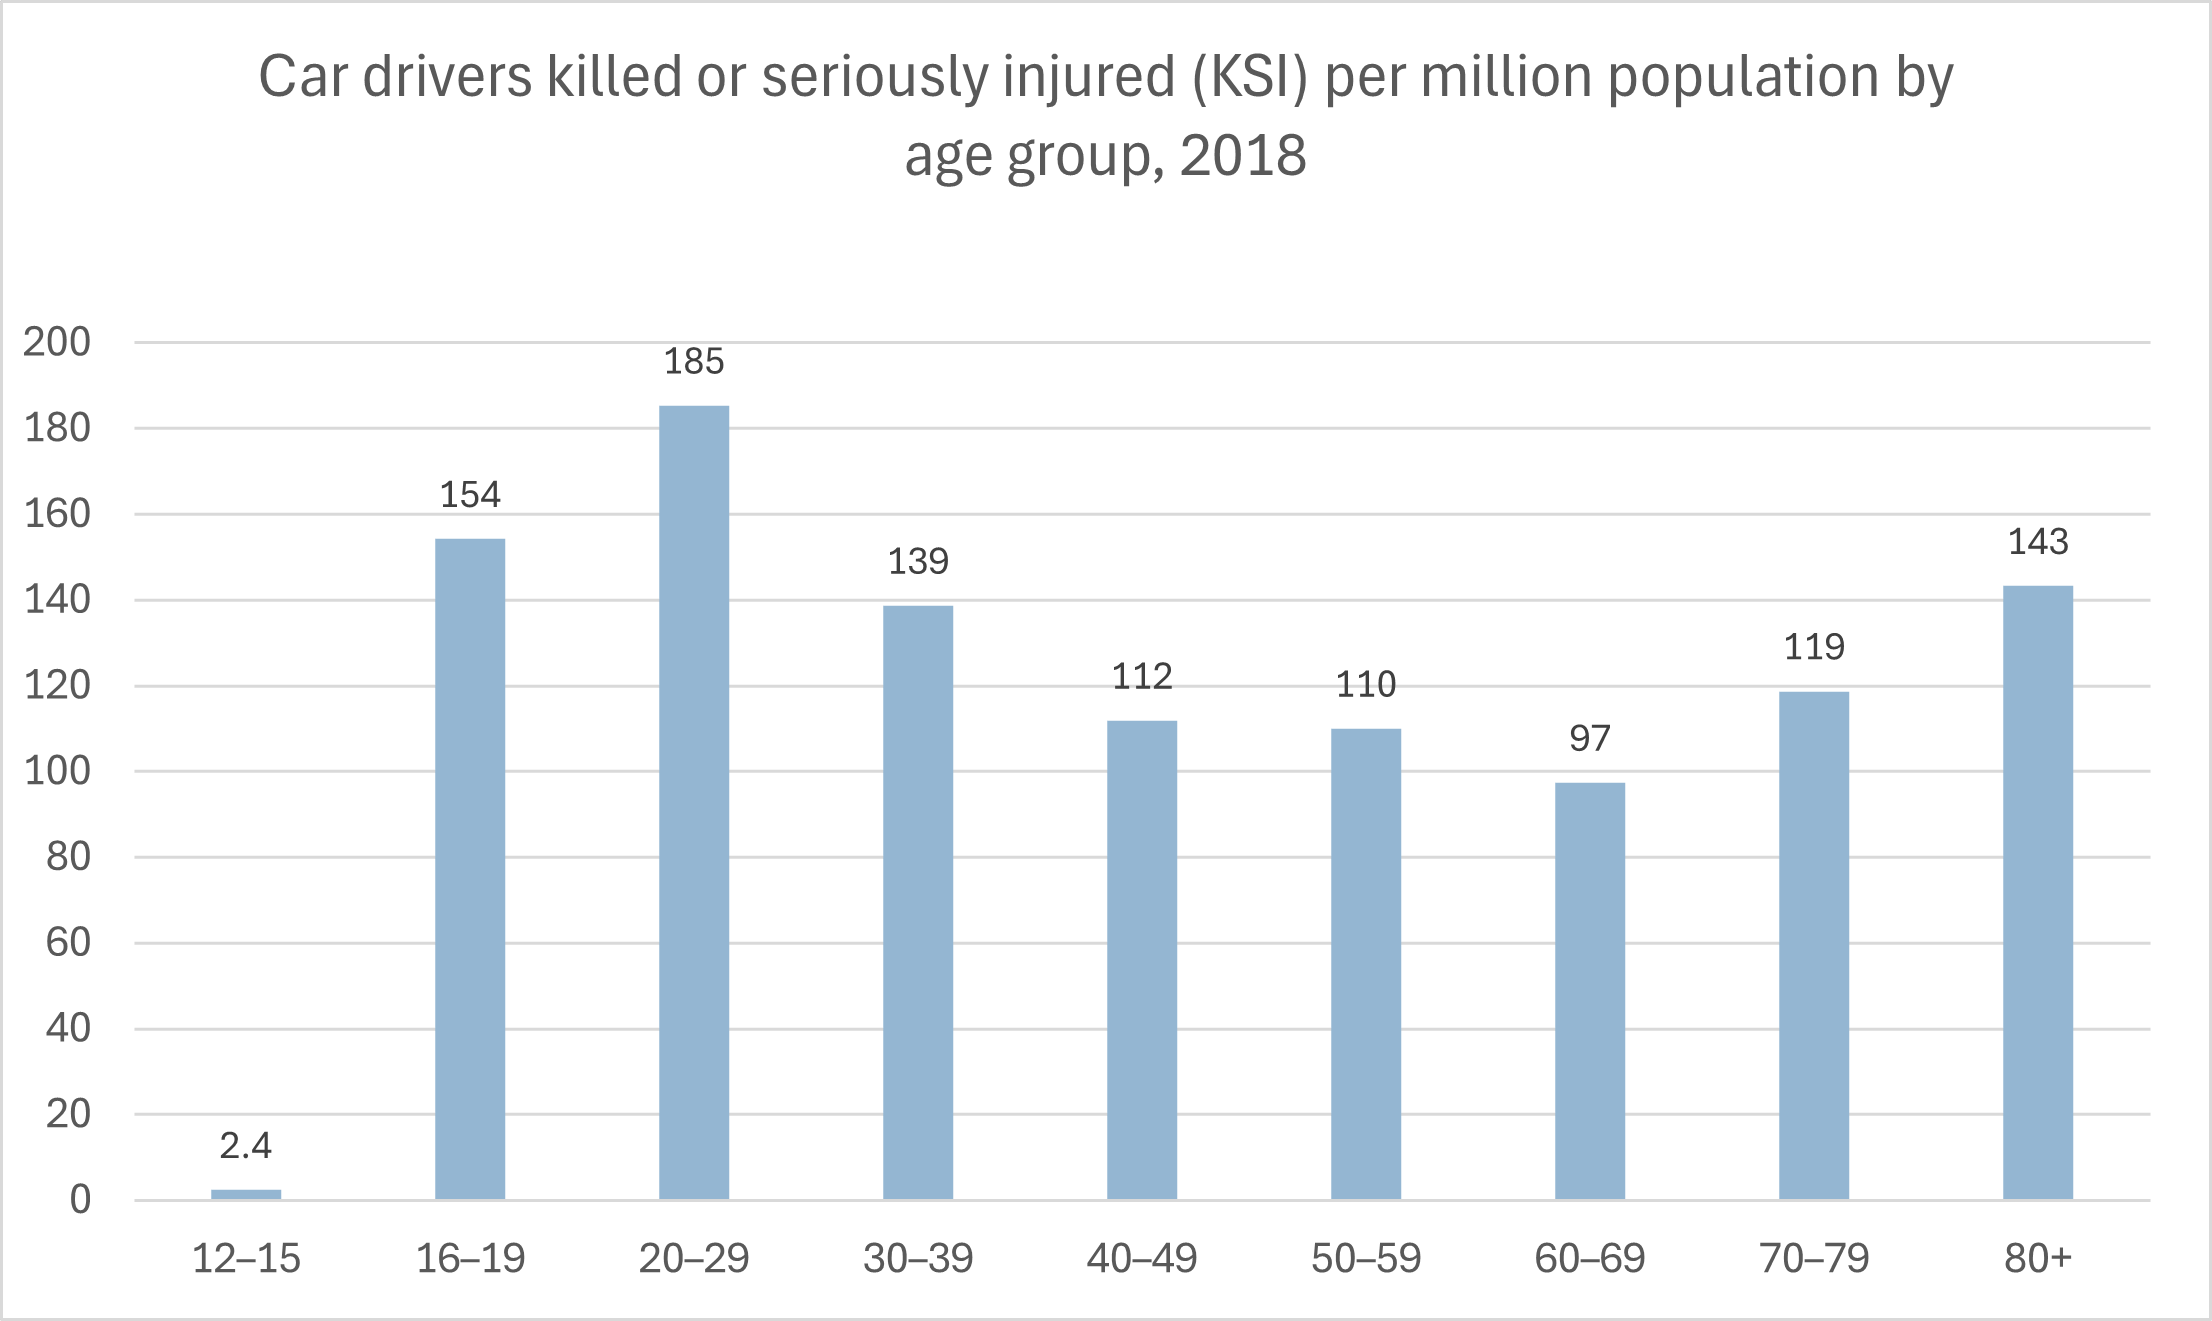
As can be seen in the above chart, drivers aged 16–19 were 38% more likely to be killed or seriously injured than drivers aged 40–49, and drivers aged 20–29 were 65% more likely to be killed or seriously injured than drivers aged 40–49.
Distracted Driving
- clothes while driving, 13% admitted to applying makeup while driving, and 15% admitted to engaging in sexual activity while driving. (WIRED, 2010)
- In 2018, there were 1,456 fatal accidents in Great Britain. DriverDriver distraction has become a worldwide concern. One study found that driver distraction was a contributory factor in 14% of accidents in Australia. In Canada from 2003 to 2007, 10.7% of all drivers killed or injured in crashes were distracted at the time. In Colombia in 2006, distraction caused 9% of all collisions and 21% of pedestrian collisions. In the Netherlands in 2004, 8.3% of road fatalities and injuries were caused by driver use of mobile phones. Research in New Zealand found that distraction was a contributory factor in 10% of fatal accidents and 9% of injury accidents there. In the United States in 2008, driver distraction was a contributory factor in 16% of road crashes. Not all the distractions leading to collisions in these countries involved the use of mobile devices, however. (World Health Organization and NHTSA, 2011)
- In Australia, the Netherlands, the United Kingdom and other European countries, 1–7% of drivers have been observed using mobile phones at any given moment during the day. (World Health Organization and NHTSA, 2011)
- One survey of drivers in six countries found that 35% admitted to changing their distraction was a contributory factor in 110 of them – nearly as many as for alcohol impairment (117 fatal accidents). Distractions included using a mobile phone while driving (25 fatal accidents), some other distraction inside the vehicle (68 fatal accidents), and some distraction outside the vehicle (17 fatal accidents). (Department for Transport, 2019)
- A roadside observation survey of drivers in 2017 found that 1.1% of drivers in Great Britain were using a hand-held mobile phone while driving on weekdays. 0.4% of drivers were holding a phone to their ear. For Scotland, the figures were somewhat higher: 2.0% of drivers were using a hand-held mobile phone while driving; 0.9% of drivers were holding a phone to their ear. For England and Wales alone, the figures were somewhat lower: 0.6% of drivers were using a hand-held mobile phone while driving; 0.2% of drivers were holding a phone to their ear. (Department for Transport and Scotland Transport, 2019)
- From 2014 to 2019, fatal collisions caused by drivers who were distracted by a mobile phone increased by 57%. (Brake, 2019)
- As part of the Office of National Statistics (ONS) Crime Survey for England and Wales in 2018–2019, drivers residing there were asked if they had used a mobile phone in their hand while driving within the previous 12 months. 5.5% of the drivers surveyed answered in the affirmative. 0.1% of drivers admitted to doing so every time they drove; 0.4% admitted to doing so most times that they drove. This question was asked again in 2019–2020. This time, 6.4% of drivers admitted to using a mobile phone in their hand while driving, with 0.1% doing so every time they drove, and 0.5% doing so most times that they drove. (ONS Crime Survey for England and Wales, September 2020)
- Out of 11,000 drivers observed in a study conducted in 2014 on roads in St. Albans, England, 16.8% were found to be engaged in a distracting activity, such as talking to passengers (8.8%), smoking (1.9%), talking on a hands-free mobile phone (1.7%), and talking on a hand-held phone (1.0%). The study also found younger drivers are more likely to be engaged in distracting activities. (Brake, 2020)
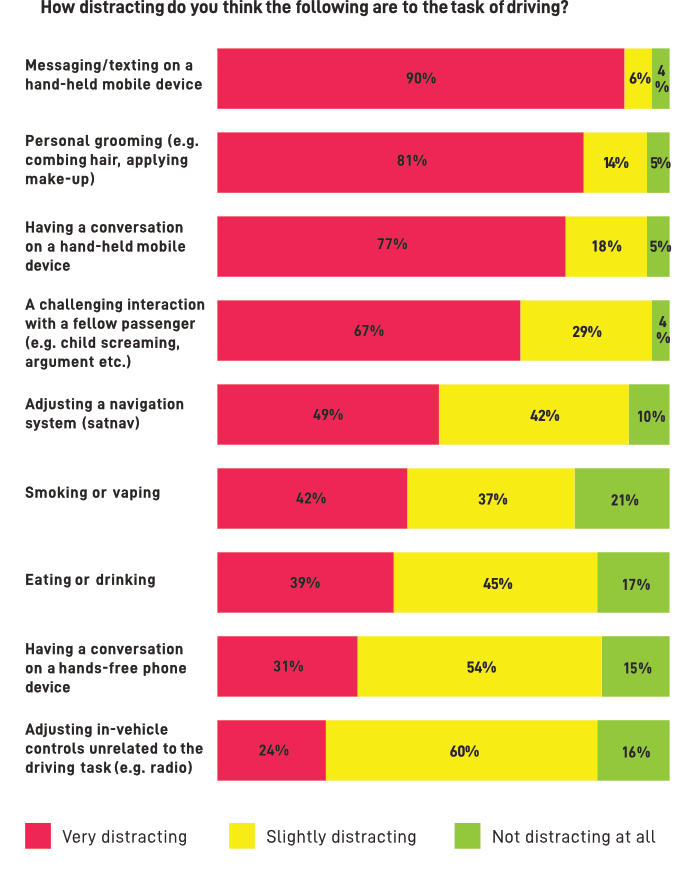
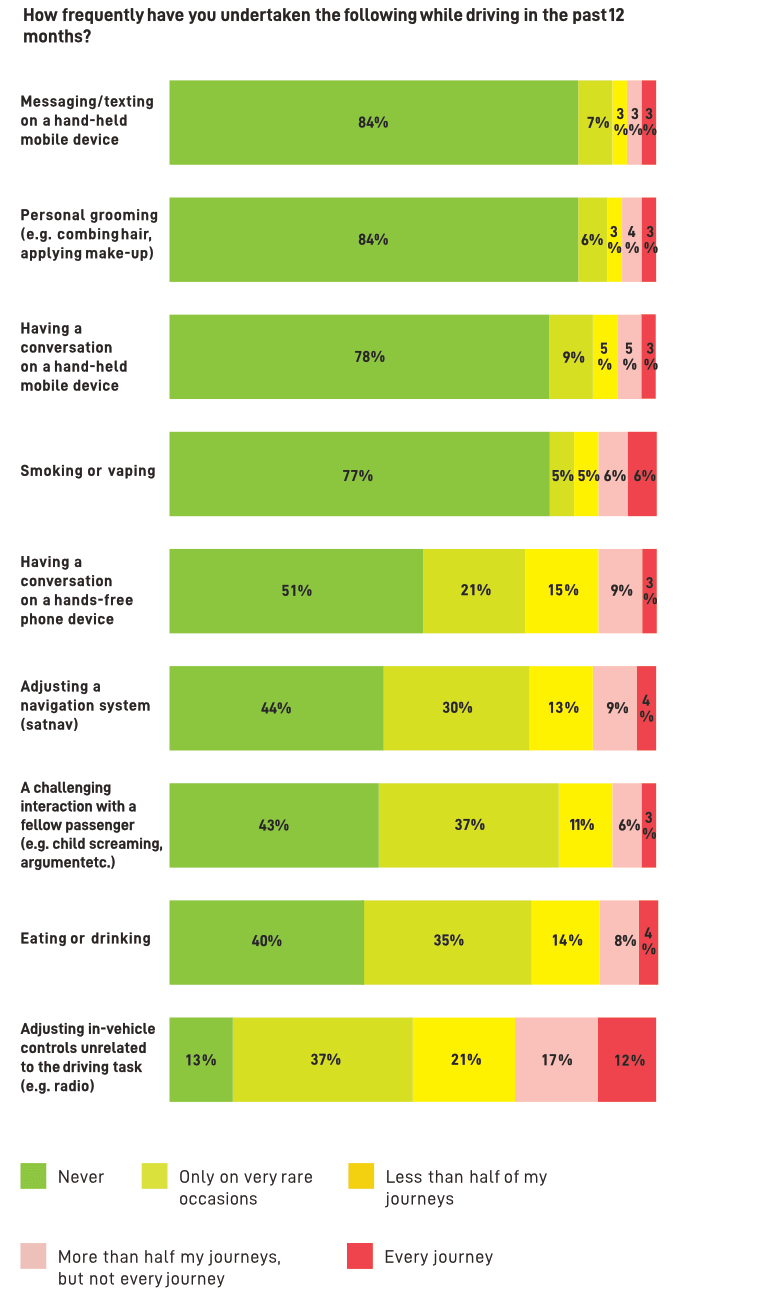
- In a survey of 1,009 drivers conducted in 2019, the vast majority of drivers agreed that personal grooming (81%), using a hand-held mobile device (77%), and challenging interactions with passengers (such as heated arguments) (67%) were very distracting from the task of driving. In addition, 49% of drivers agreed that adjusting a satellite navigation system while driving was very distracting, and another 42% of drivers considered it slightly distracting. Not all drivers agreed, however. 4% of drivers surveyed didn’t consider texting on a hand-held mobile device distracting. 5% of drivers surveyed didn’t consider having a conversation on a hand-held mobile device distracting. 5% of drivers surveyed didn’t consider personal grooming distracting either. And evidently, even some drivers who did consider these activities distracting continued performing them regularly. 6% of drivers admitted to texting on most or all of their journeys; 7% of drivers admitted to performing personal grooming activities on most or all of their journeys; and 8% of drivers admitted to having conversations on their hand-held mobile devices during most or all of their journeys. Finally, note that while only 16% of drivers surveyed said that adjusting vehicle controls unrelated to the driving task (such as the radio) wasn’t distracting, 29% of drivers surveyed admitted to adjusting such controls during most or all of their journeys. See the following two charts from that survey. (Brake and Direct Line, 2020)
- Talking on a mobile phone (whether hands-free or hand-held) while driving makes you four times more likely to be in a crash resulting in injuries. (Brake, 2023)
- Even after you cease using your phone while driving, it will take another half minute for you to regain full attention on the driving task. At 60 mph, your vehicle will travel half a mile in 30 seconds. (AAA Foundation for Traffic Safety, United States, 2015)
- Texting while driving increases the risk of crashing by 23 times. Dialling a cell phone increases crash risk by 6 times. (NHTSA, 2009 and 2018)
- Dialling a phone number while driving increases a teen's risk of crashing by six times. (NHTSA, 2018)
- Dialling a phone is one of the most dangerous distractions, increasing a driver's chance of crashing by 12 times. (Virginia Tech Transportation Institute, 2016)
- Texting while driving increases the risk of crashing by 23 times. (NHTSA, 2018)
- Texting increases your chances of rear-ending someone by a factor of 7. (AAA Foundation for Traffic Safety, 2018)
- The maximum amount of time that a driver can safely divert his or her attention from the road is two seconds. It takes a driver an average of five seconds to send a text message. (TeenSafe, 2018)
- Sending or reading a text message takes your eyes off the road for an average of five seconds. At 60 mph, your vehicle will travel 440 feet in five seconds.
- Driving while crying or visibly angry increased the risk of crashing by 10 times. (Virginia Tech Transportation Institute, 2016)
- Using a hands-free electronic device is four times more distracting to a driver than talking to an adult passenger. (Driver's Alert, 2017)
- Child passengers can be 12 times more distracting to a driver than talking on a mobile phone. One study found that the average parent driver in the United States took his or her eyes off the road for three minutes and 22 seconds during a 16-minute trip. (Monash University, 2013)
- Manual transmission vehicles double the chances of distracted driving crashes caused by food consumption. (Drive-Safely.net, 2019)
Related to Alcohol
- You are 46% more likely to be at fault in a road collision if your blood alcohol content (BAC) is just 10 mg of alcohol per ml of blood. You are three times more likely to die in a traffic crash if your BAC is 20–50 mg of alcohol per 100 ml of blood. You are six times more likely to die if your BAC is 50–80 mg of alcohol per 100 ml of blood. An average 180-pound male will reach a BAC of 30 mg of alcohol per 100 ml of blood after consuming 12 ounces of beer. The legal alcohol limit in England and Wales is 80 mg of alcohol per 100 ml of blood, which is the highest drink-drive limit in Europe. In some European nations, such as the Czech Republic, the legal alcohol limit is zero. (California Driver’s Handbook, California DMV, January 2023; Brake, February 2024)
- In Great Britain in 2021, there were 240 fatal drink-drive collisions and 1,290 serious drink-drive collisions, resulting in an estimated 260 ± 20 deaths and 1,610 serious injuries. An average of over 200 people are killed in drink-drive collisions each year. (Department for Transport, July 2023)
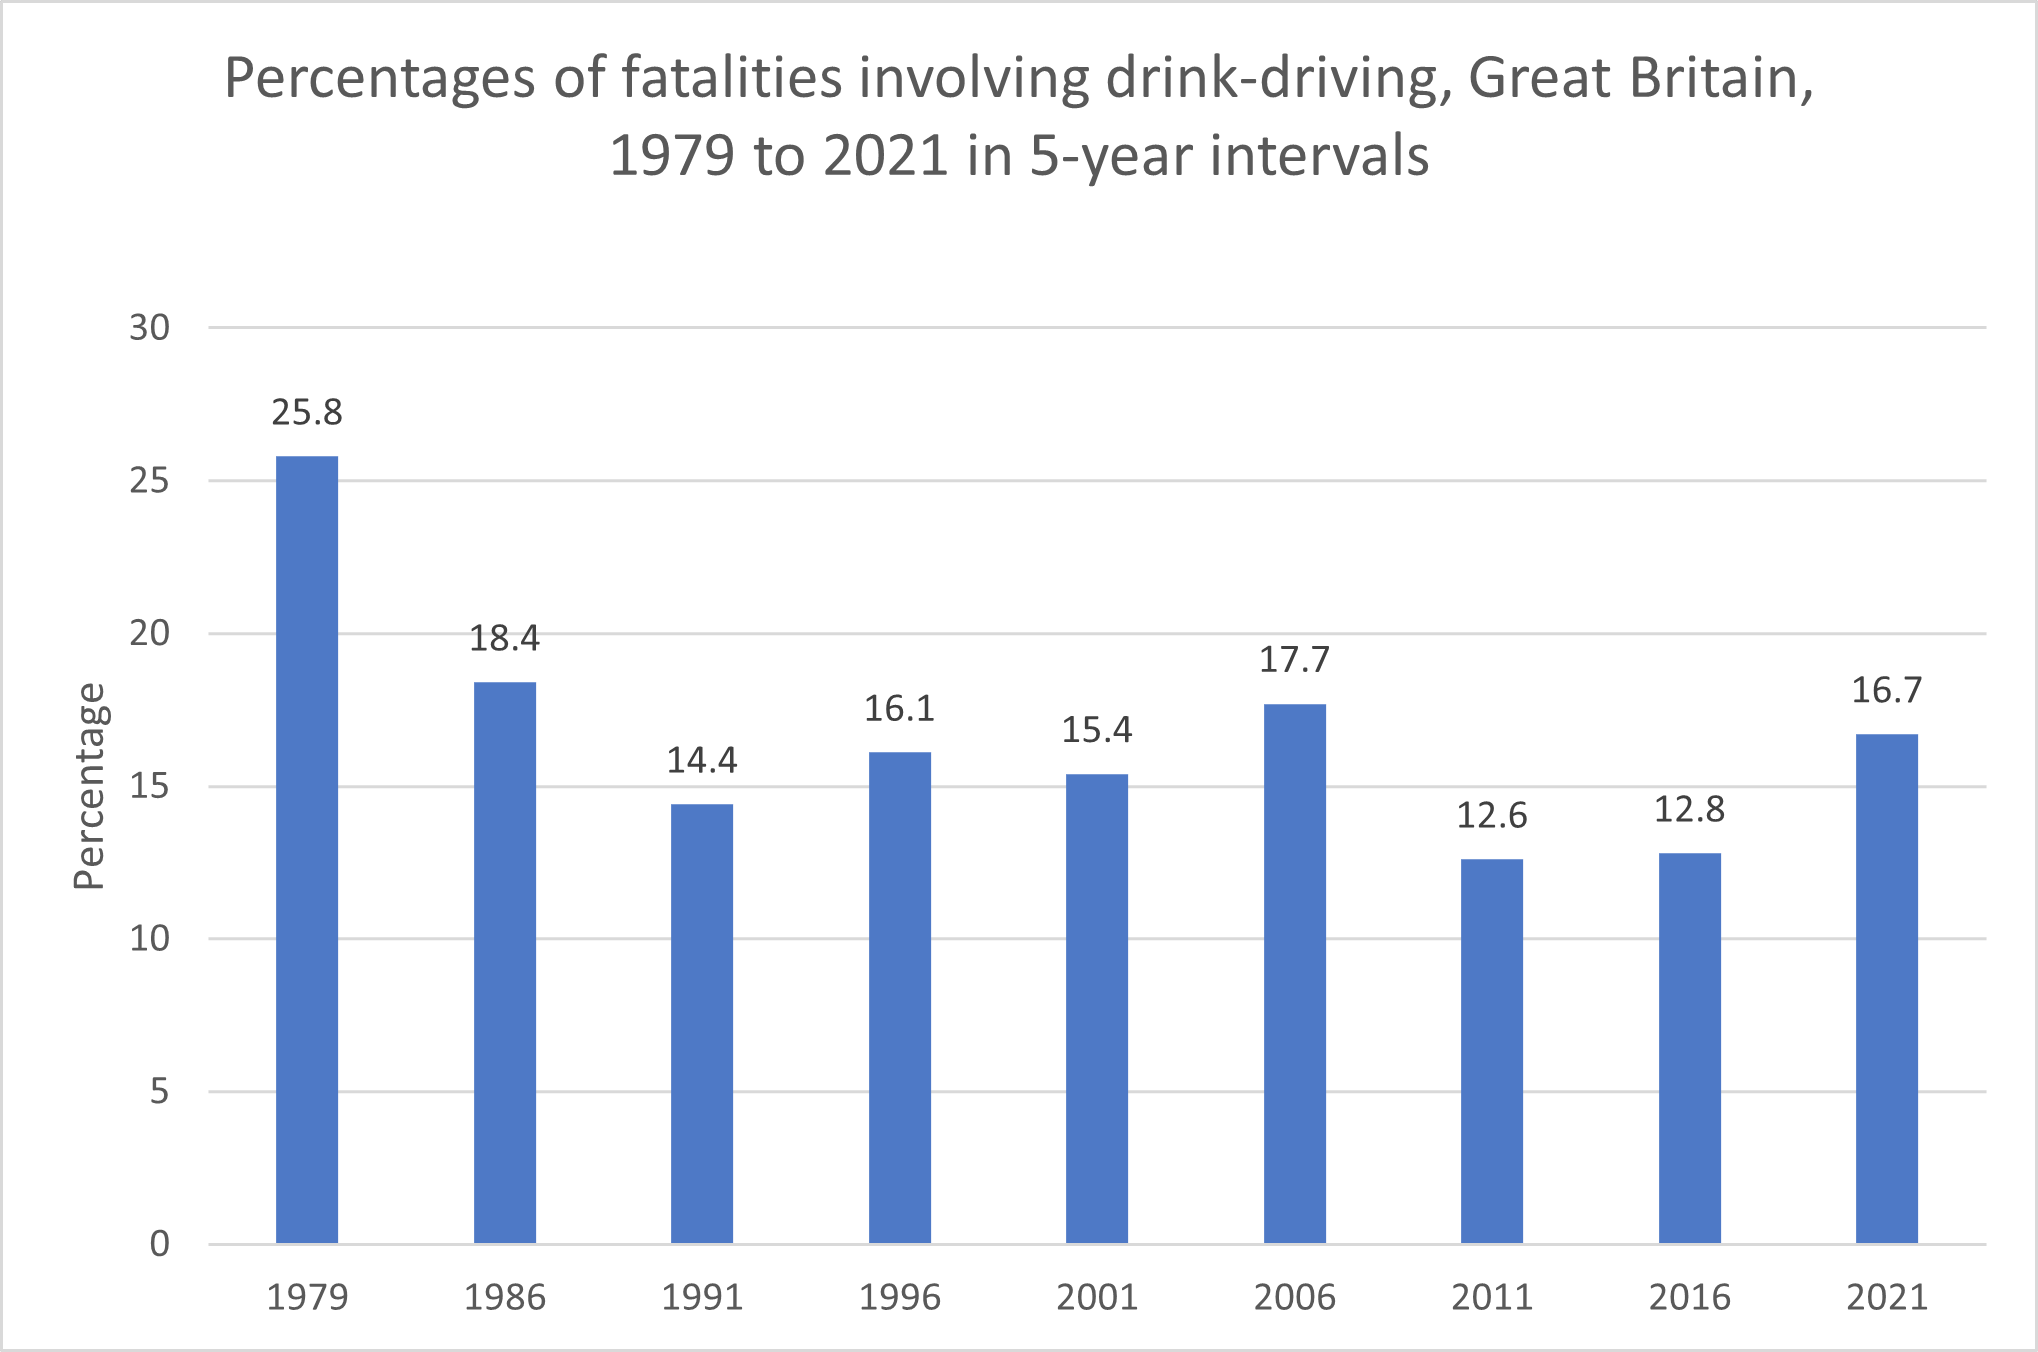
- In Great Britain in 2021, an estimated 260 ± 20 people were killed in accidents in which at least one driver or rider was over the legal drink-drive limit. This figure represented about 16.7% of all deaths in reported road accidents. The proportion of fatalities in which drink driving was a contributory factor has declined over time. In 1979, 25.8% of fatalities had occurred in accidents in which at least one driver or rider was over the legal drink-drive limit. See the following chart. Note that in 2011, only 12.6% of fatalities involved drink driving, but there was an uptick to 16.7% in 2021. (Department for Transport, July 2023)
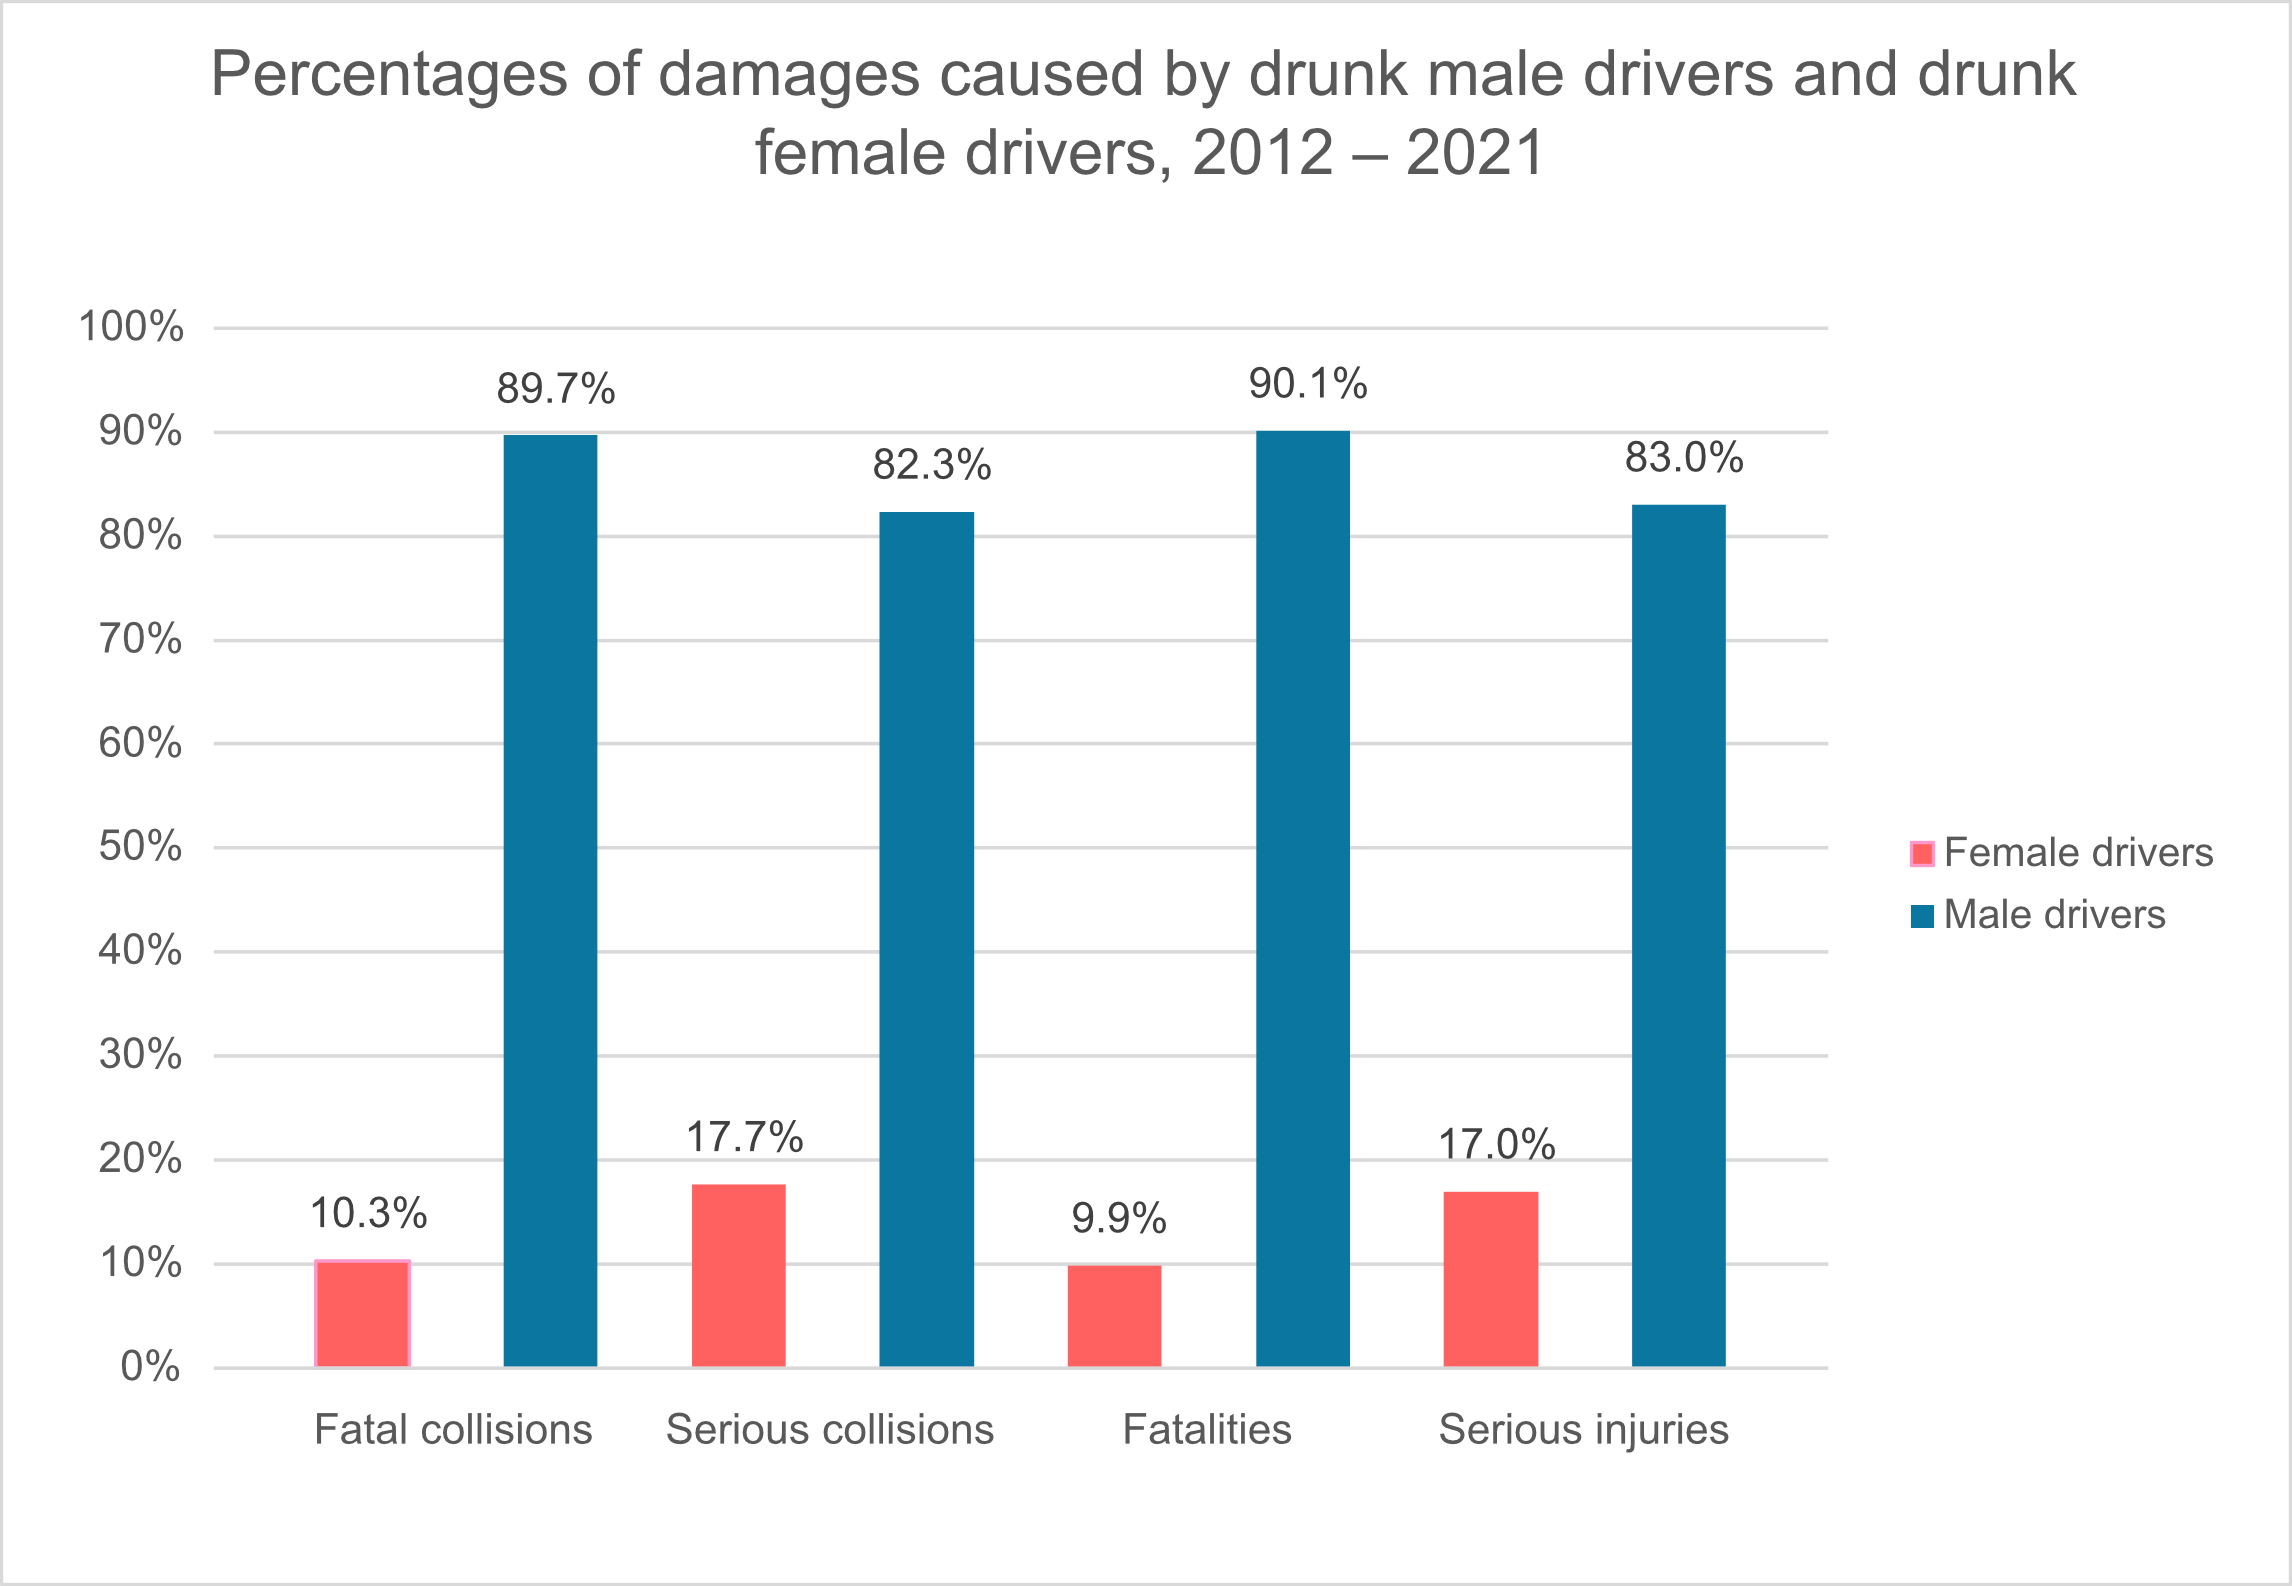
- In the period 2012 to 2021, drunk male drivers were involved in far more serious and fatal collisions than drunk female drivers. Drunk male drivers were involved in 89.7% of the fatal collisions, 82.3% of the serious collisions, 90.1% of the fatalities, and 83.0% of the serious injuries. See the following chart. (Department for Transport, July 2023)
- The cost of drink-drive accidents in the United Kingdom in 2014 was estimated at £754 million. (Institute of Alcohol Studies, 2019)
- From 1979 to 2018, the number of road traffic accidents per year declined by 52%, but the number of drink-drive accidents per year declined by 70%, suggesting that some drink-drive policies have successfully reduced the rate of drink-driving accidents. (Department for Transport, 2018)
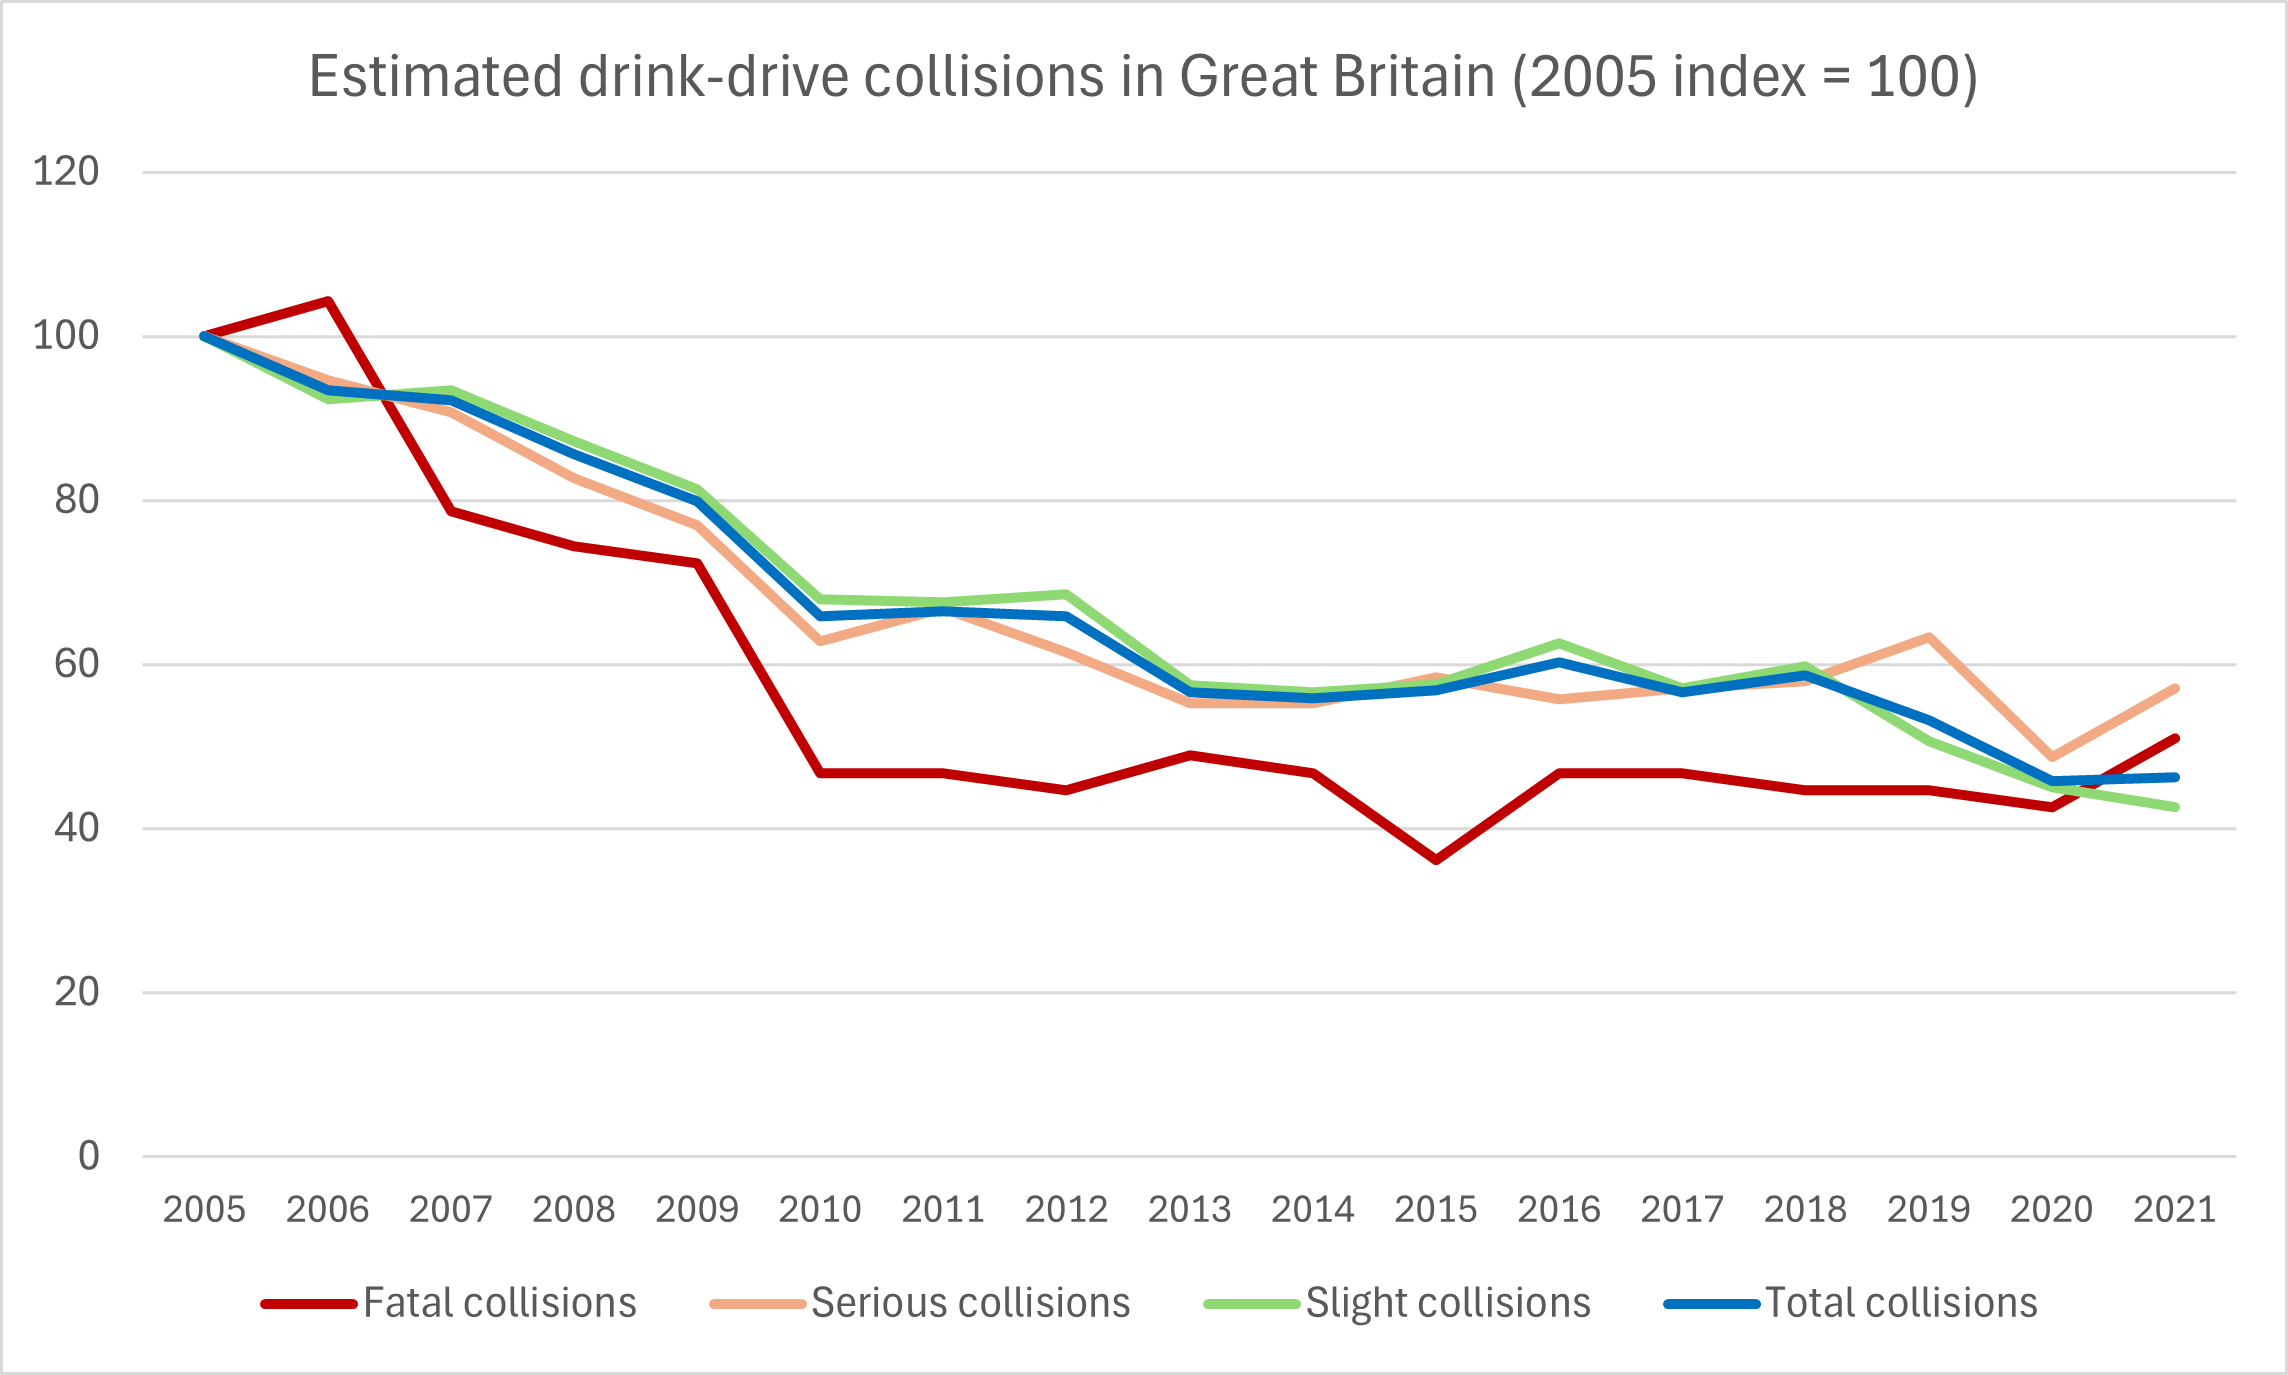
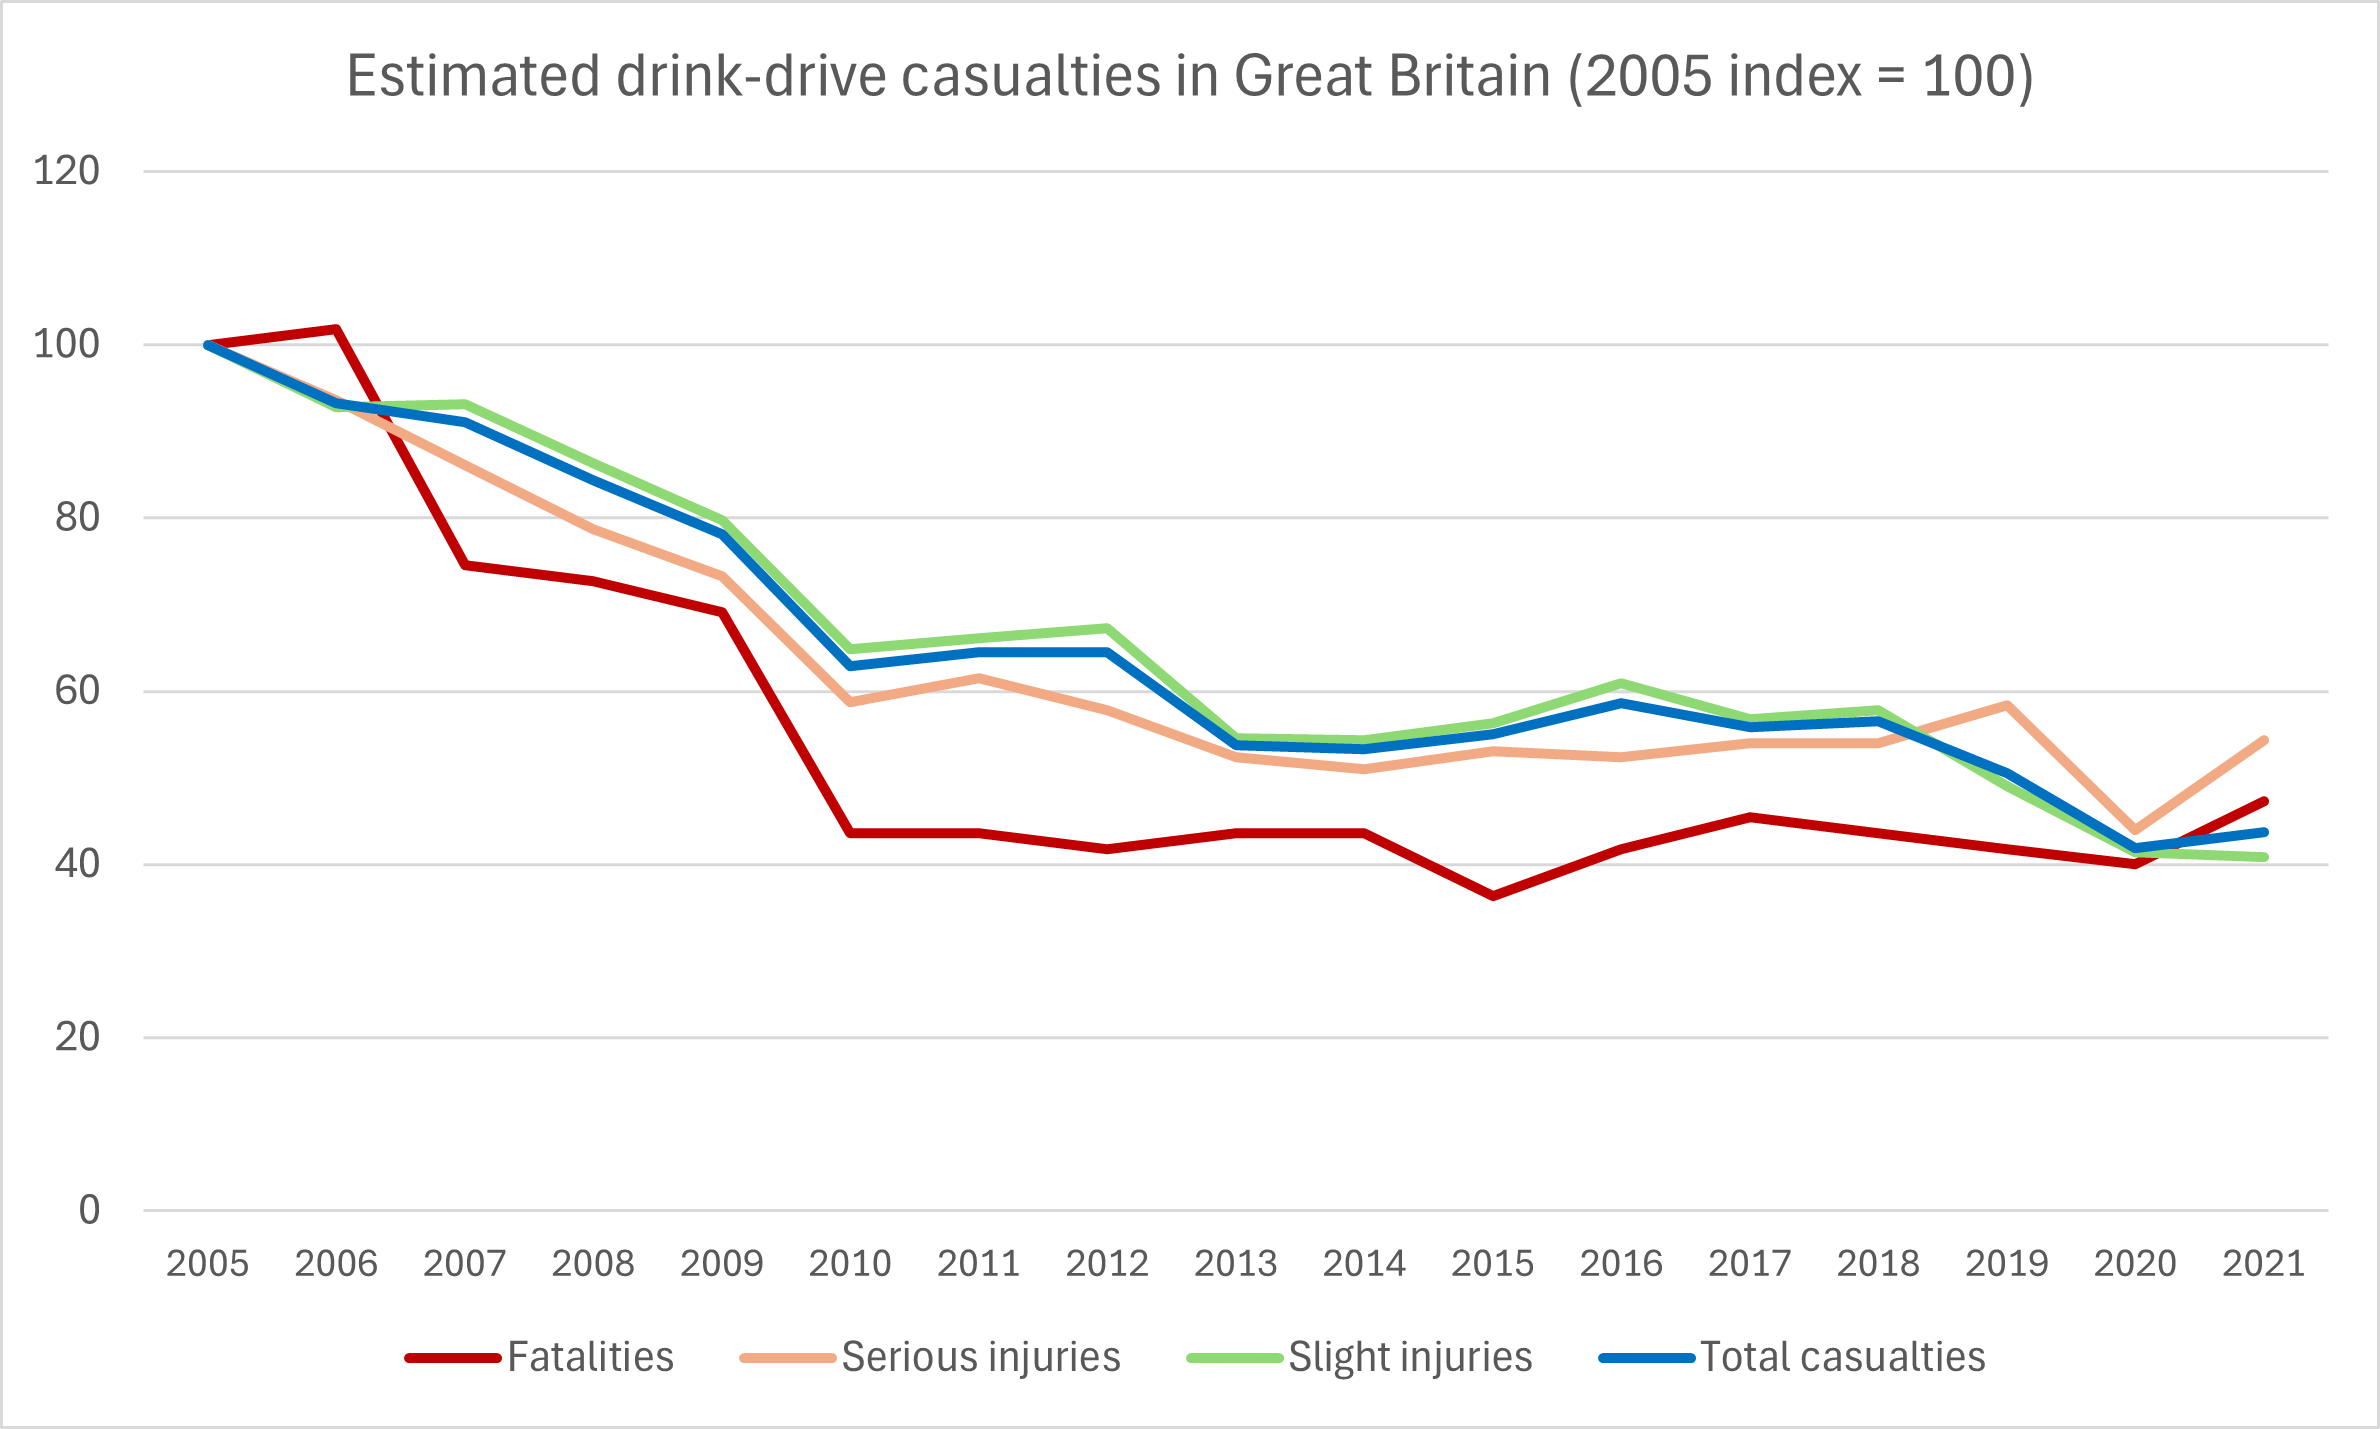
- From 2005 to 2014, there was a general declining trend in drink-drive collisions in Great Britain, but that trend generally levelled off or (for serious drink-drive collisions) rose again to a local peak in 2019. In 2020, serious collisions declined sharply during the first year of the COVID pandemic. In 2021, however, serious and fatal drink-drive collisions rose sharply. A similar pattern existed for drink-drive casualties: a general declining trend from 2005 to 2014, followed by a levelling off through 2018, a sharp decline in 2020, and finally a rebound in 2021. See the following two charts. (Department for Transport, July 2023)
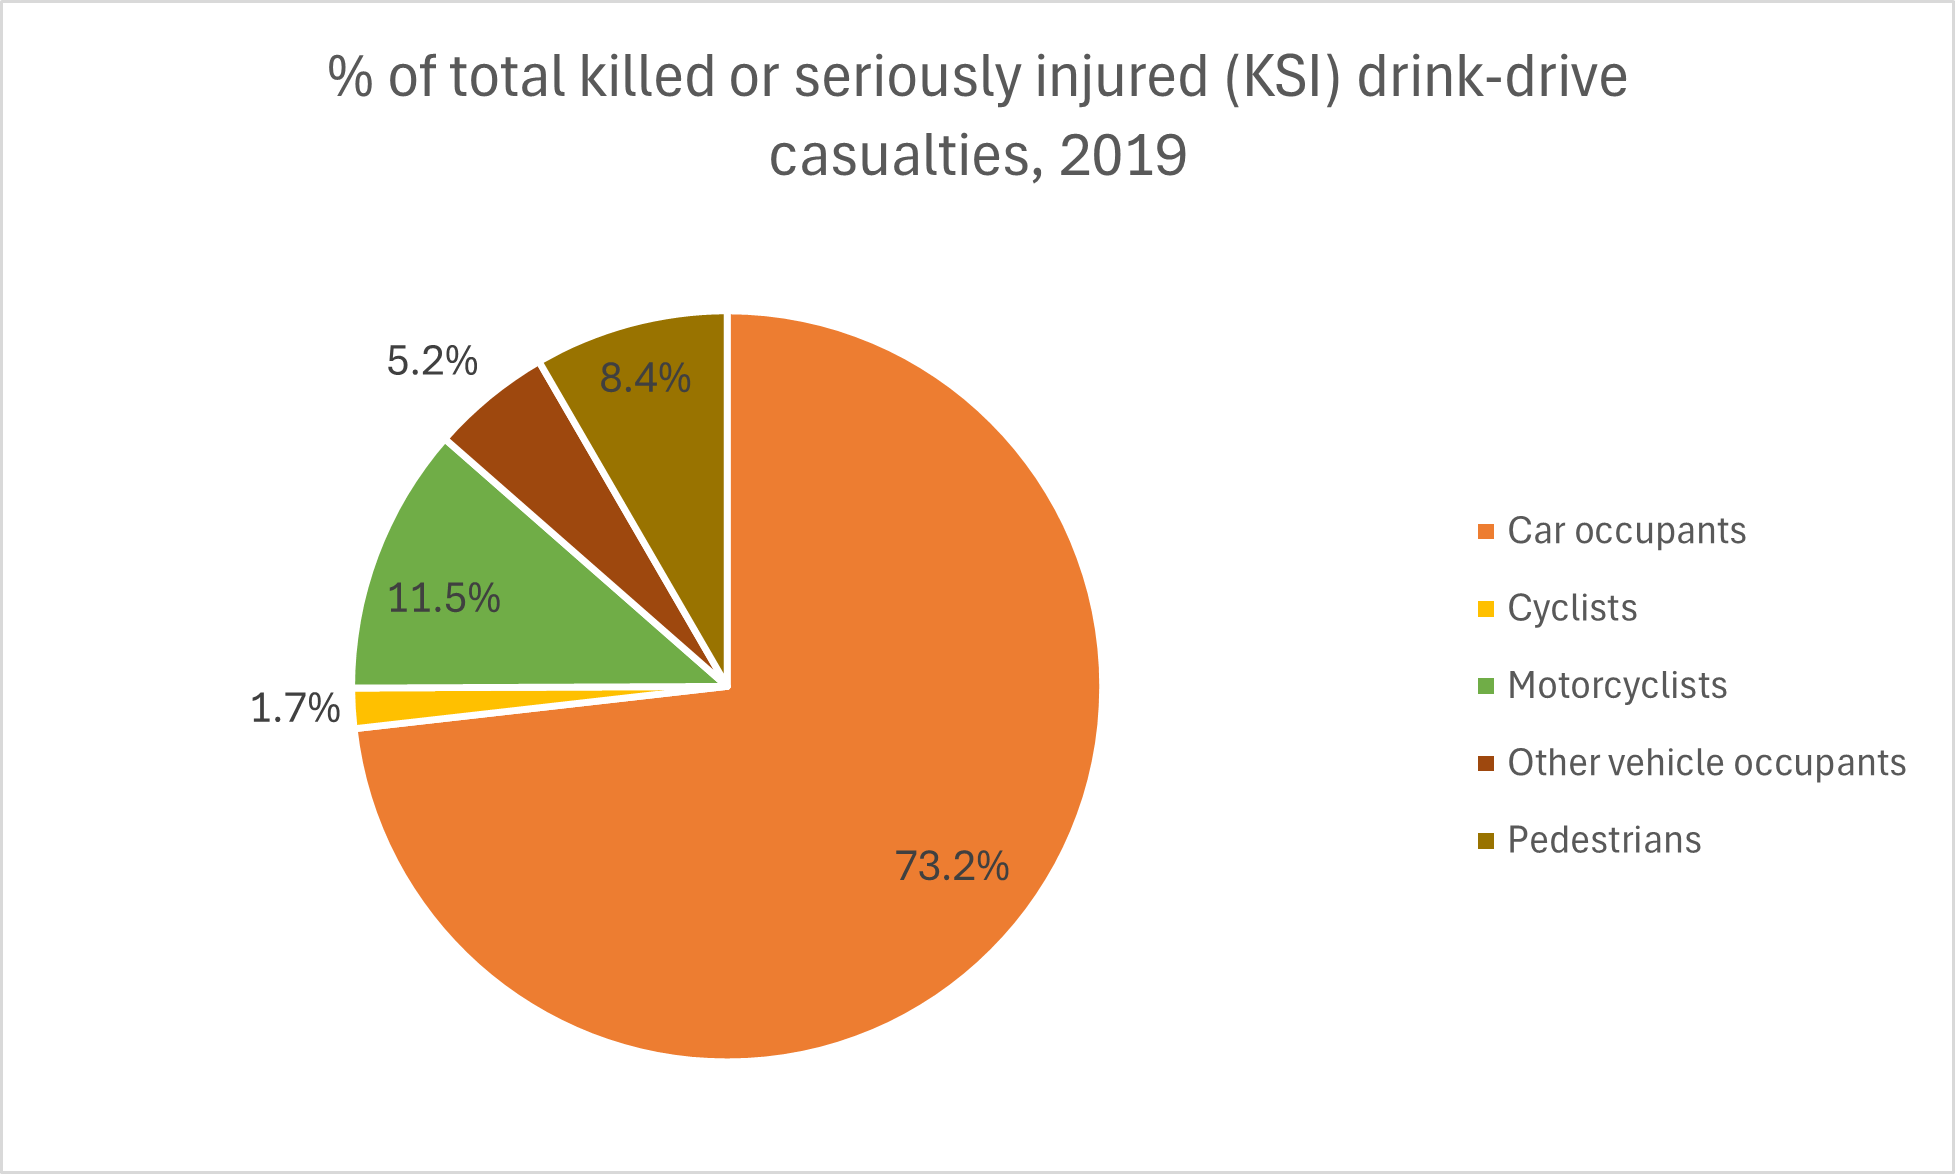
- The following chart shows the breakdown of drink-driving serious casualties (deaths and serious injuries) by casualty type (road user type) in Great Britain in 2019. Most serious drink-drive casualties were among car occupants: 73.2% of the total number of deaths and serious injuries. Motorcycles accounted for 11.5% of serious drink-drive casualties. However, cars accounted for about 78% of total vehicle miles travelled, and motorcycles accounted for less than one percent (see the Motor Vehicle Traffic chart in the Driver Demographics section). (Department for Transport, July 2023)
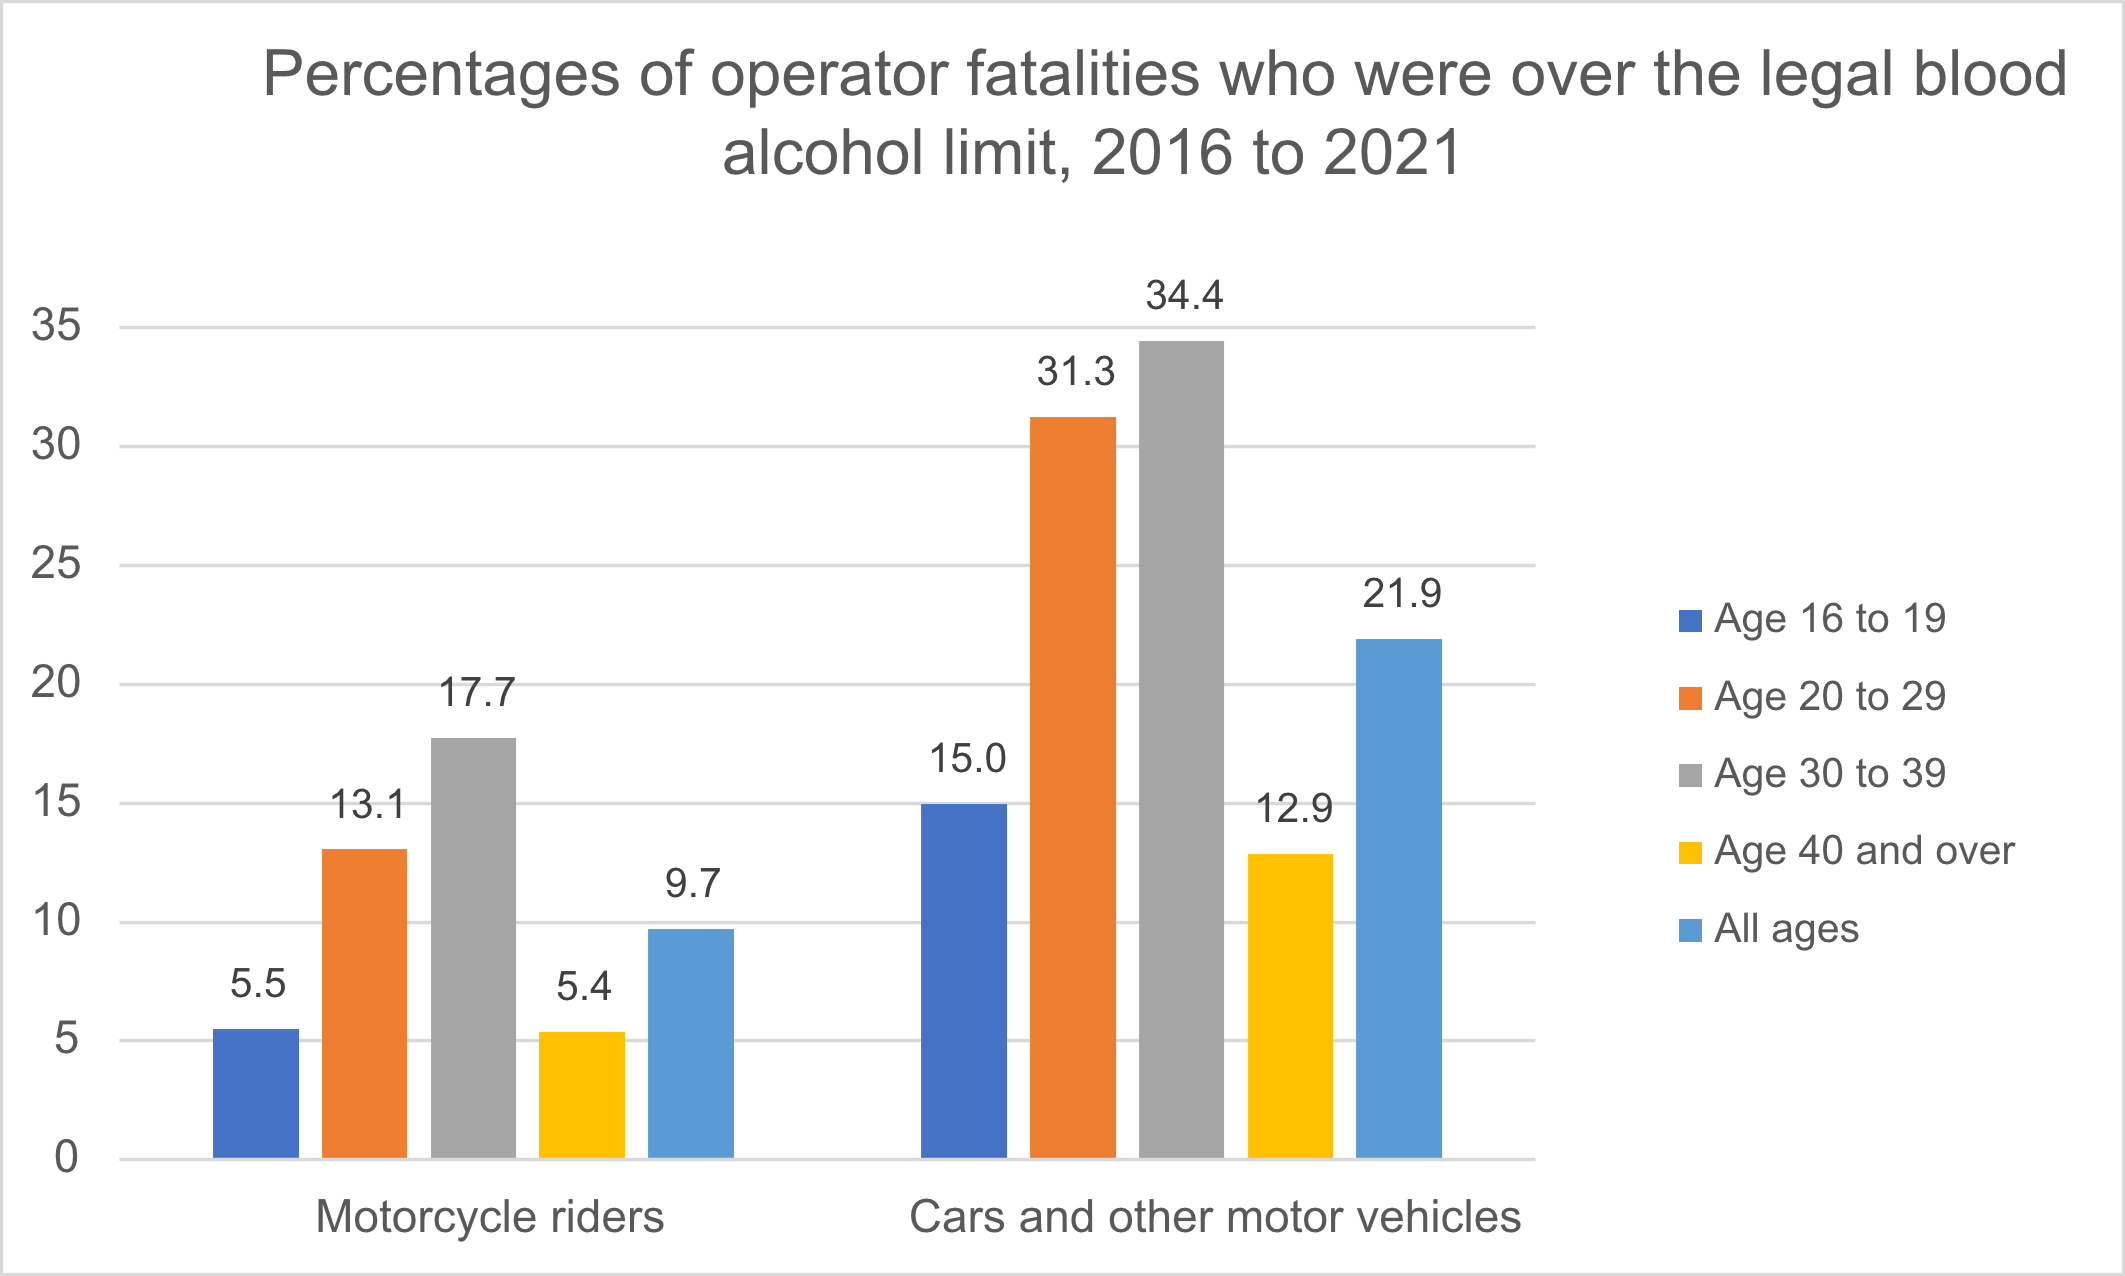
- In the period 2016 to 2021, an average of 9.7% of motorcycle riders who had been killed in collisions were found to be over the legal blood alcohol limit. In that same period, an average of 21.9% of the drivers of cars and other vehicles who had been killed in collisions were found to be over the legal blood alcohol limit. The following chart breaks these figures down further by the age groups of the persons killed. For both car drivers and motorcycle riders who had died, the highest percentages of legal intoxication were in the 30 to 39 age group. (Department for Transport, July 2023)
- In Great Britain in 2017, 73.8% of the drink-drive serious casualties (deaths and serious injuries) were male; 26.2% were female. (Department for Transport, 2019)
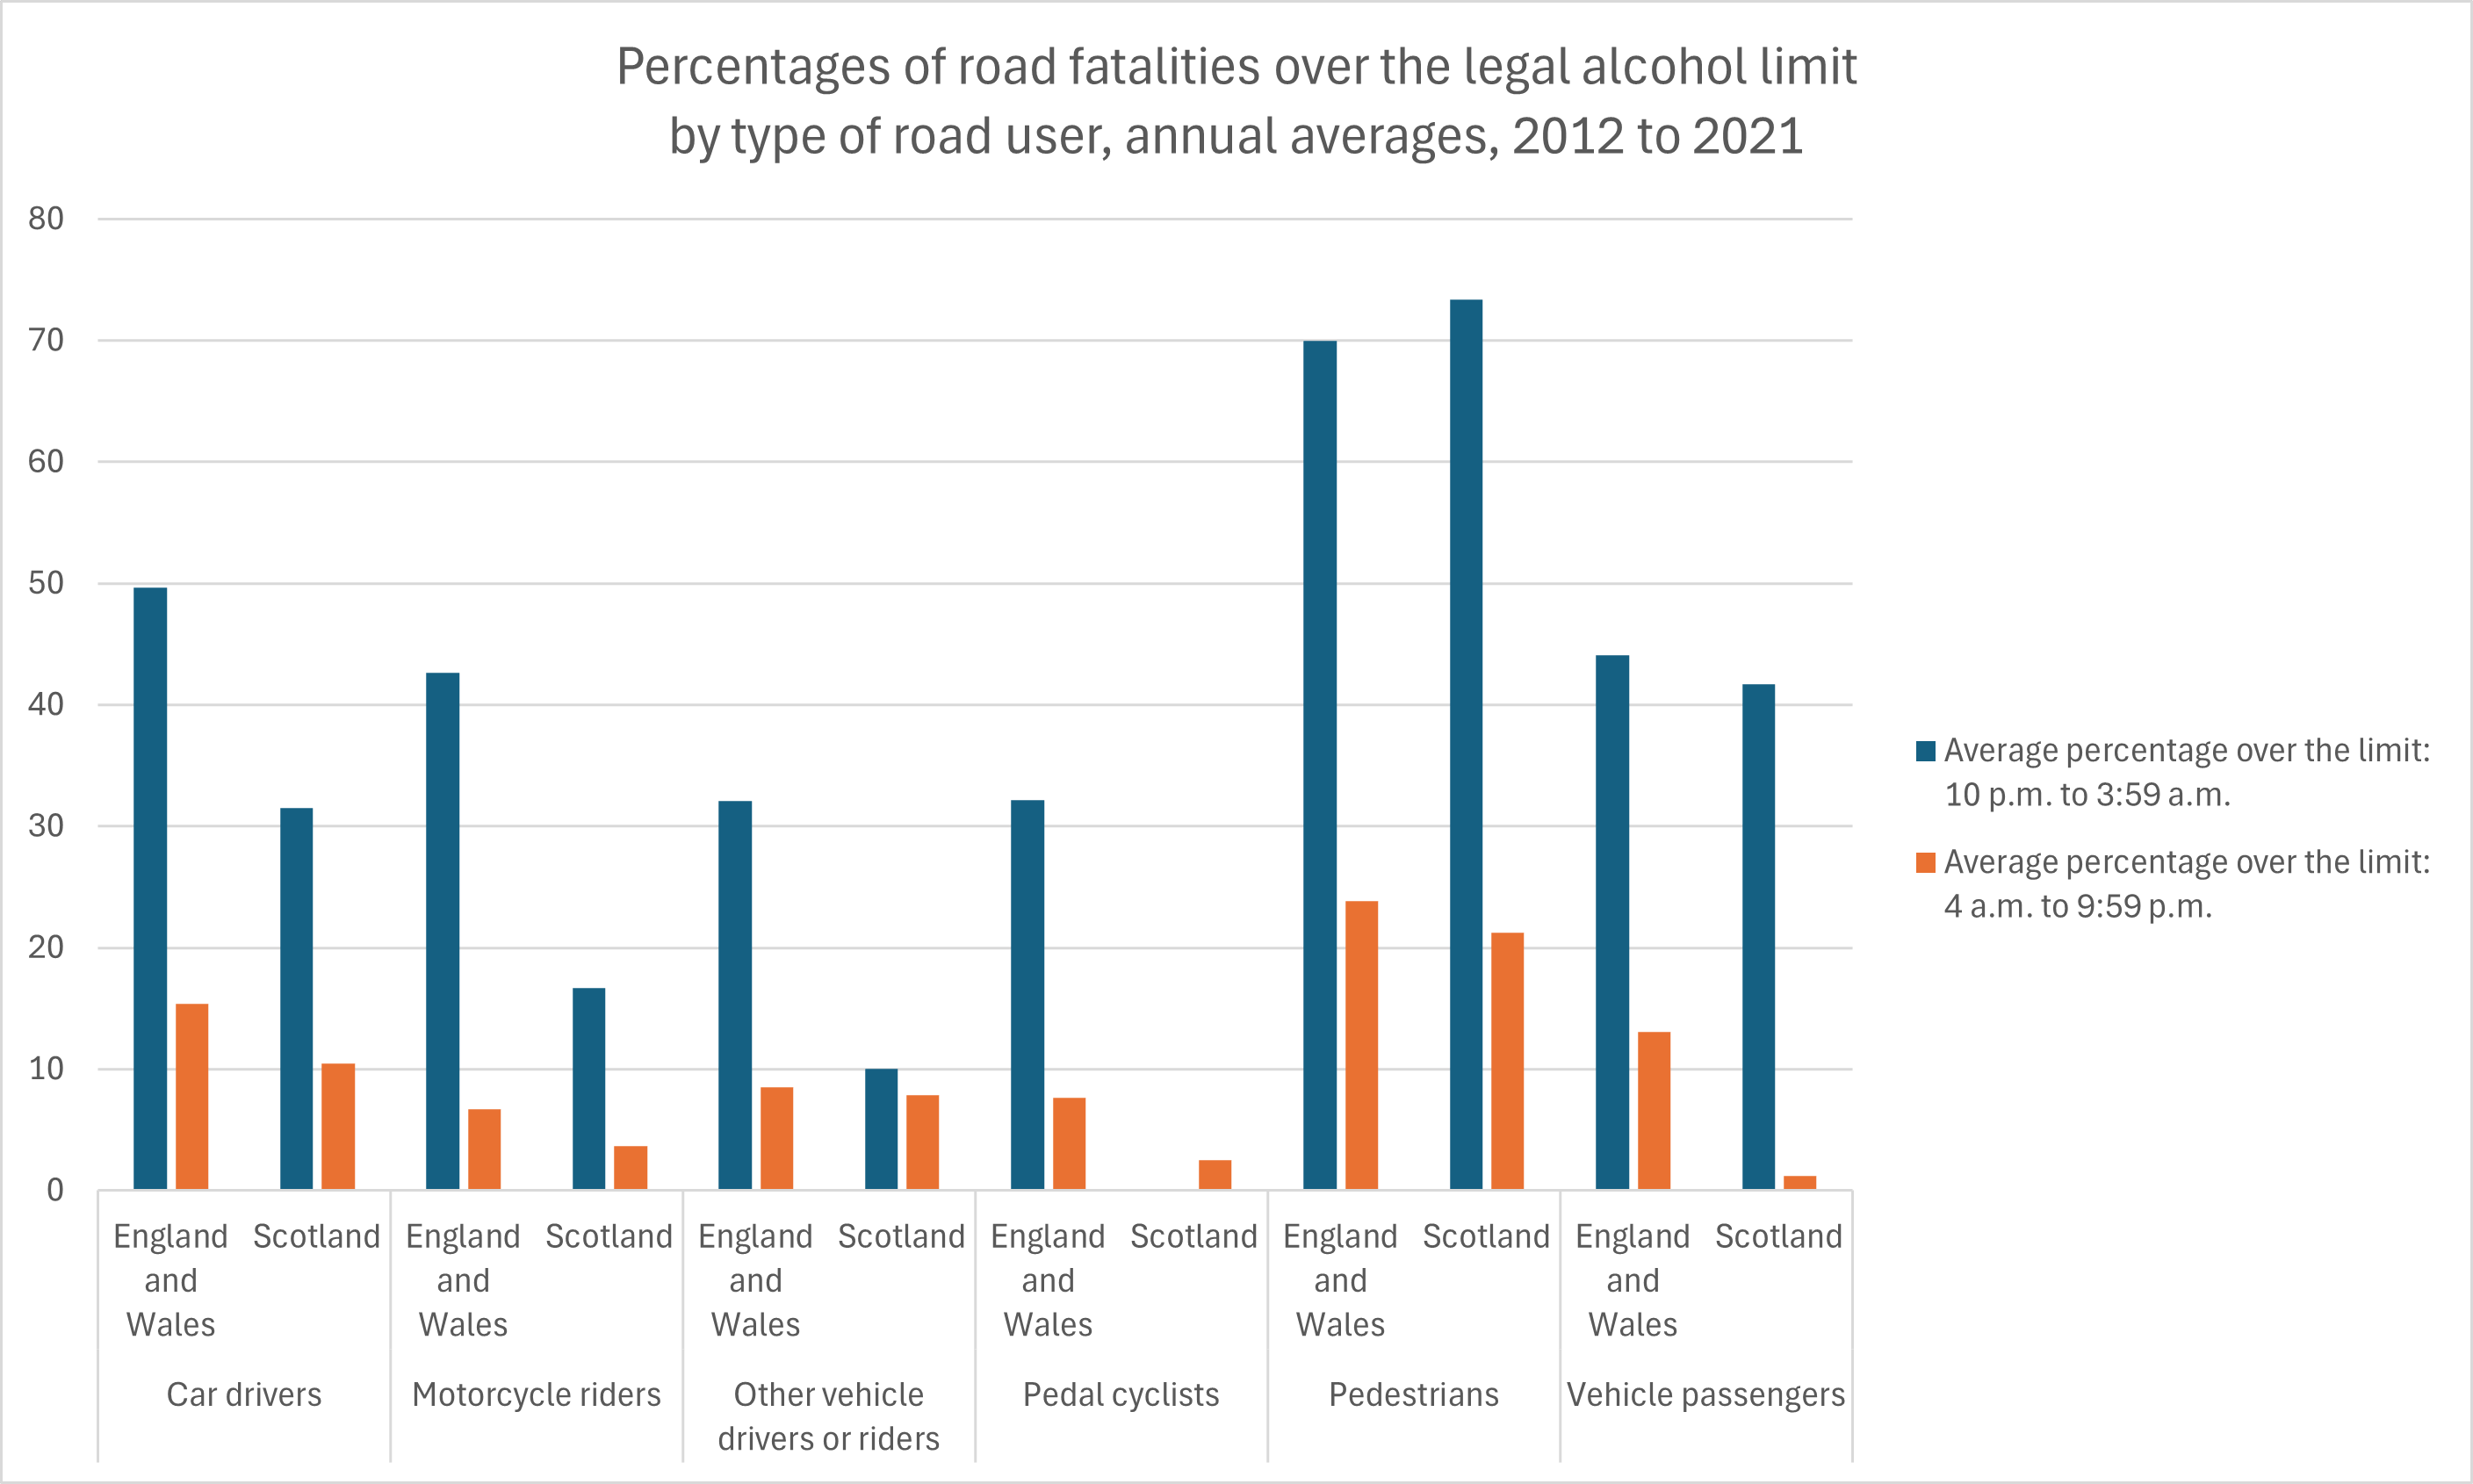
- In some collisions in which alcohol impairment was a contributory factor, it wasn’t always the driver who was over the legal alcohol limit. In the period 2012 to 2021, of persons killed in collisions in England and Wales between 10 p.m. and 3:59 a.m., an average of 32.2% of the pedal cyclists and 69.9% of the pedestrians were over the legal limit each year. Of persons killed in Scotland during those years, an average of 73% of the pedestrians were over the legal limit each year. (The Scotland figure is rounded to two significant figures because of the relatively small sample size obtained from Scotland.) In fact, among road fatalities, the percentage of pedestrians over the legal alcohol limit exceeded the percentage of car drivers over the legal alcohol limit. See the following chart. (Department for Transport, July 2023)
- In Great Britain from 2012 to 2021, drunk male drivers were involved in far more damage and casualties than drunk female drivers. Male drivers over the drink-drive limit were involved in 89.7% of the fatal collisions, 82.3% of the serious collisions, 90.1% of the fatalities, and 83.0% of the serious injuries. Female drivers over the drink-drive limit were involved in 10.3%, 17.7%, 9.9%, and 17.0% respectively. See the following chart. (Department for Transport, July 2023)
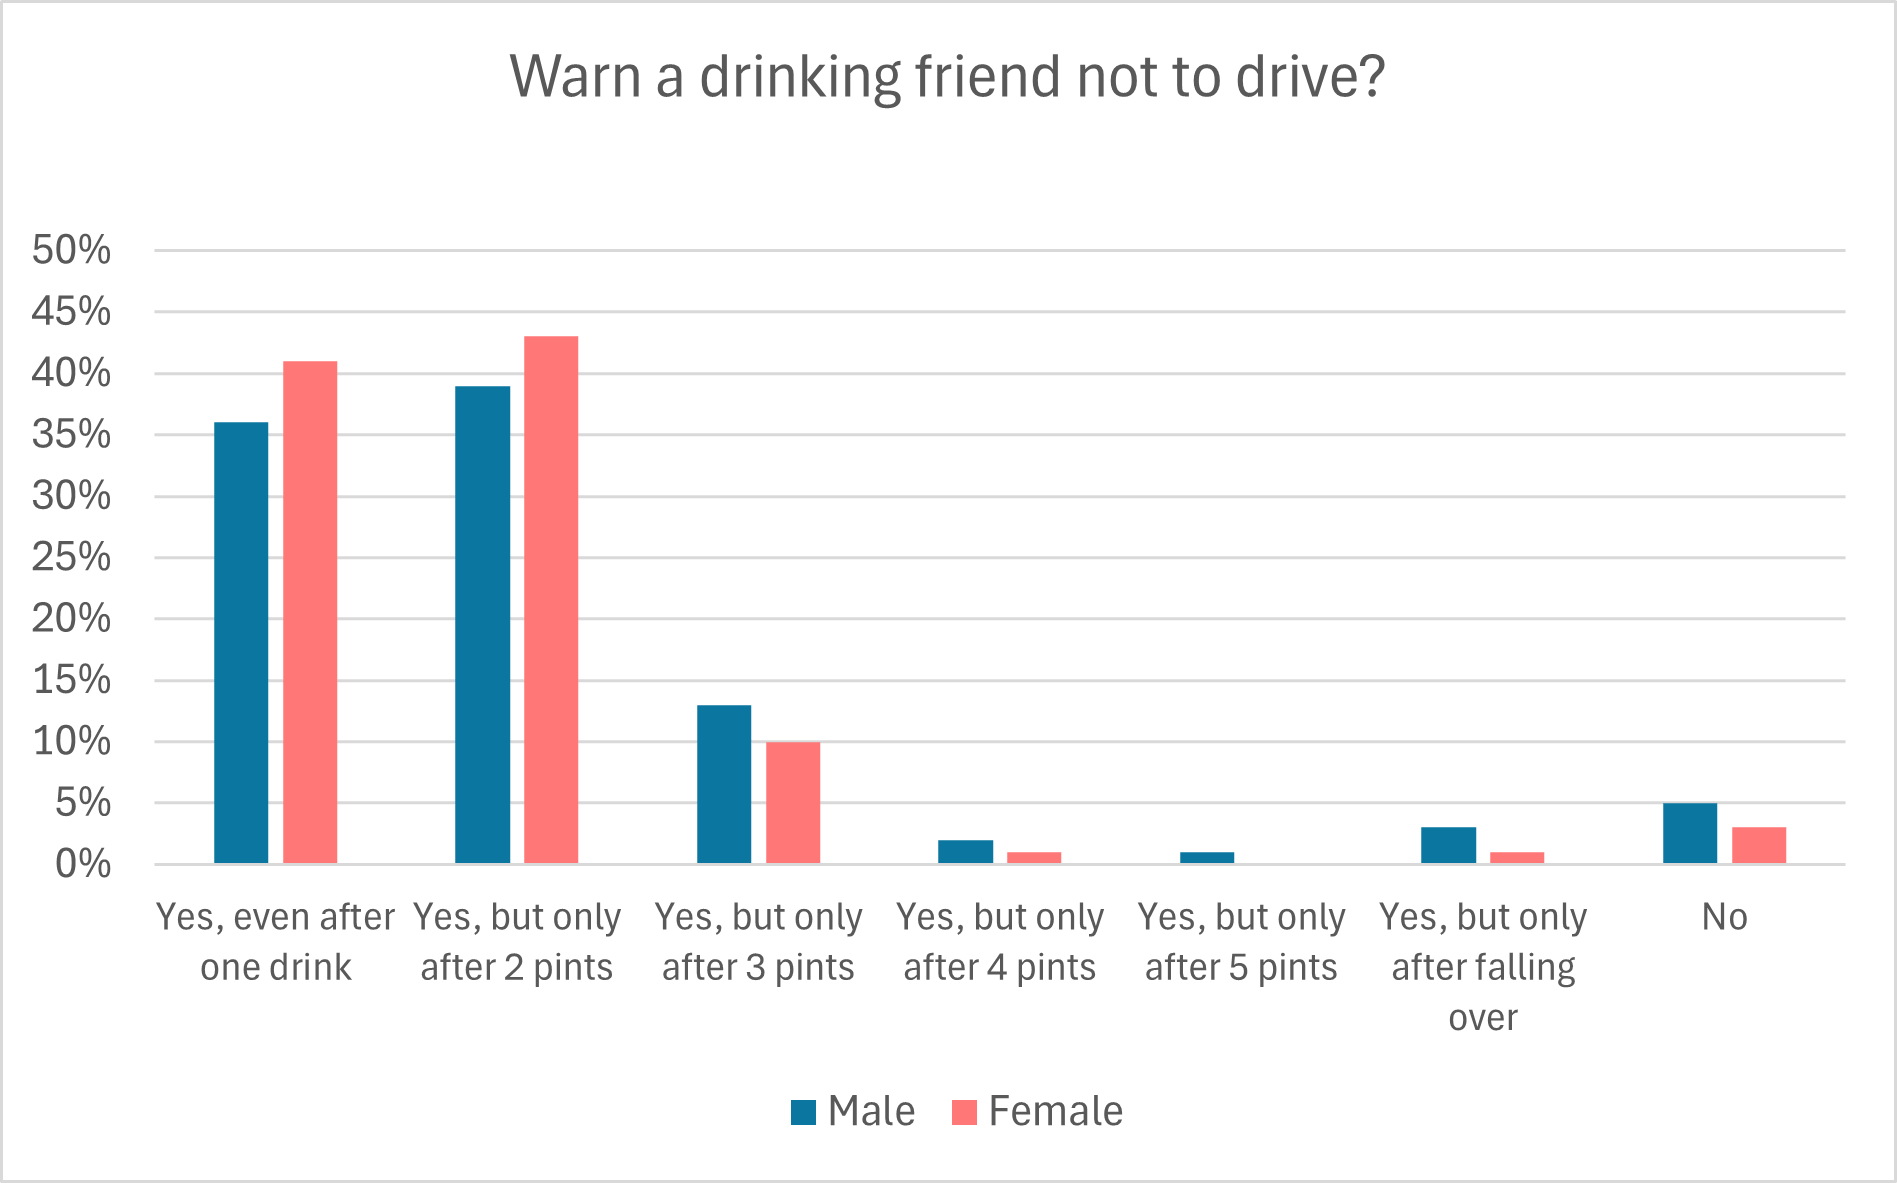
- In a survey of 1,000 drivers and riders conducted in 2013–2014, nearly all of them responded that they would warn a friend who was drinking not to drive – but perhaps not right away. Only 36% of men and 41% of women would warn the friend after he or she had consumed just one drink. 19% of men and 12% of women would not warn the friend until after he or she had consumed three or more pints or was so drunk as to be falling over. Generally, female drivers were more likely than male drivers to speak up if a friend was intending to drink and drive. See the following chart. (Brake, 2013–2014)
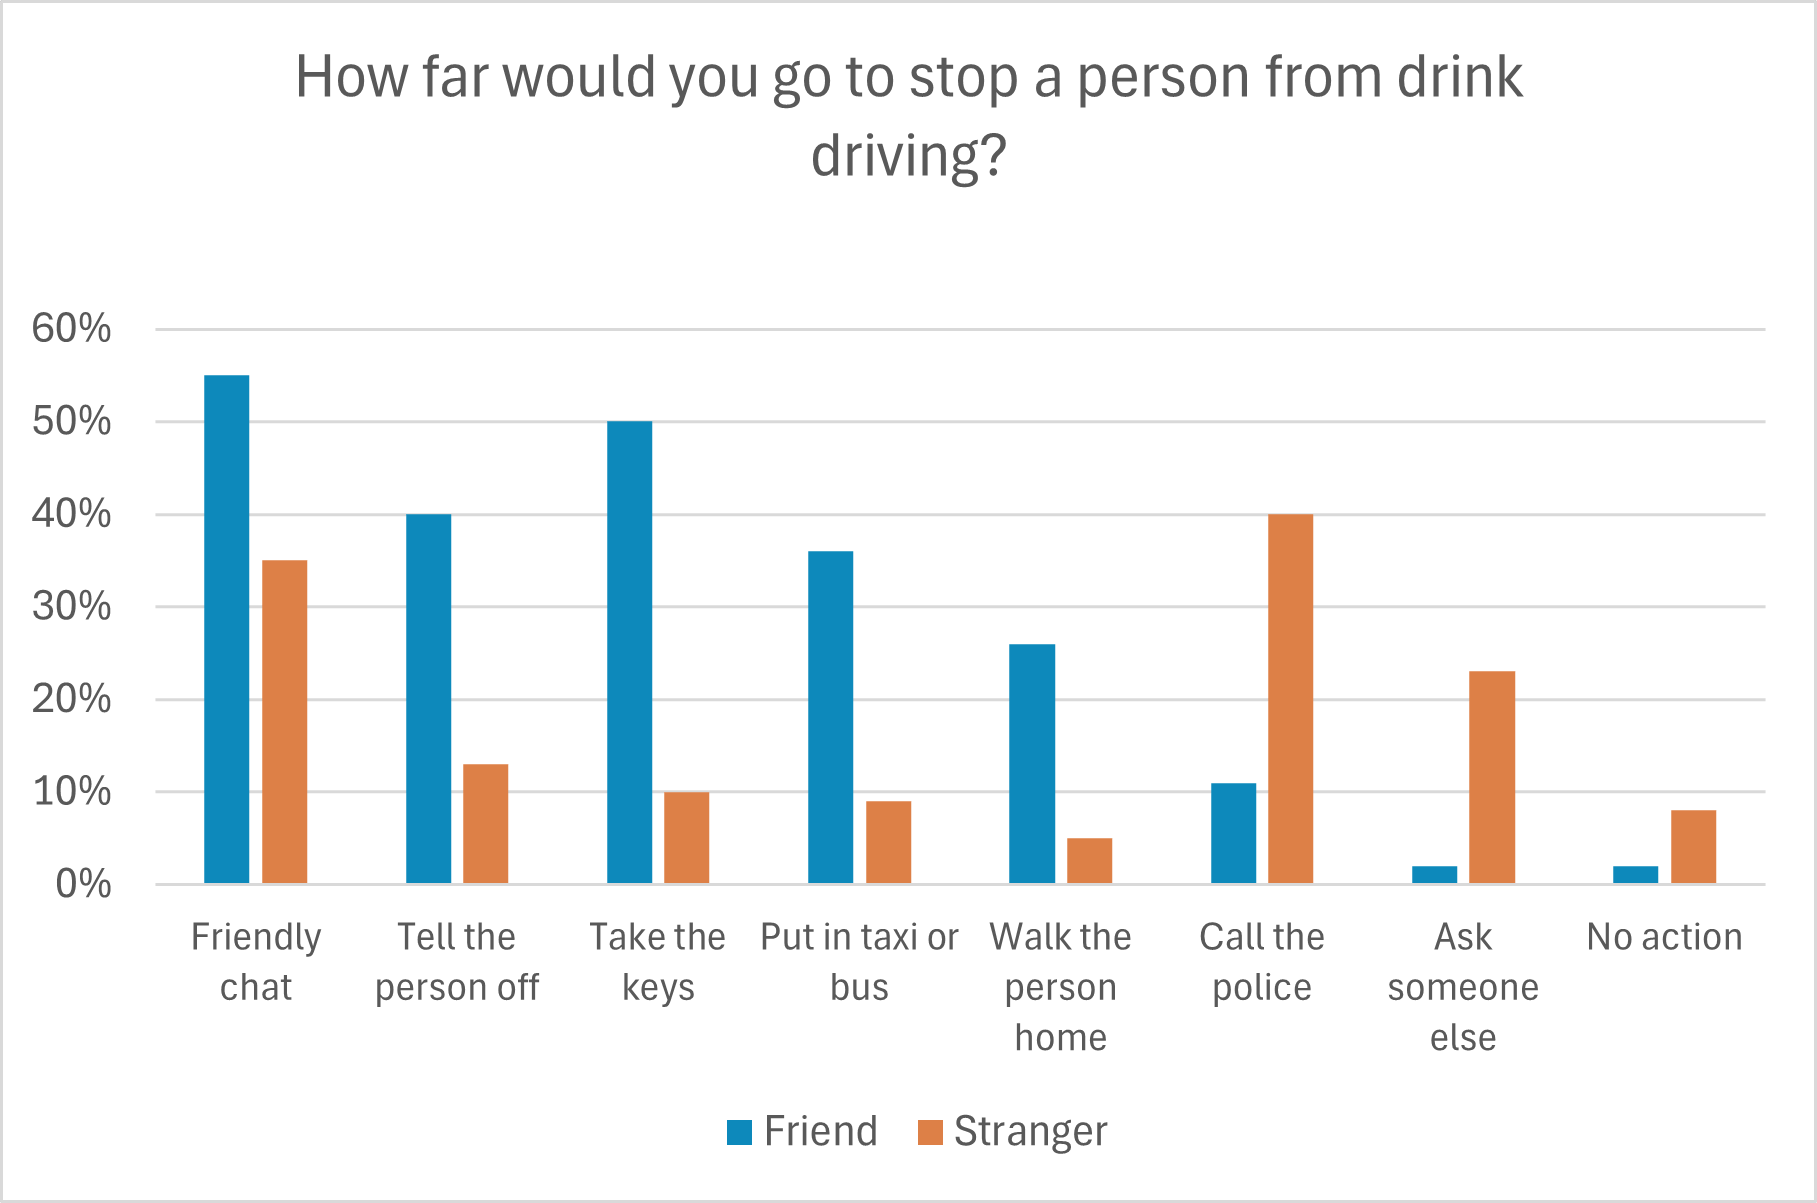
- Next, that same survey asked respondents how far they would personally go to stop someone from drink driving. There were significant differences depending on whether the drinking person was a friend or a stranger. Respondents were more likely to talk with the person, take the person’s keys, or find the person another way home if the person was a friend. Respondents were more likely to call the police or ask someone else to do something if the person was a stranger. See the following chart. (Brake, 2013–2014)
- As part of the Office of National Statistics (ONS) Crime Survey for England and Wales in 2019–2020, drivers residing in England and Wales were asked if they had ever driven during the past 12 months when they believed they were over the legal alcohol limit. 5.0% of the drivers surveyed answered in the affirmative. 0.1% of drivers admitted to doing so every day or almost every day. 0.2% admitted to doing so a few times a week. 0.5% admitted to drink driving once or twice a week. 0.8% admitted to drink driving once or twice a month. These figures were little changed from when this question was asked before, in 2018–2019. (ONS Crime Survey for England and Wales, September 2020)
Related to Drugs
- In 2010, it was estimated that some 200 people were being killed on Britain’s roads each year by drivers on drugs. (Department for Transport, 2010)
- In 2013 and 2022, the numbers of road fatalities in Great Britain in which an officer listed chemical impairment as a contributory factor were as follows:
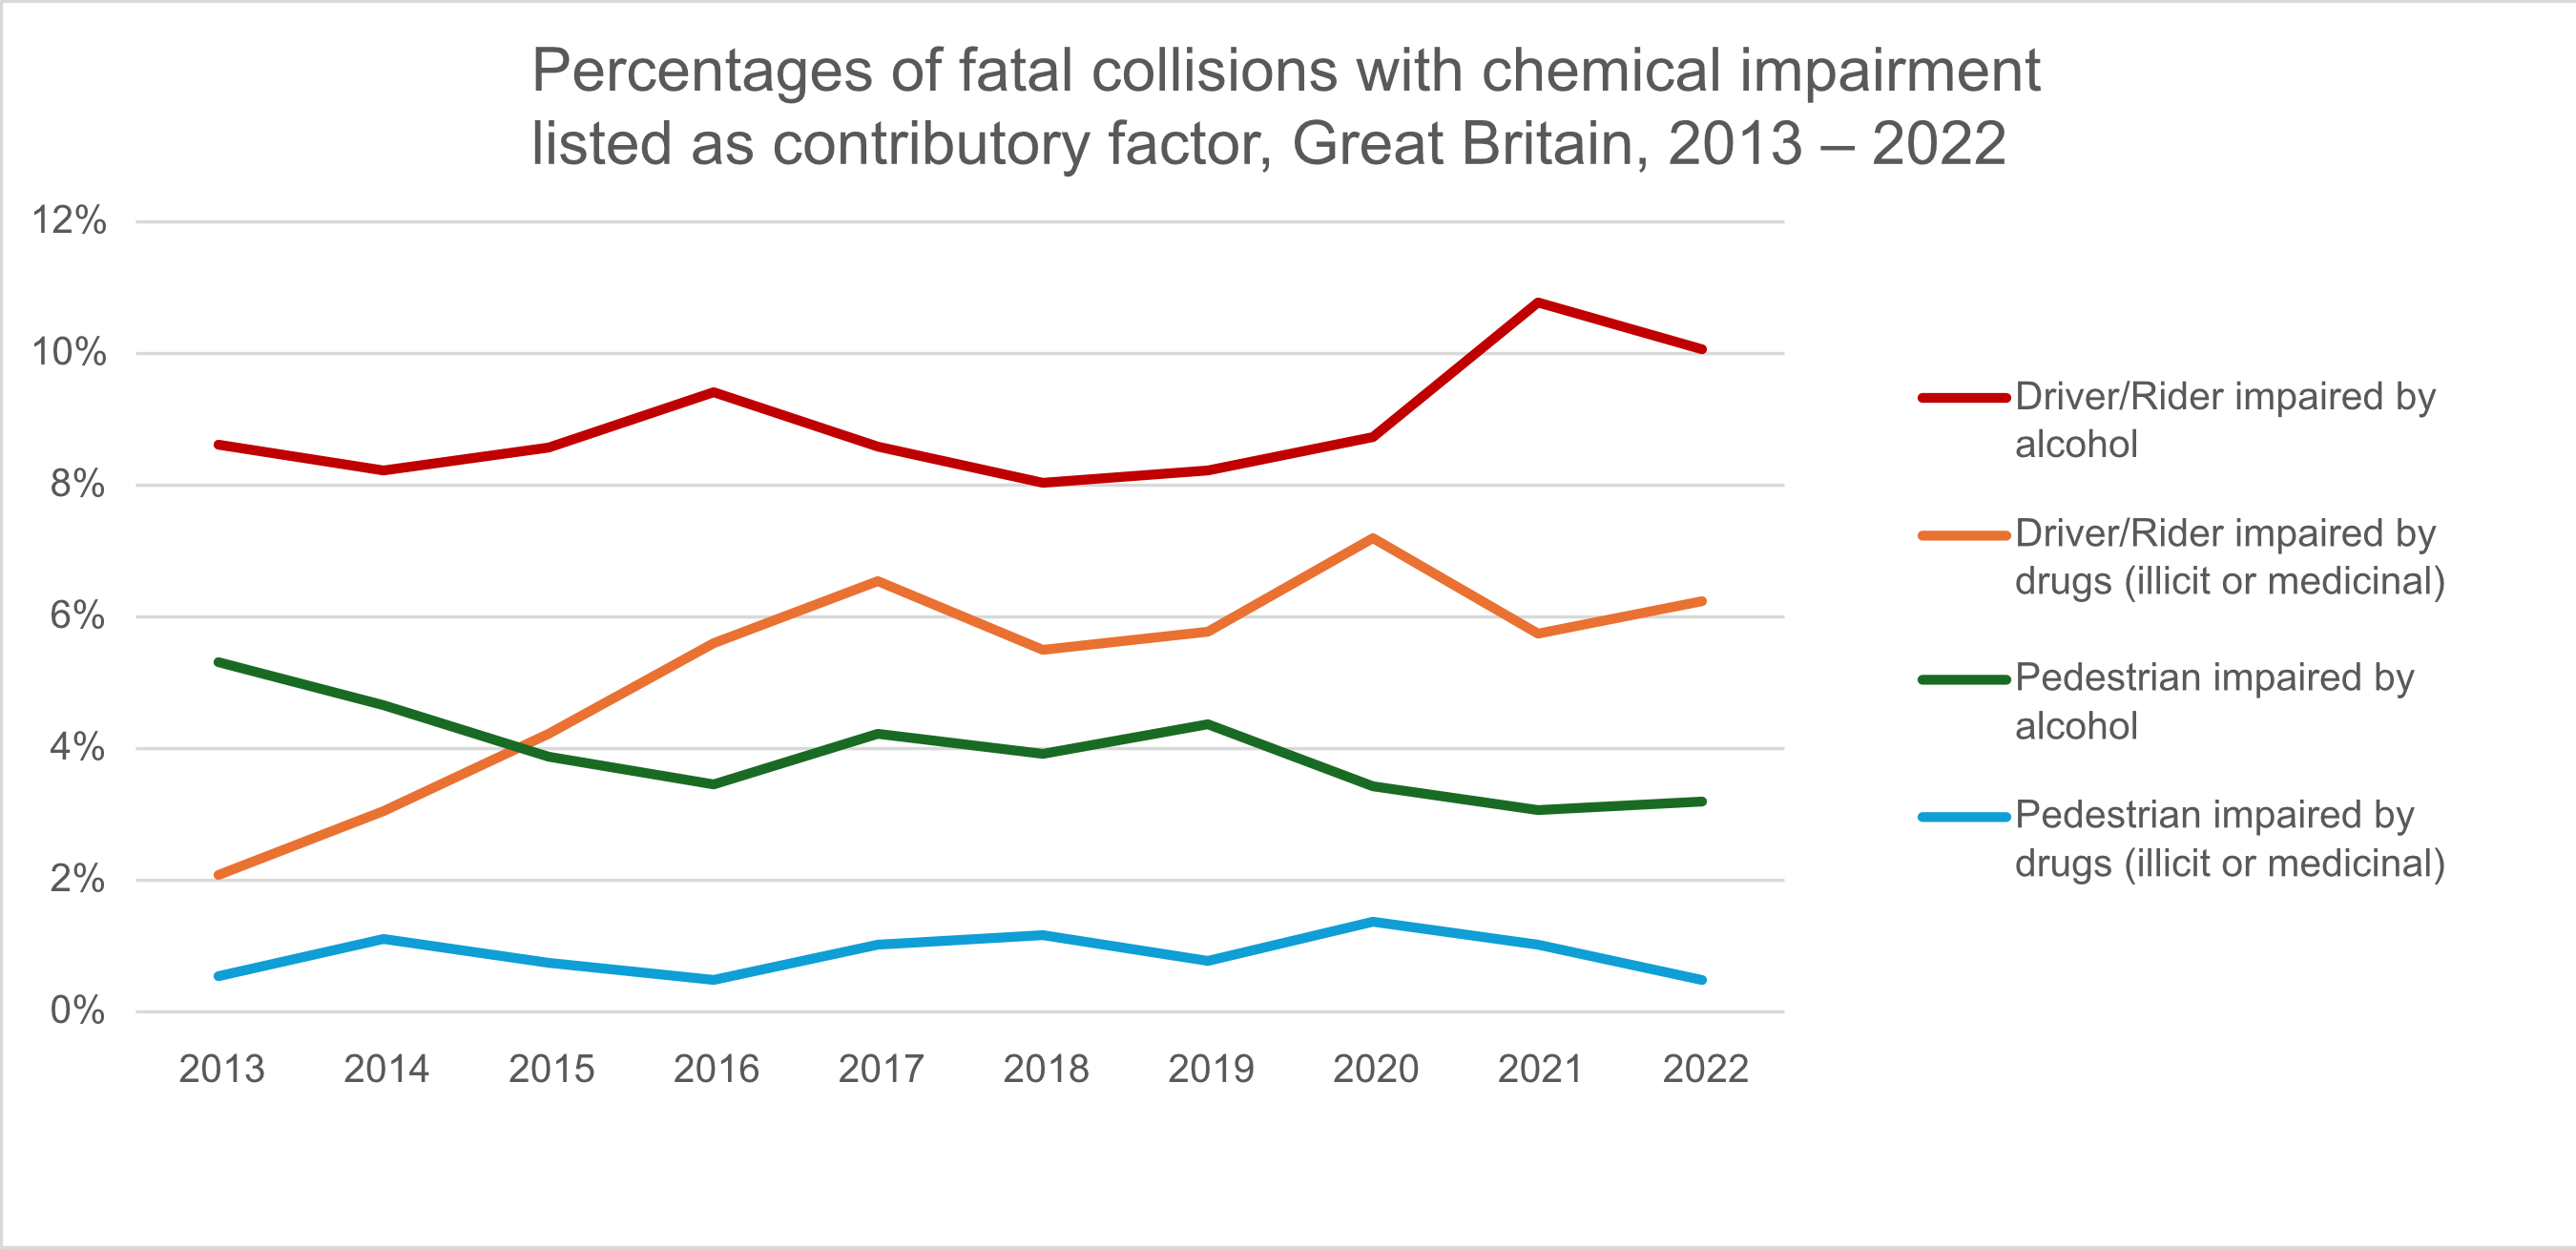
- From 2013 to about 2017, the percentage of fatal collisions in Great Britain in which officers listed ‘driver/rider impaired by drugs’ as a contributory factor increased sharply, but from 2017 to 2022, the rate of increase slowed. On the other hand, the percentage of fatal collisions with ‘driver/rider impaired by alcohol’ as a contributory factor continued to rise, reaching a new high in 2021 during the COVID pandemic. During this period, the percentage of collisions with ‘pedestrian impaired by drugs’ stayed roughly the same, but the percentage of collisions with ‘pedestrian impaired by alcohol’ declined. See the following chart. (Department for Transport, September 2023)
- A survey of 1,000 drivers conducted in 2016 found that 7% of the drivers admitted to drug driving at least once within the past year. 3% of the drivers admitted to drug driving once a week or more. 8% of drivers said they had been passengers in vehicles operated by drivers who had taken drugs and might still have been impaired by them. Finally, the drivers were asked whether they would still accept a ride from a designated driver if they found out that the designated driver had taken drugs. 13% of drivers answered in the affirmative. (Brake, 2016)
- In a survey of 1,000 drivers and riders conducted in 2013–2014, 2% of them admitted to having driven within the past year after using cannabis, 1% admitted to having driven after using cocaine, and 3% admitted to having driven after using other illegal drugs. They were then asked what they would do if a close friend was intending to drive after using illegal drugs. 71% said they would speak up about it. However, 24% said they would speak up about it only if their friend appeared obviously drug-impaired, and 5% said they would not speak up at all. (Brake, 2013–2014)
- In this same survey, 11% of drivers and riders admitted to driving within the past year after taking prescription or over-the-counter medications that warn you not to drive. 6% admitted to doing so once a month or more. 7% said they were unsure whether they had taken such medications because they didn’t always check the warnings. (Brake, 2013–2014)
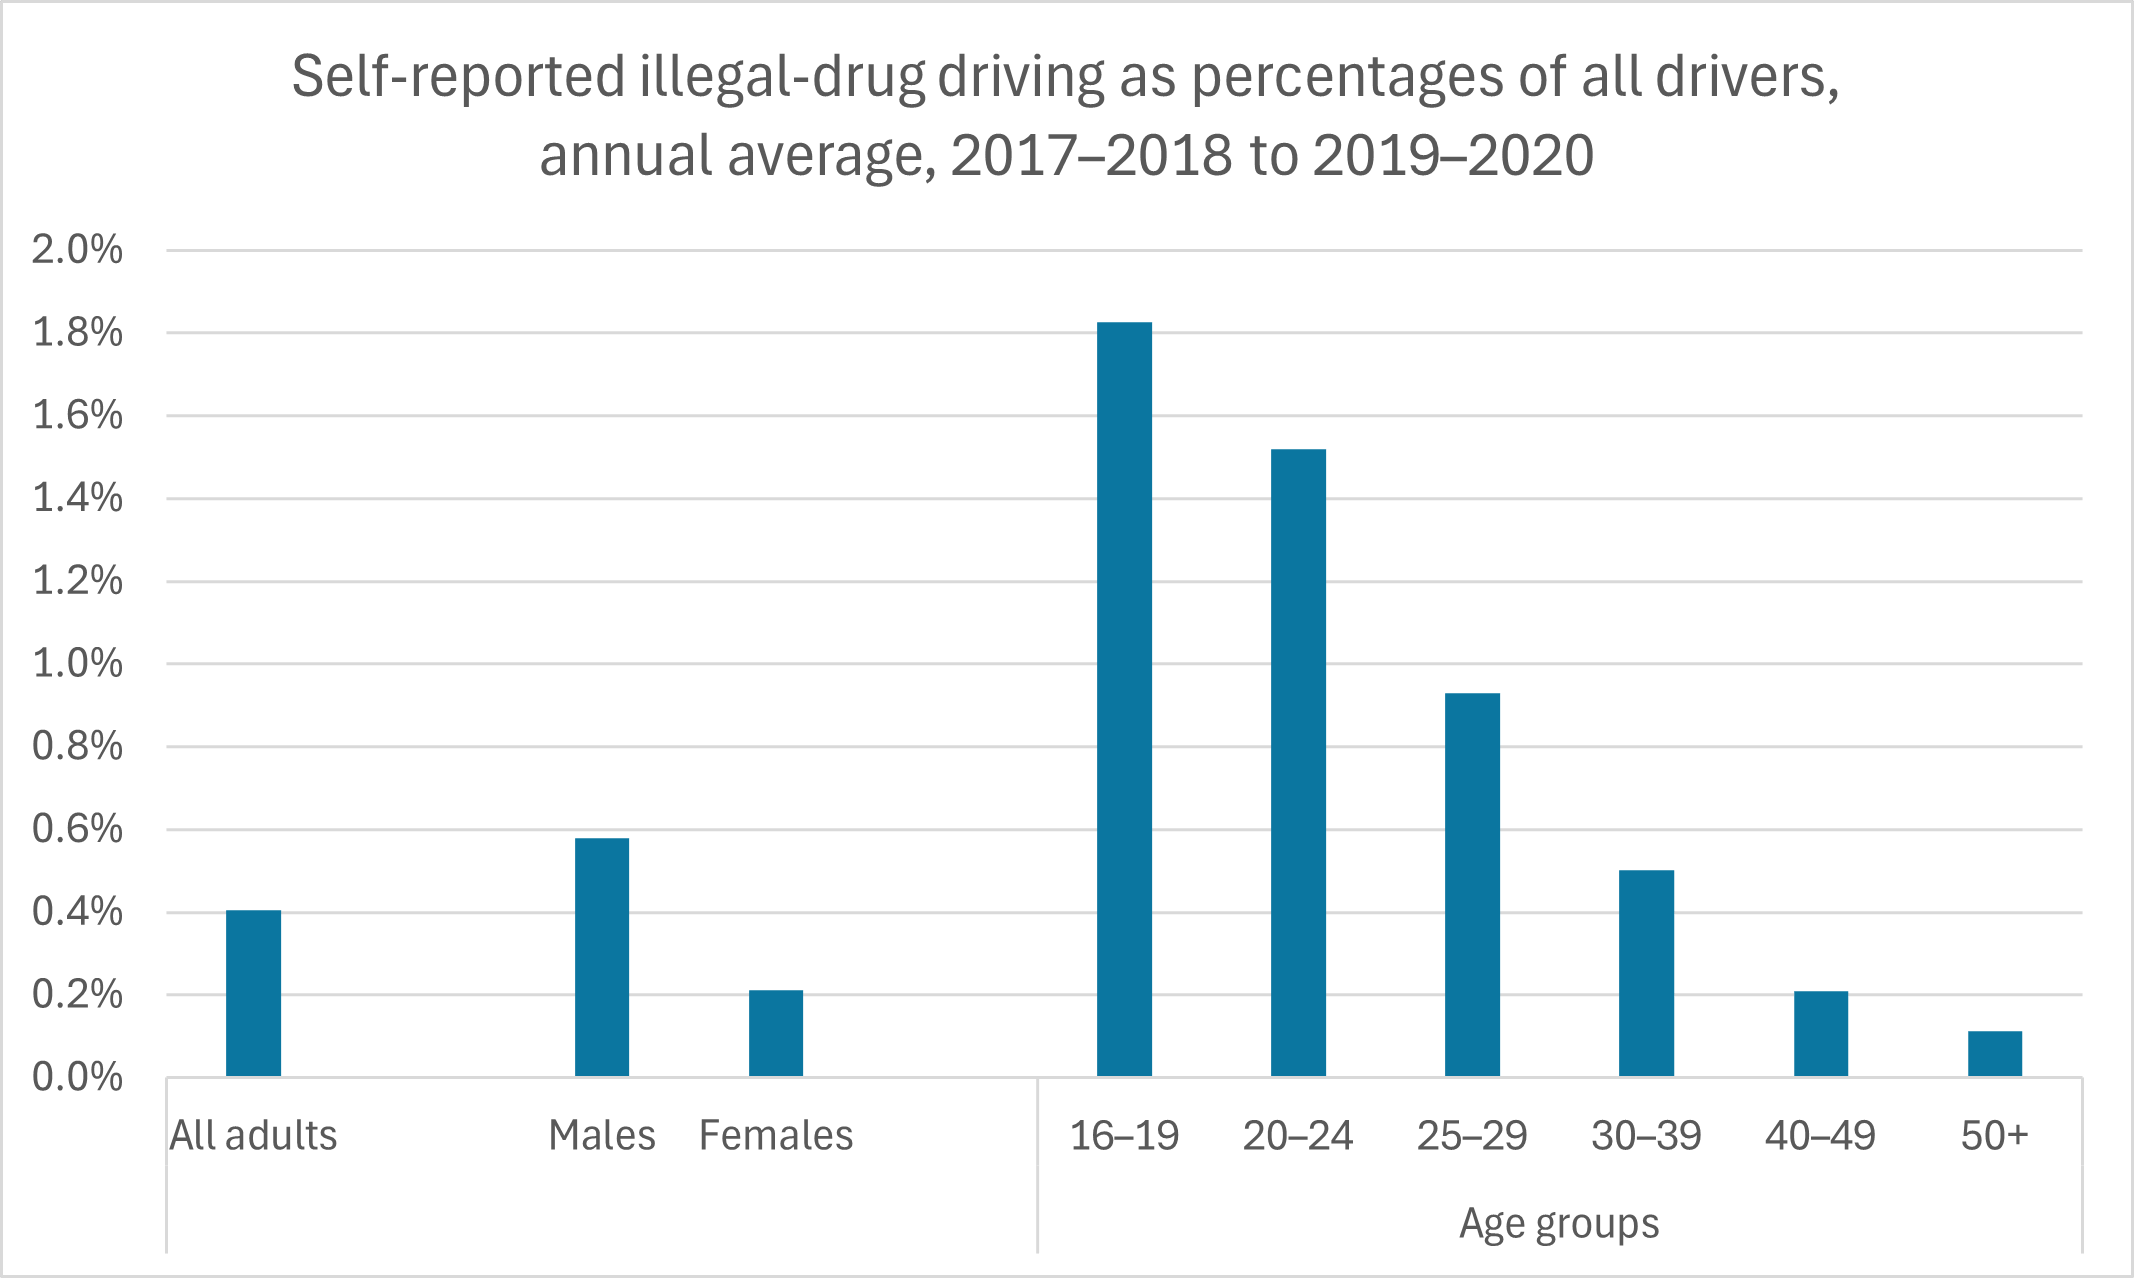
- In 2019–2020, the Crime Survey for England and Wales (CSEW) found that 0.4% of the drivers surveyed admitted to driving while thinking they were under the influence of illegal drugs at least once in the previous 12 months. From 2016–2017 to 2019–2020, the annual average percentage of drivers who self-reported driving under the influence of drugs was 0.4%. Drug driving skewed towards young males. See the following chart. (Department for Transport, September 2019)
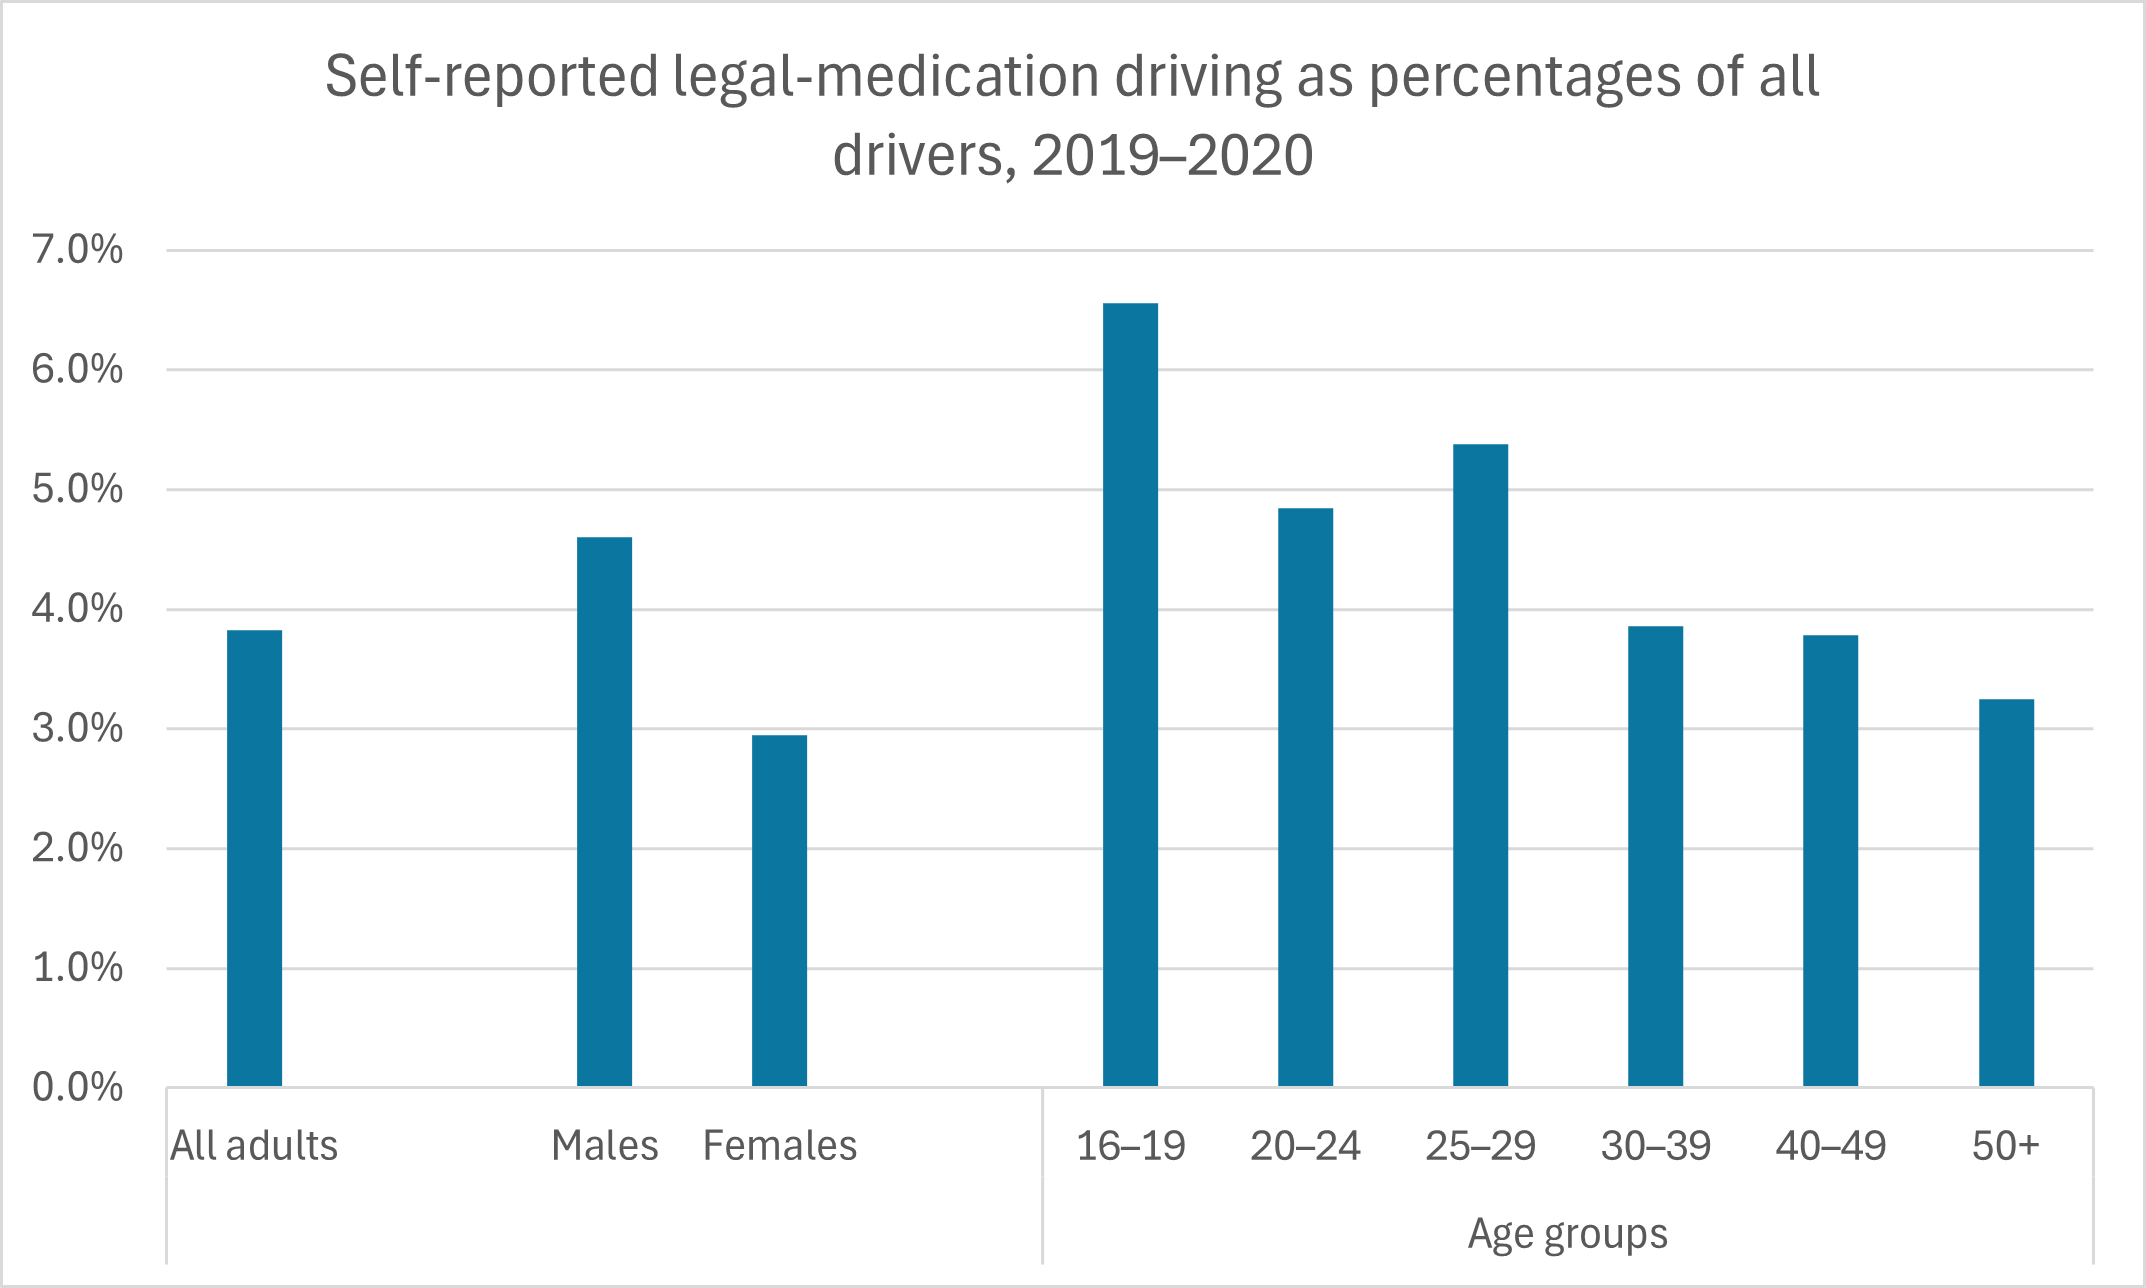
- CSEW found a similar pattern with legal medications in 2019–2020. CSEW asked drivers if they had driven in the past 12 months after taking legal medications even though they had been advised not to drive after taking these medications. 0.4% of drivers admitted to doing so. With legal medications too, drug driving skewed towards young males. See the following chart. (Department for Transport, September 2019)
- A study conducted in 2000 by the Transport Research Laboratory found that 5.2% of drivers and 4.1% of motorcyclists killed in road crashes had traces of legal medications that could have affected their driving. (Brake, 2013–2014)
- It is more dangerous to drive on amphetamines than to drive on cannabis. Your chance of a fatal or serious injury crash doubles when driving on cannabis (although your chance is 16 times greater when driving on both cannabis and alcohol). Your chance of a fatal or serious injury crash is 2 to 10 times greater when driving on cocaine or opiates, and 5 to 30 times greater when driving on amphetamines. (Brake, February 2024)
- 50 mg of diphenhydramine (a popular over-the-counter antihistamine) can impair your driving more than a blood alcohol content (BAC) of 0.10%. (In England, Wales and Northern Ireland, the legal limit for BAC is 0.08%. In Scotland, the legal limit is 0.05%.) (University of Iowa, 2000)
|
2013 |
2022 |
|
|---|---|---|
| Driver/Rider impaired by alcohol |
138 |
160 |
| Driver/Rider impaired by drugs (illicit or medicinal) |
36 |
97 |
| Pedestrian impaired by alcohol |
80 |
46 |
| Pedestrian impaired by drugs (illicit or medicinal) |
8 |
7 |
Evidently, many of these drivers didn’t realize how many different legal medications could affect their driving. Most drivers knew that some painkillers, some allergy medications and some cough medicines could affect their driving. However, only 21% of male drivers and 27% of female drivers knew that certain diet pills could affect their driving, and only 19% of male drivers and 20% of female drivers knew that certain medications for treating heartburn or indigestion could affect their driving. Generally, female drivers were more aware of how many medications could affect their driving than male drivers were. See the following chart. (Brake, 2013–2014)
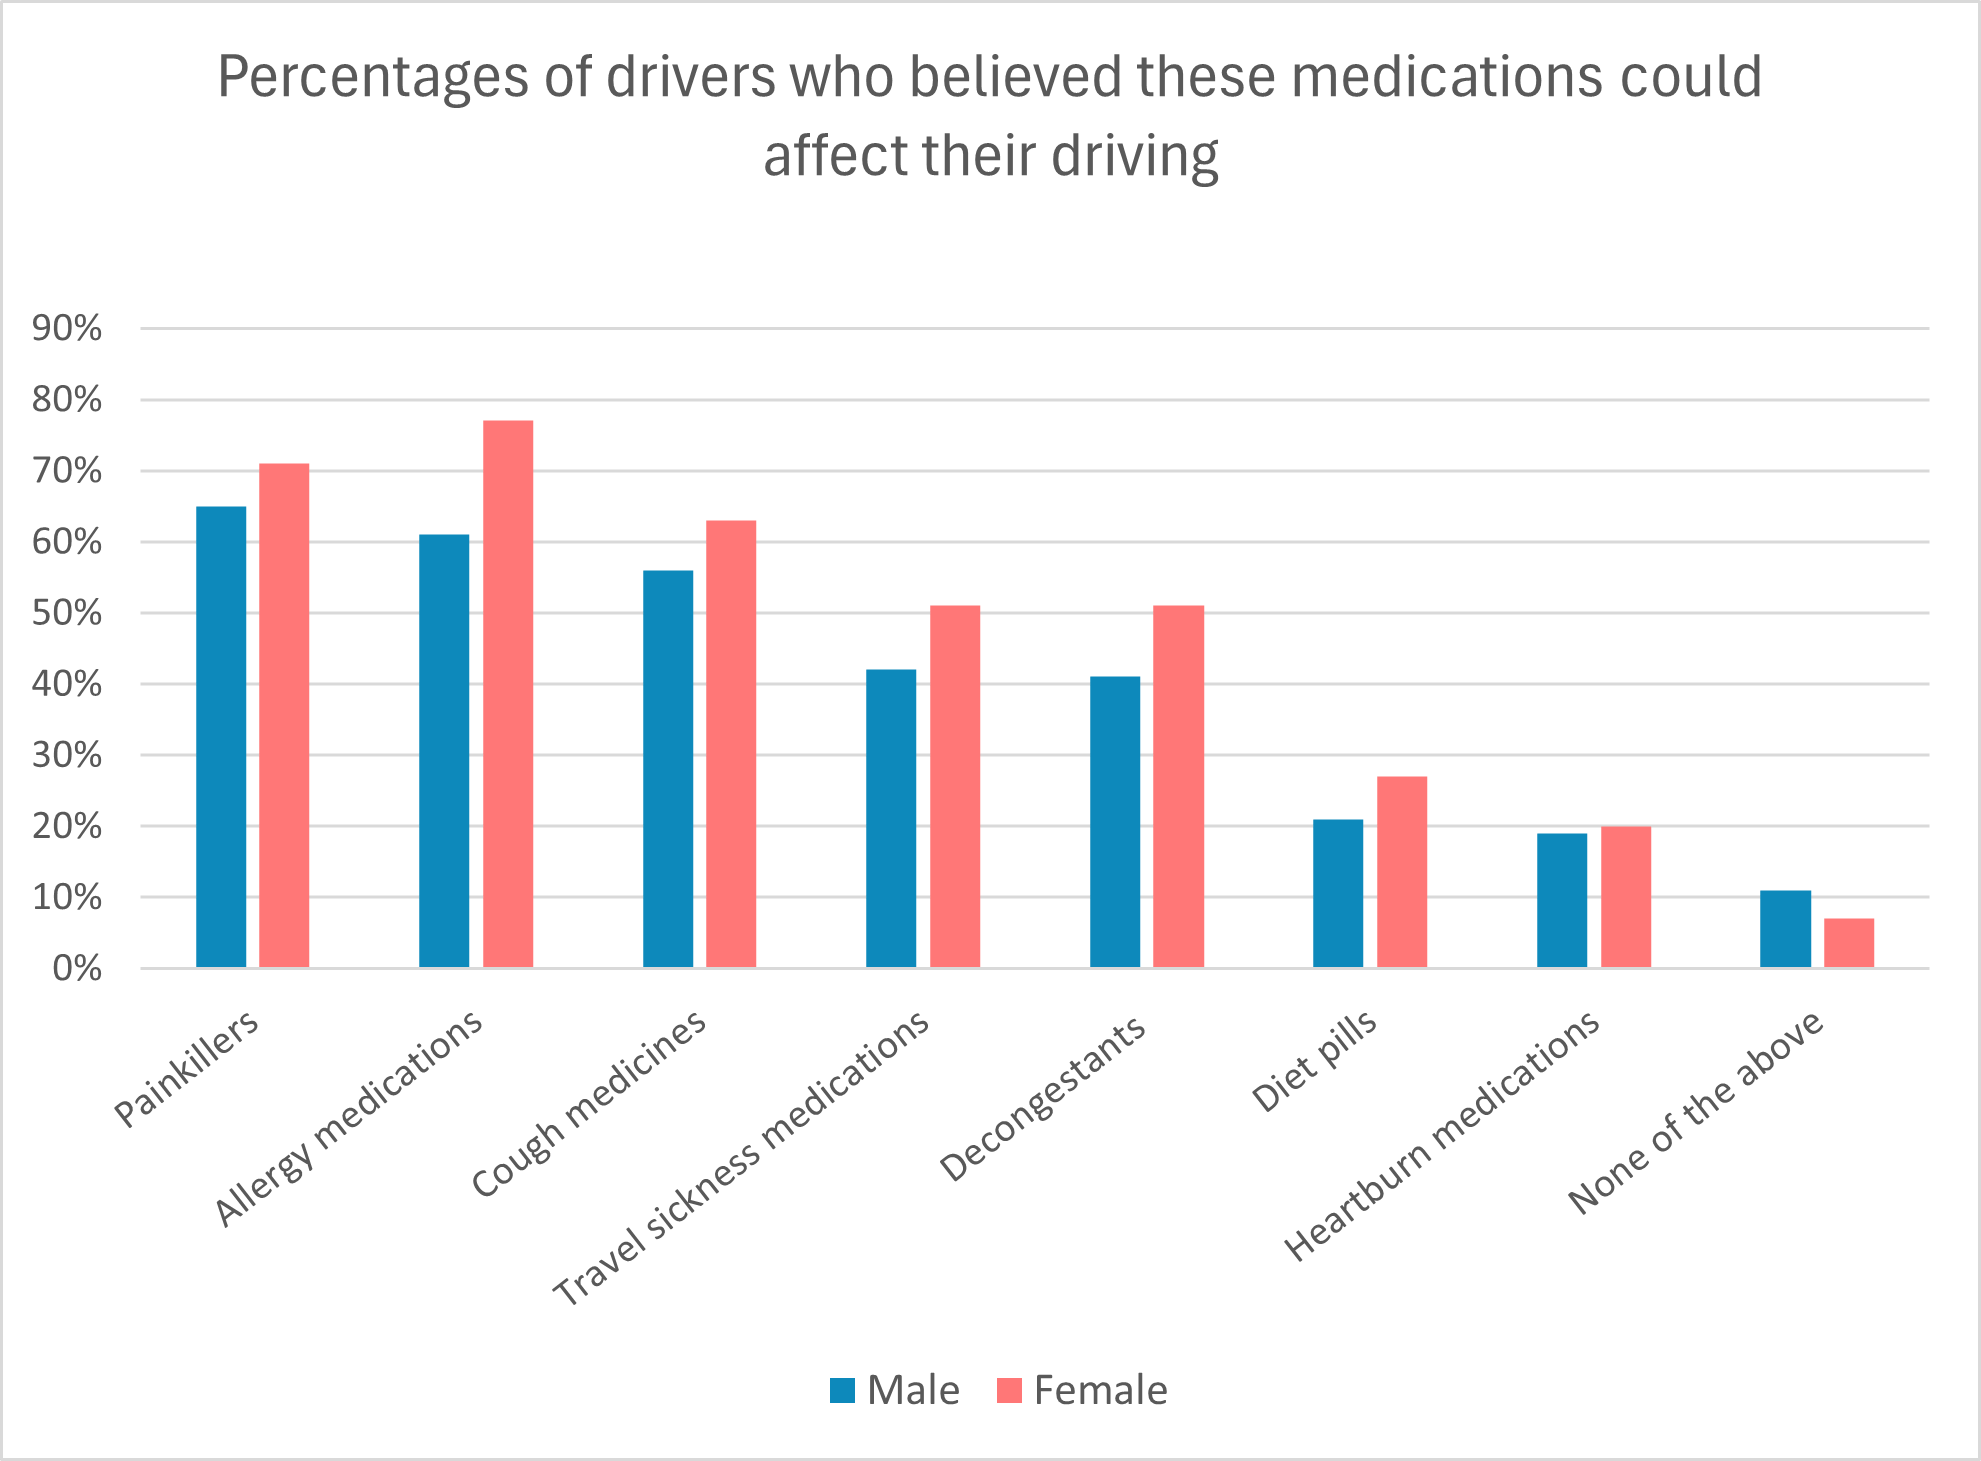
Finally, as can be seen from the chart, 11% of male drivers and 7% of female drivers didn’t believe that any of these medications could affect their driving. (According to the NHS, some medications in each of the categories shown on the chart can affect one’s driving.) (Brake, 2013–2014)
Related to Fatigue
- According to data from Australia, England, Finland and other European nations, driver tiredness is responsible for 10–30% of all crashes.
- A study published by the Parliamentary Advisory Council for Transport Safety in 2016 estimated that up to a quarter of fatal accidents are caused by drivers who have fallen asleep at the wheel.
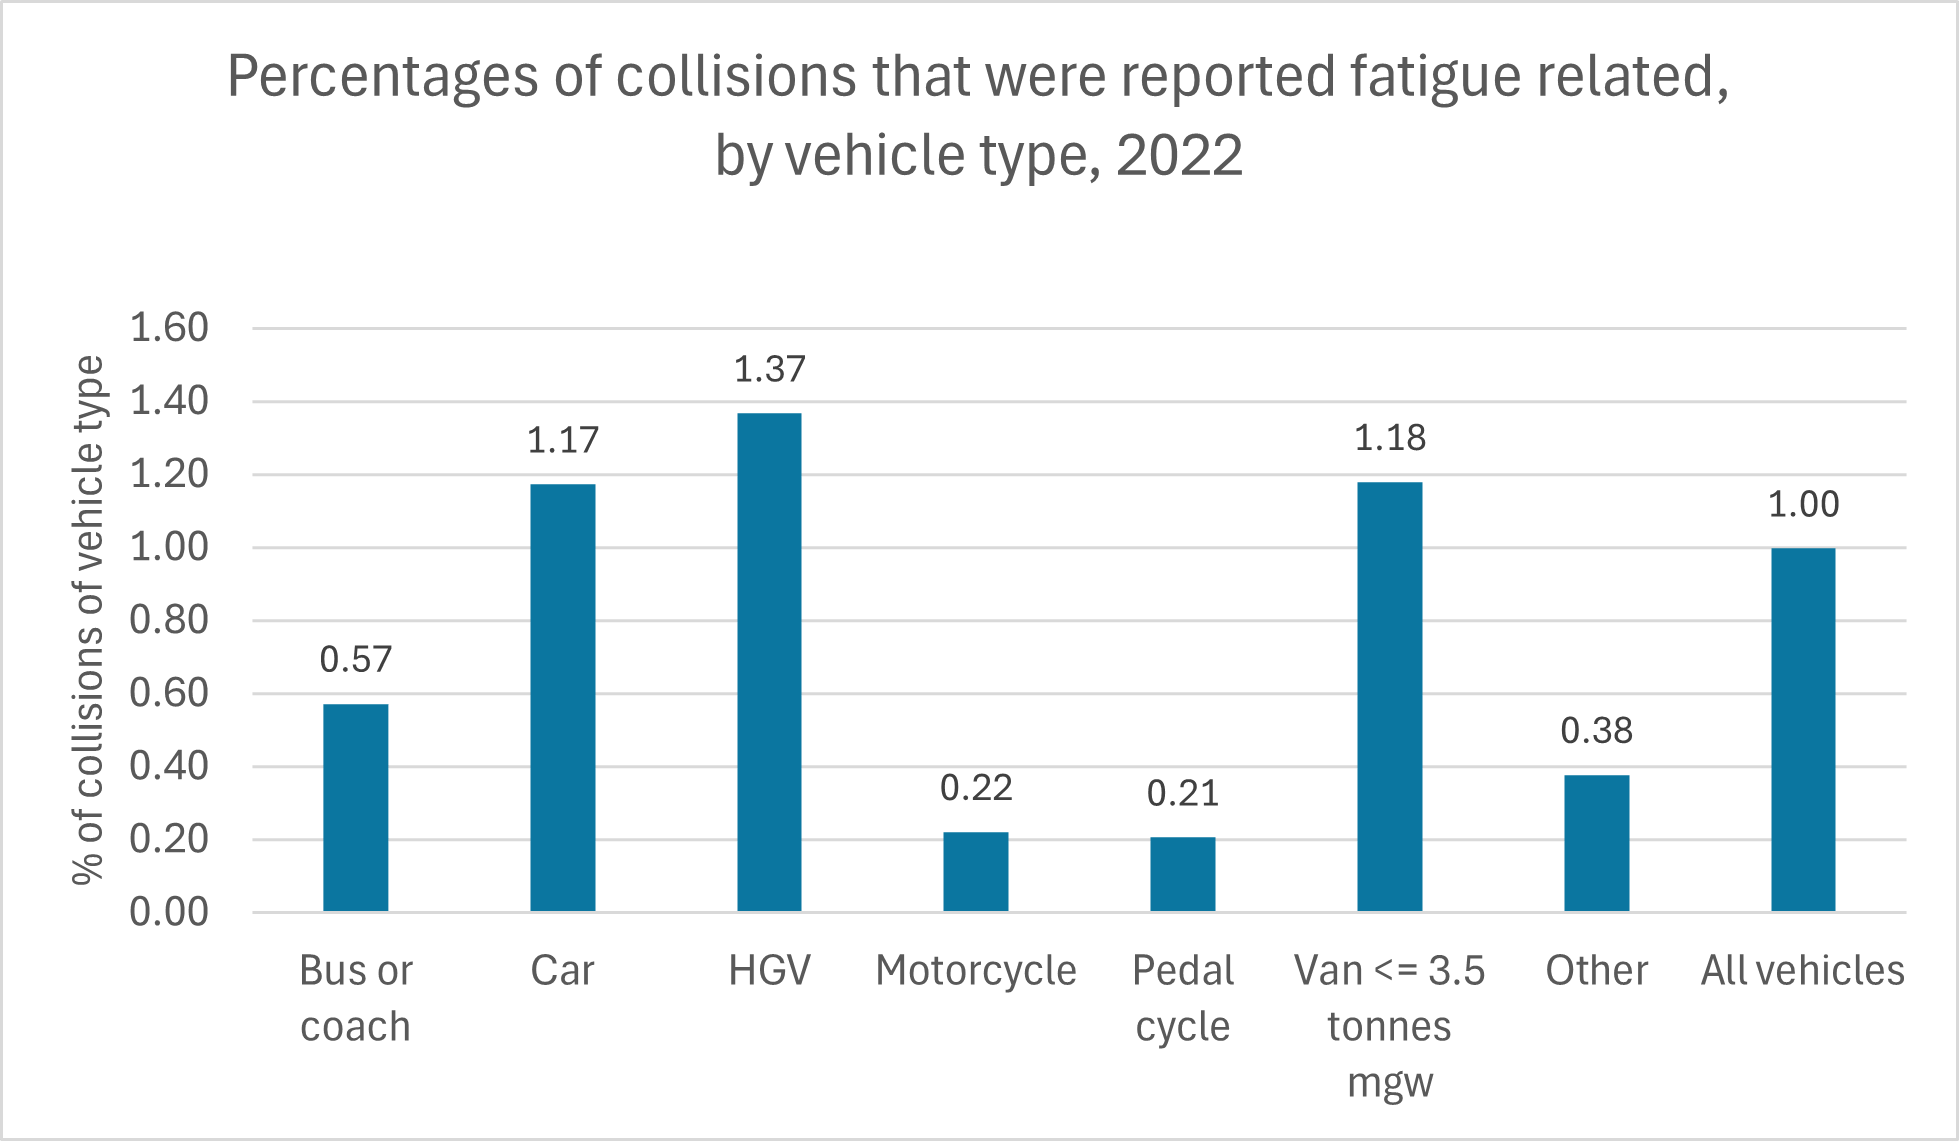
- In Great Britain in 2022, fatigue was reported as a contributory factor in 1,295 vehicle collisions, including 1,090 car collisions (1.2% of all car collisions that year) and 38 heavy-goods vehicle (HGV) collisions (1.4% of all HGV collisions that year). Fatigue was reported as a contributory factor in about 4% of all road fatalities. See the following chart. However, some authorities believe that the true figures are much higher than the official police statistics: as many as 10–20% of road crashes worldwide may be fatigue related. Police cannot easily determine how much sleep a driver had the night before, and there is no test to determine whether someone who was killed had been fatigued at the time. (Brake, 2024; Department for Transport, September 2023)
- In 2018, an AA Charitable Trust survey of 20,561 drivers found that 13% of them (17% of male drivers and 5% of female drivers) admitted to having fallen asleep at the wheel. The most common reasons for becoming drowsy while driving were a hard day at work (39%), the monotony of the journey (33%), and driving late at night (27%).
- Rule 91 of the UK Highway Code recommends that drivers and motorcyclists take a break from driving for at least 15 minutes every two hours. However, the results of a survey of 1,000 drivers and riders conducted in 2013–2014 suggest that many are not following this basic advice. Only 45% of these respondents said that they would stop for a rest break at least every two hours. 9% of these respondents said that they wouldn’t stop for a break at all unless they absolutely had to. (Brake, 2013–2014)
When asked what they do if they felt drowsy while driving, 8% responded that they mostly try to push through the tiredness (by turning on the radio or some other method) rather than stop, and 2% responded that they always try to push through the tiredness rather than stop. (Brake, 2013–2014)
- Being awake for 18 hours can impair driving as much as a blood alcohol content (BAC) of 0.05%. Being awake for 24 hours can impair driving as much as a BAC of 0.10%. (In England, Wales and Northern Ireland, the legal limit for BAC is 0.08%. In Scotland, the legal limit is 0.05%.) (National Sleep Foundation, 2018)
- Drivers missing 2–3 hours of sleep in 24 hours more than quadrupled their risk of a crash compared with drivers getting the recommended seven hours of sleep. (AAA Foundation for Traffic Safety, 2016)
- If a driver falls asleep for just four seconds while travelling at a speed of 62 mph (100 km/h), the vehicle will travel 364 feet (111 m) without a driver in control. In comparison, the length of a standard soccer pitch or UK football field is 345 feet (105 m). (Transport Accident Commission, 2018)
- Driving while sleepy can make a driver approximately two-and-a-half times as likely to have a motor vehicle accident. (Sleep, Journal of the Sleep Research Society, 2017)
- Drivers who get only five or six hours of sleep in 24 hours nearly double their risk of a crash. (AAA Foundation for Traffic Safety, 2016)
- With less sleep, consuming alcohol has been shown to be associated with many more “off-road deviations,” indicating that alcohol compounds the effects of fatigue. (Traffic Injury Research Foundation, 2012)
- The common cold can increase a driver’s reaction time about as much as a blood alcohol content (BAC) of 0.08% (which is the legal limit in England, Wales and Northern Ireland). This does not include possible additional driving impairment from medications taken to treat the common cold. (Cardiff University, 2012)
Young Drivers
- Road traffic injuries are currently the leading cause of death for children and young adults aged 5–29 years worldwide. (Tuberculosis is the second most common cause of death, and diarrheal diseases are third.) Road traffic injuries are the 12th leading cause of death for all persons worldwide. (World Health Organization, December 2023)
- Worldwide, 66% of road traffic fatalities occur among persons aged 18 to 59. (World Health Organization, December 2023)
- Worldwide, road crashes are the single greatest cause of death for men aged 15–29, and the second greatest for all persons aged 15–29. (World Health Organization, 2018)
- More than 8,500 young car drivers die in the 30 OECD countries each year. In OECD countries, persons under 25 years of age comprise 10.1% of the population, but drivers under 25 years of age account for 26.7% of driver fatalities. (Organisation for Economic Co-operation and Development, 2006)
- In the UK, 40% of drivers have crashed by the time they are 23 years old, and 26% of drivers have crashed within two years of obtaining their licence. (AA Charitable Trust, 2011)
- One in five new drivers will crash within one year of passing their official driving test. (Brake, 2023)
- As noted in the Driving Injuries and Fatalities section, drivers aged 16–19 were 38% more likely to be killed or seriously injured (KSI) than drivers aged 40–49, and drivers aged 20–29 were 65% more likely to be killed or seriously injured than drivers aged 40–49. The rate of KSI car driver casualties per billion miles driven was higher for male drivers aged 17 to 24 than for all other age groups. In fact, it was about four times as high as for male drivers aged 25 to 29.
- From 2017 to 2022, 32% of killed or seriously injured (KSI) casualties from a collision involving a male driver aged 17 to 24 were also aged 17 to 24. (Department for Transport, September 2023)
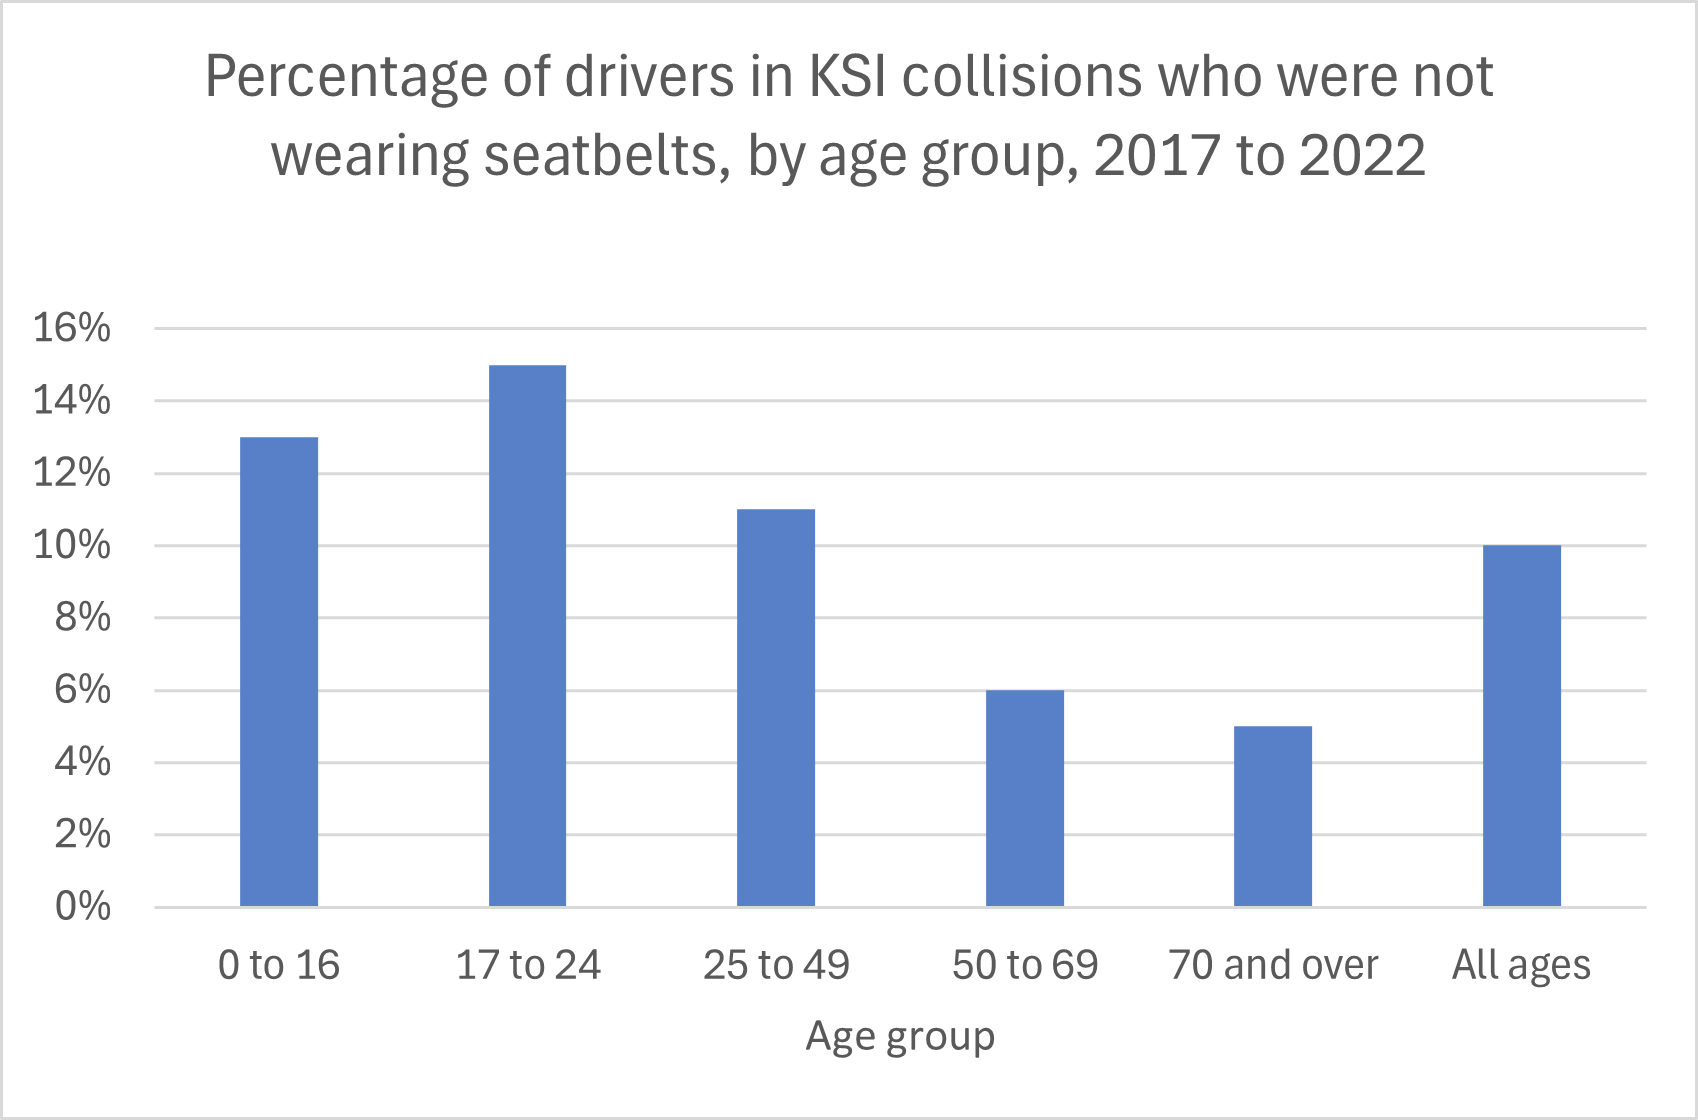
- Seatbelt use among younger drivers has generally been high: in 2019, 96.2% of drivers aged 17 to 29 wore seatbelts, slightly higher than the 94.0% of drivers aged 30 to 59 who wore seatbelts. However, the figures for younger drivers involved in KSI collisions were different. In the period 2017 to 2022, 15% of drivers aged 17 to 24 who were involved in KSI collisions were not wearing seatbelts, the highest percentage of noncompliance among drivers involved in KSI collisions. In contrast, only 5% of drivers aged 70 or older who were involved in KSI collisions were not wearing seatbelts. See the following chart. (Department for Transport, September 2023)
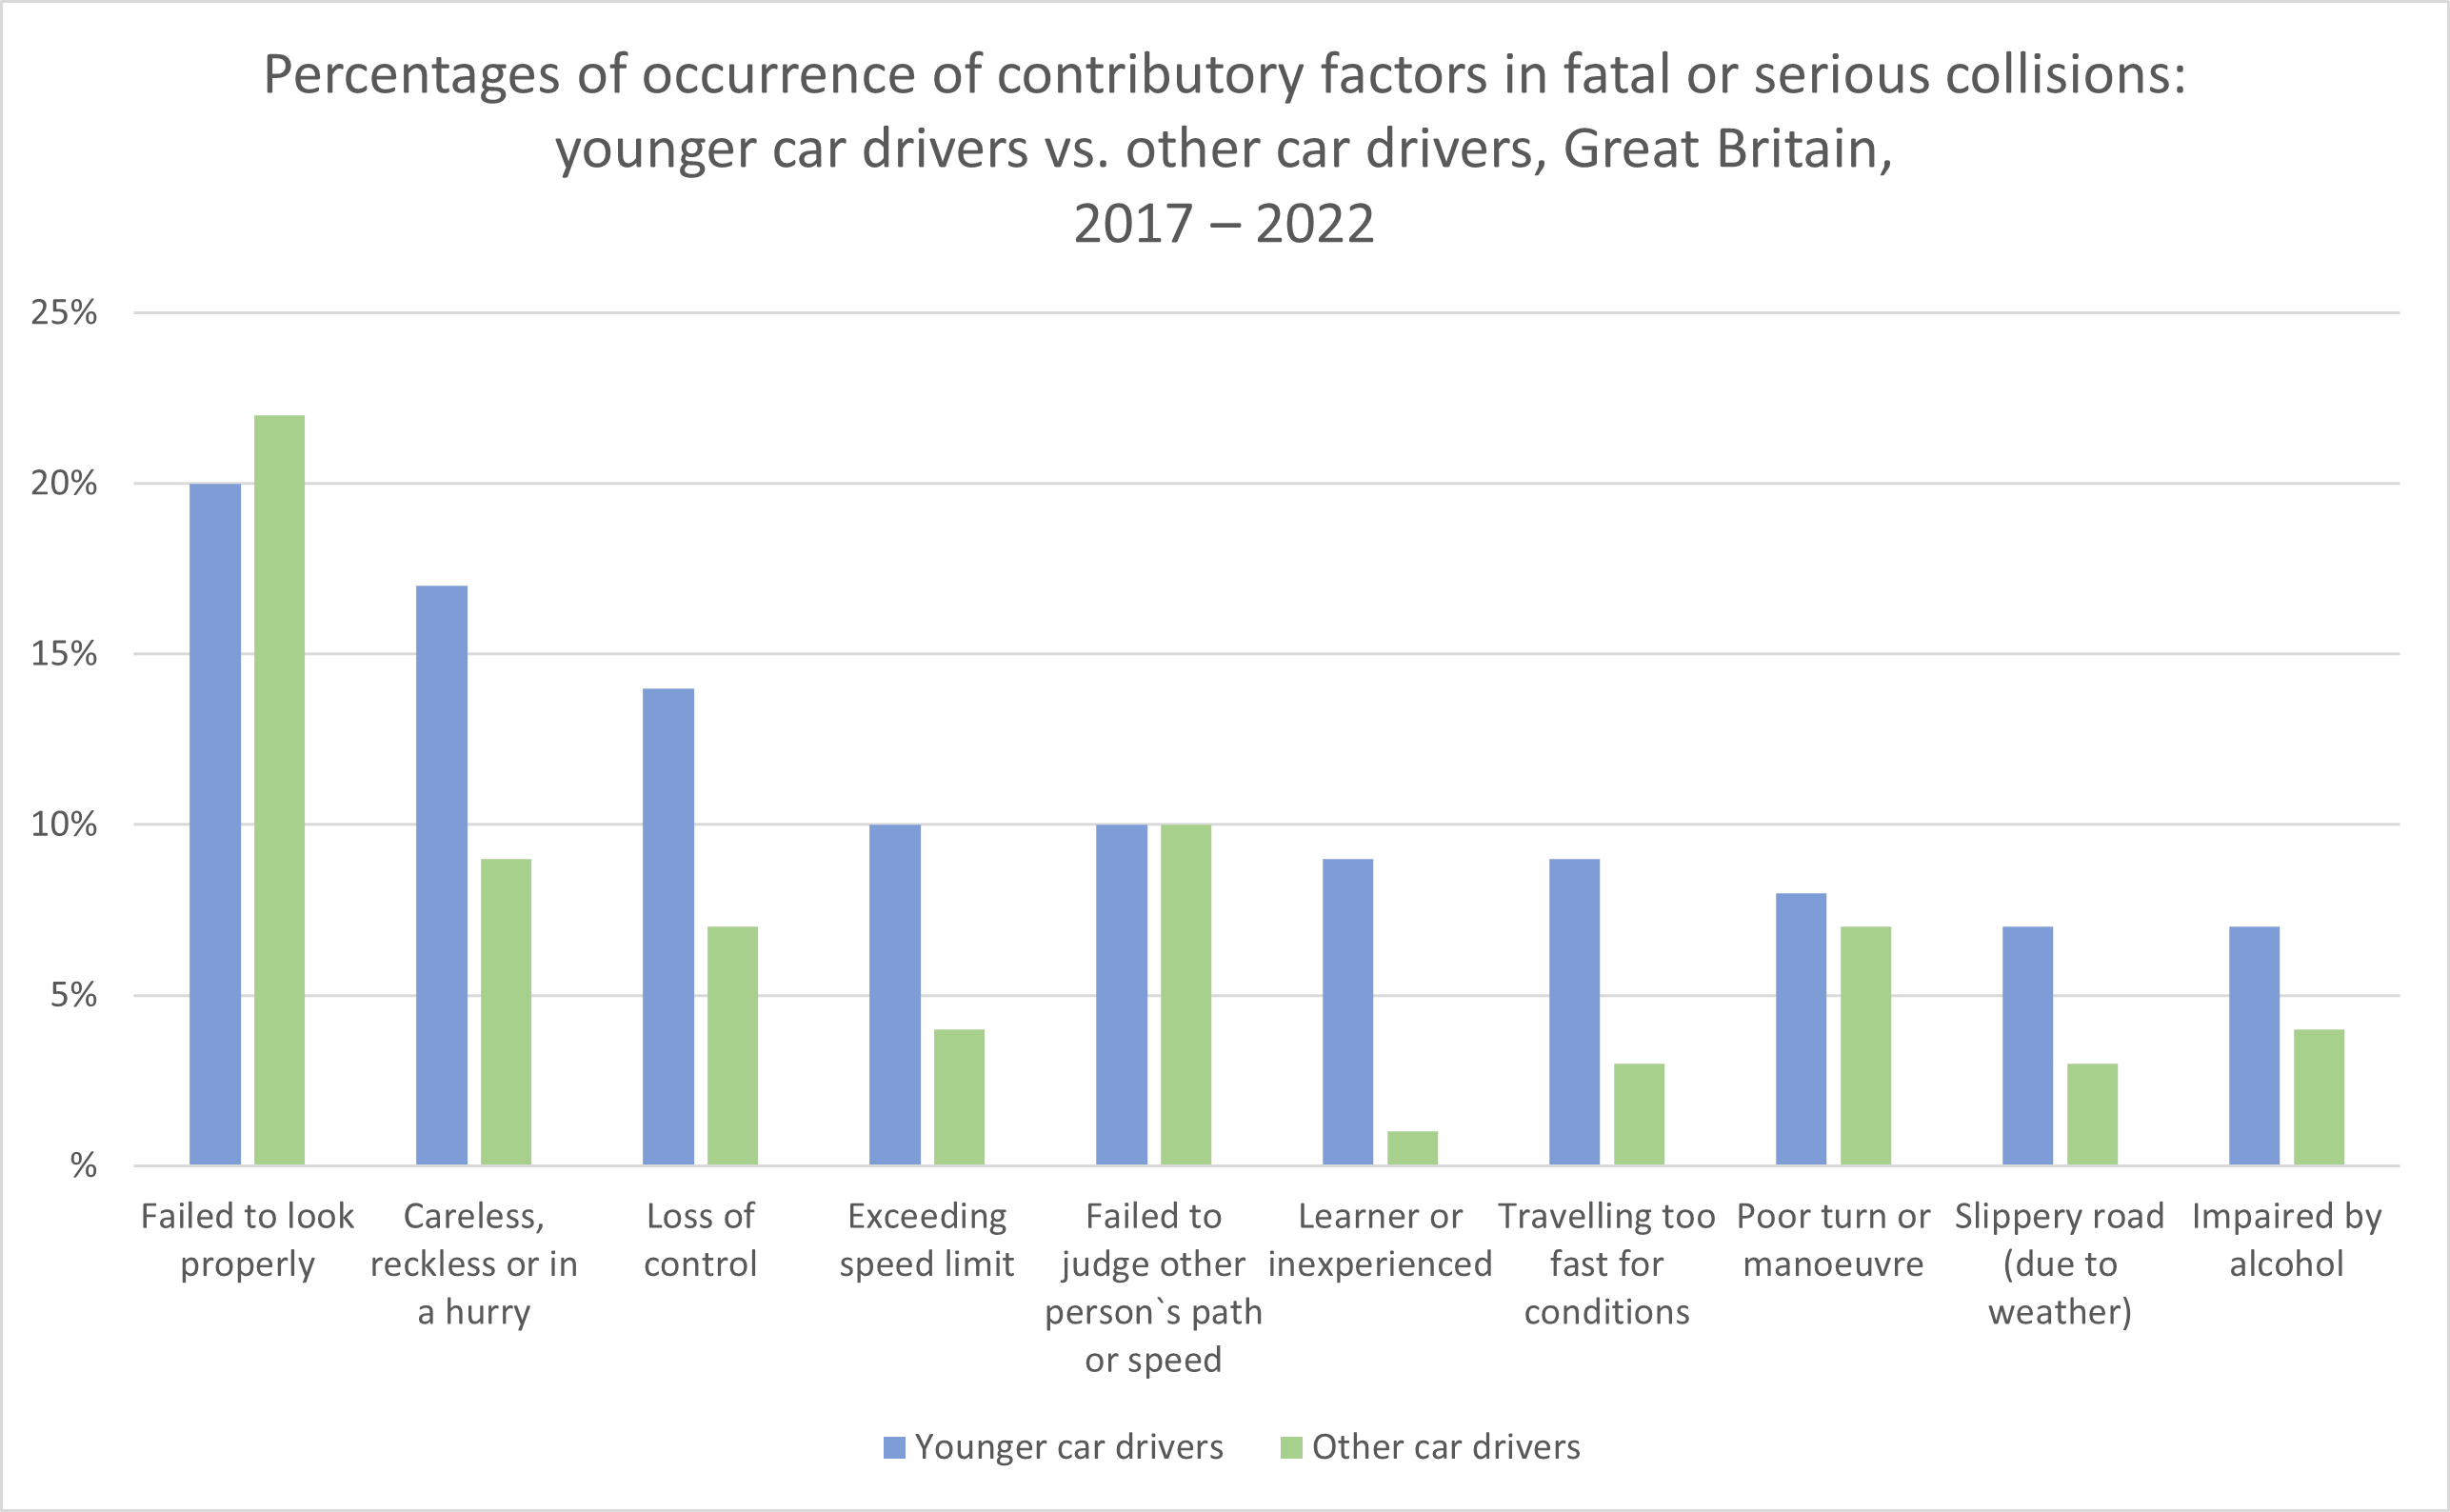
- The following chart depicts the 10 most common contributory factors in fatal or serious collisions in Great Britain involving younger drivers, contrasted with the 10 most common contributory factors for other drivers involved in such collisions. The contributing factors ‘careless, reckless or in a hurry’, ‘loss of control’, ‘exceeding speed limit’ and ‘travelling too fast for conditions’ occurred significantly more often among younger drivers than among other drivers, suggesting a pattern of careless, even aggressive driving. Another contributory factor occurring far more often among younger drivers was ‘learner or inexperienced driver’, which is not surprising for younger drivers. (Department for Transport, September 2023)
Seniors
- In Europe, the fatality rate for drivers over 75 years of age is more than five times higher than the average, and their injury rate is twice as high. (EU Mobility & Transport, 2019)
- In Europe, older drivers are over-represented in crashes at intersections. Typically, the older driver turns against oncoming traffic with the right-of-way on the main road. (EU Mobility & Transport, 2019)
- In Europe, older drivers are under-represented in crashes involving loss of control or collisions due to speeding, risky passing, or driving under the influence of alcohol. (EU Mobility & Transport, 2019)
- In Great Britain in 2022, 144 older car drivers (i.e., those 70 years of age or older) were killed, representing 26.5% of all car drivers killed. 1,036 older car drivers were seriously injured, representing 14.5% of all car drivers seriously injured. Older car drivers were also involved in a disproportionate number of serious collisions. 262 persons were killed in collisions involving an older car driver, representing 19.7% of all persons killed in collisions involving car drivers. 2,993 persons were seriously injured in collisions involving an older car driver, representing 13.1% of all persons seriously injured in collisions involving car drivers. (Department for Transport, September 2023)
- In England, car drivers who are 70 years of age or older are involved in fewer collisions than younger drivers. However, this is probably because these older drivers tend to drive less per year than younger drivers. The number of collisions per billion vehicle miles travelled (bvm) declines with increasing age until about age 70, when it starts to rise sharply. Drivers who are at least 86 years old are involved in more collisions per bvm than young drivers aged 17–24. See the following chart from the Department for Transport. (Department for Transport, 2018)
- And as noted in the section Injuries and Fatalities by Age, the rate of drivers killed or seriously injured (KSI) per billion vehicle miles driven has been nearly as high for the oldest drivers as it has been for the youngest drivers. The rate of KSI casualties for male drivers aged 86 or older was second only to the rate for male drivers aged 17 to 24. (Department for Transport, September 2023)
- In Great Britain in the period 2011 to 2022, there were 37,101 killed or seriously injured (KSI) casualties in collisions involving an older car driver. 13,078 casualties were the car drivers themselves, making up 35.2% of all the casualties. 5,221 casualties were the car drivers’ passengers, making up 14.1% of all the casualties. From 2011 to 2022, the number of older car driver casualties increased by 15.7%, the number of casualties among the older car drivers’ passengers increased by 3.8%, and the number of other casualties in collisions involving older car drivers increased by 0.4%. See the following chart. (Department for Transport, September 2023)
- The casualty rate (deaths, serious injuries, and slight injuries) of car drivers who are 70 years of age or older is slightly lower than that of other drivers, even when taking vehicle miles travelled into account. In 2016, in England, there were 292 older driver casualties (deaths, serious injuries and slight injuries) per billion vehicle miles driven, versus 306 casualties for drivers of all ages. From 2002 to 2016, the casualty rate for older drivers declined by 41%, although the casualty rate for all drivers declined slightly more – by 44%. See the following chart from the Department for Transport. (Department for Transport, 2018)
- Among older persons (ages 70 and older) in Great Britain in 2019, the road user group with the largest number of killed or seriously injured (KSI) casualties was car drivers, with 1,210 KSI casualties. A close second was the road user group pedestrians, with 1,208 KSI casualties. However, the road user group with the largest proportion of KSI casualties for older people was bus or coach passengers. 45.8% of KSI casualties among bus or coach passengers were ages 70 and older. The next largest group was older pedestrians, comprising 17.5% of all pedestrian casualties. See the following chart. (Department for Transport, 2022)
- In 2020, perhaps reflecting the travel precautions that many older persons were taking against COVID infection, older persons made up a smaller share of KSI casualties in all these categories of road user except motorcycle riders and pedal cyclists, where their share of KSI casualties increased. (Department for Transport, 2022)
- The following chart depicts the 10 most common contributory factors in fatal or serious collisions in Great Britain involving older drivers (drivers aged 70 or older), contrasted with the 10 most common contributory factors for other drivers involved in such collisions. Note that for drivers under 70 years of age but not older drivers, the second most common contributory factor was ‘careless, reckless or in a hurry’. For older drivers but not other drivers, the third most common contributory factor was ‘illness or disability’. The contributory factors ‘failed to look properly’ and ‘failed to judge another person’s path or speed’ were more common in collisions involving older drivers than in collisions involving other drivers. (Department for Transport, September 2023)

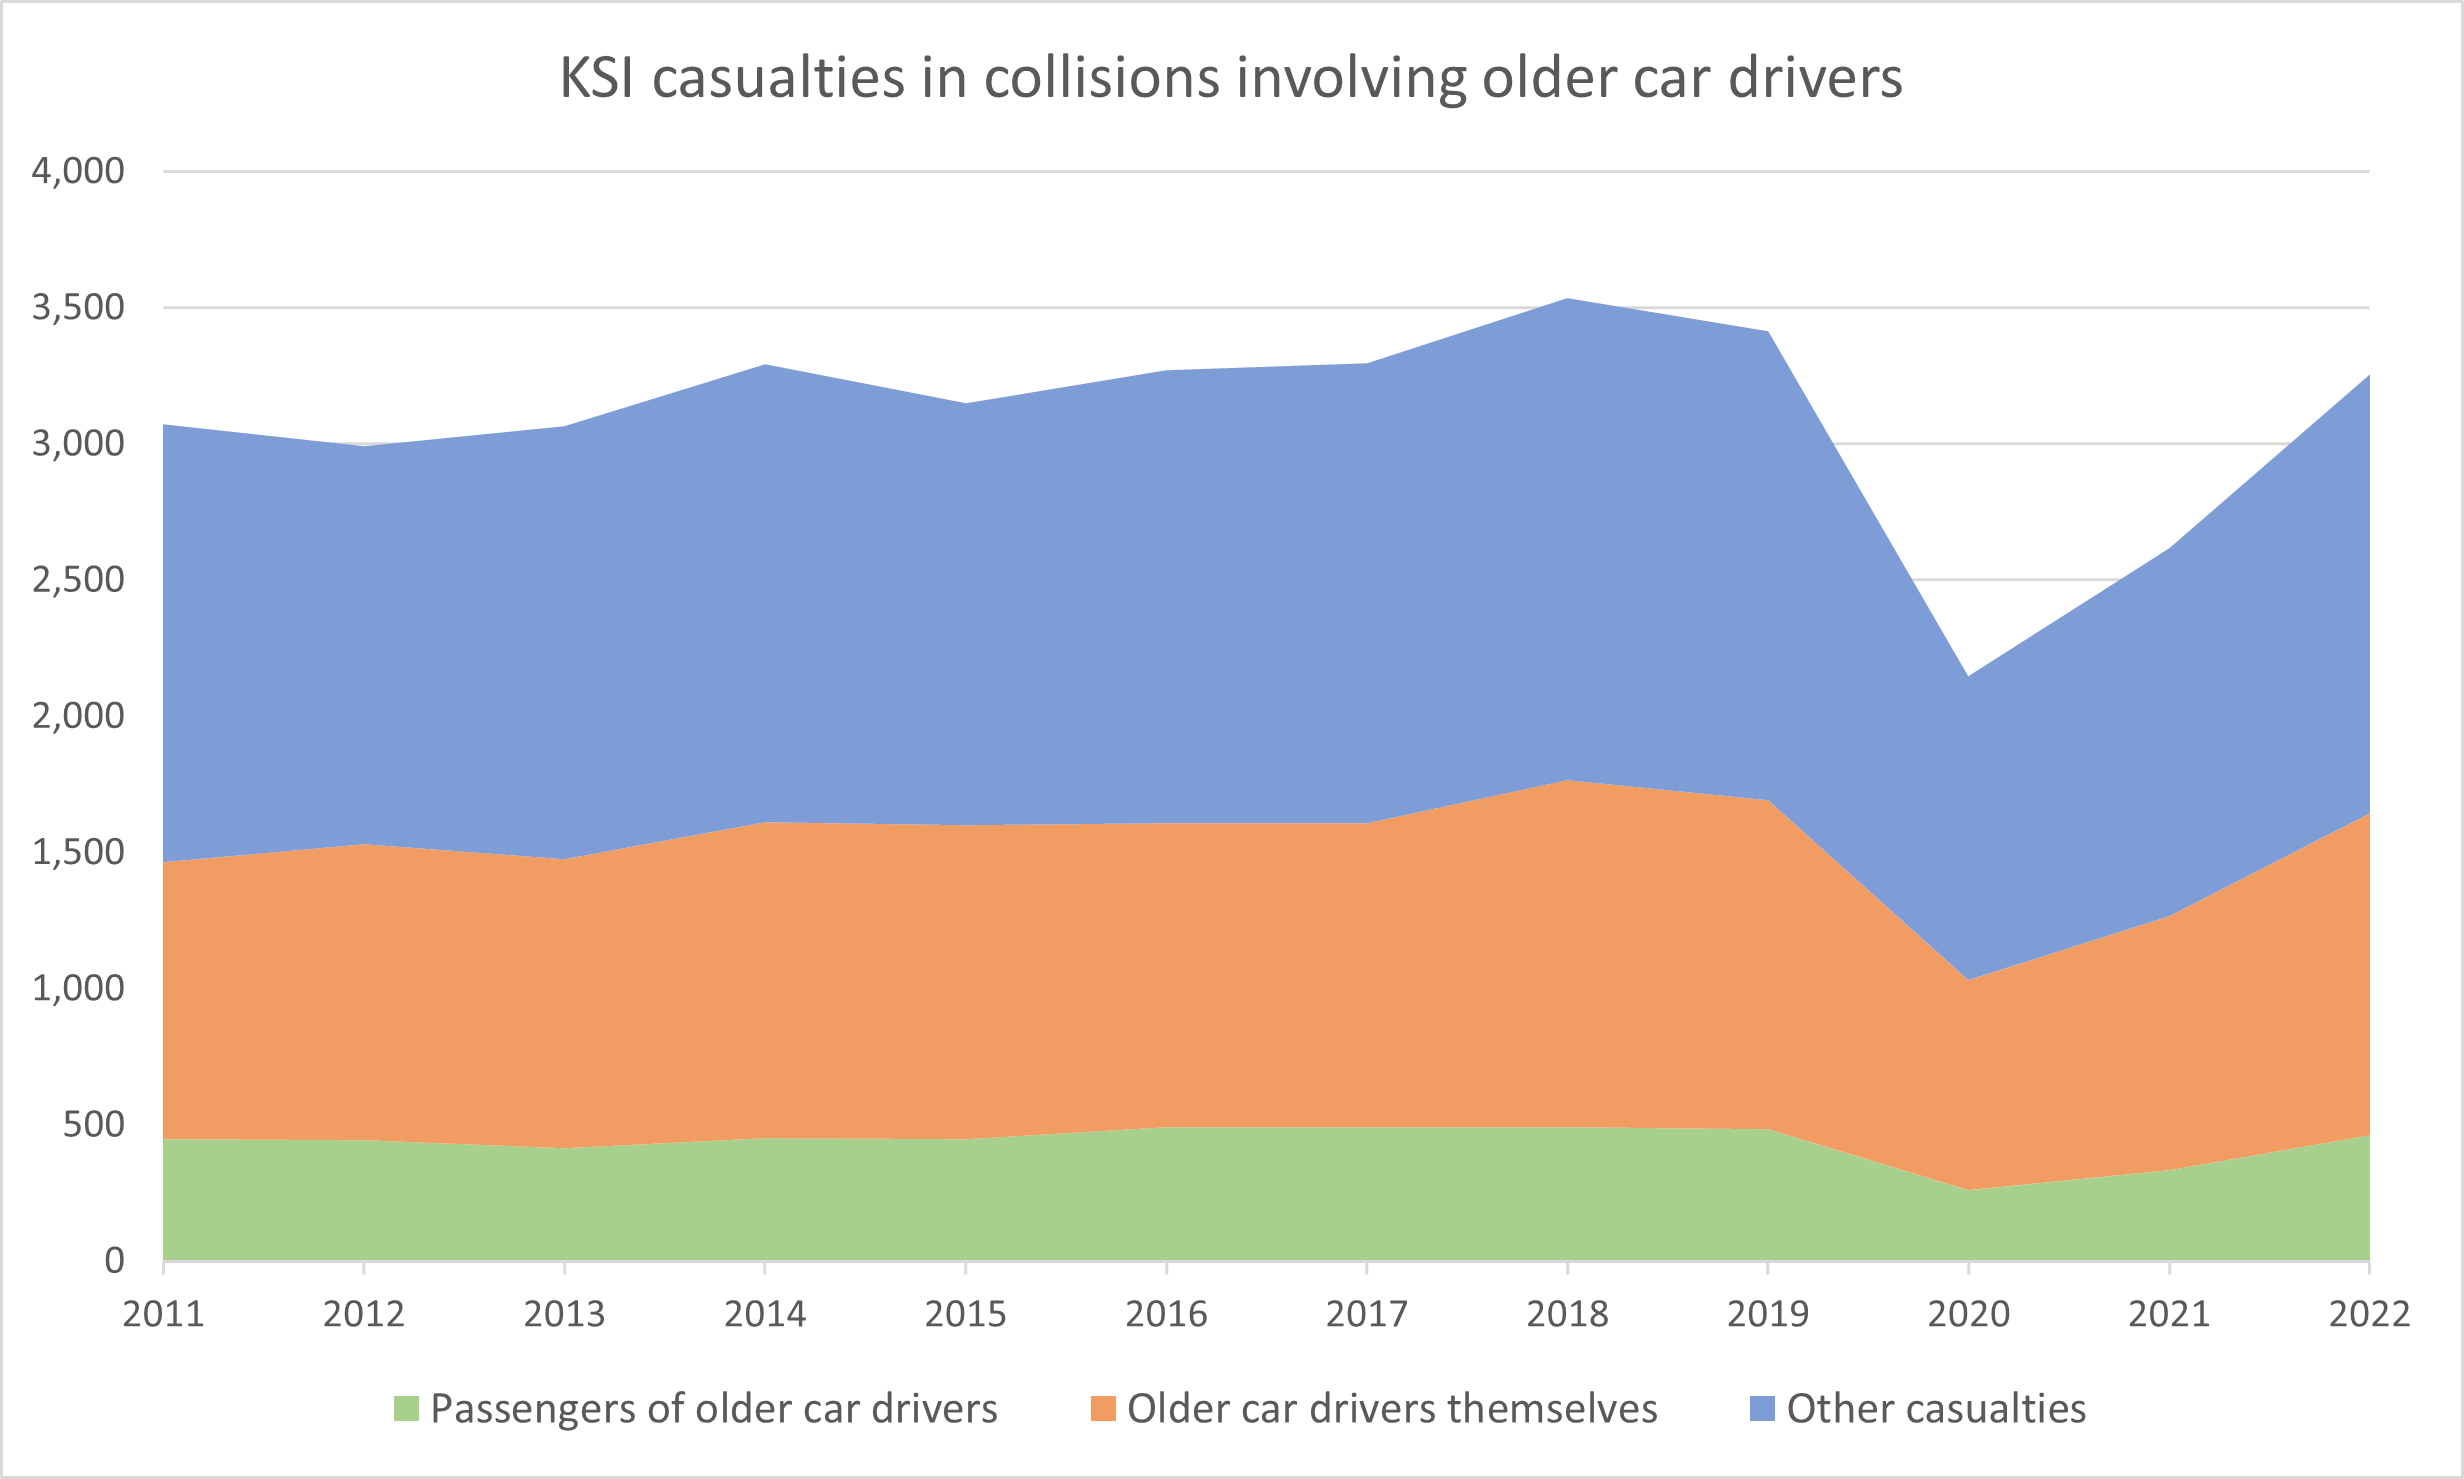

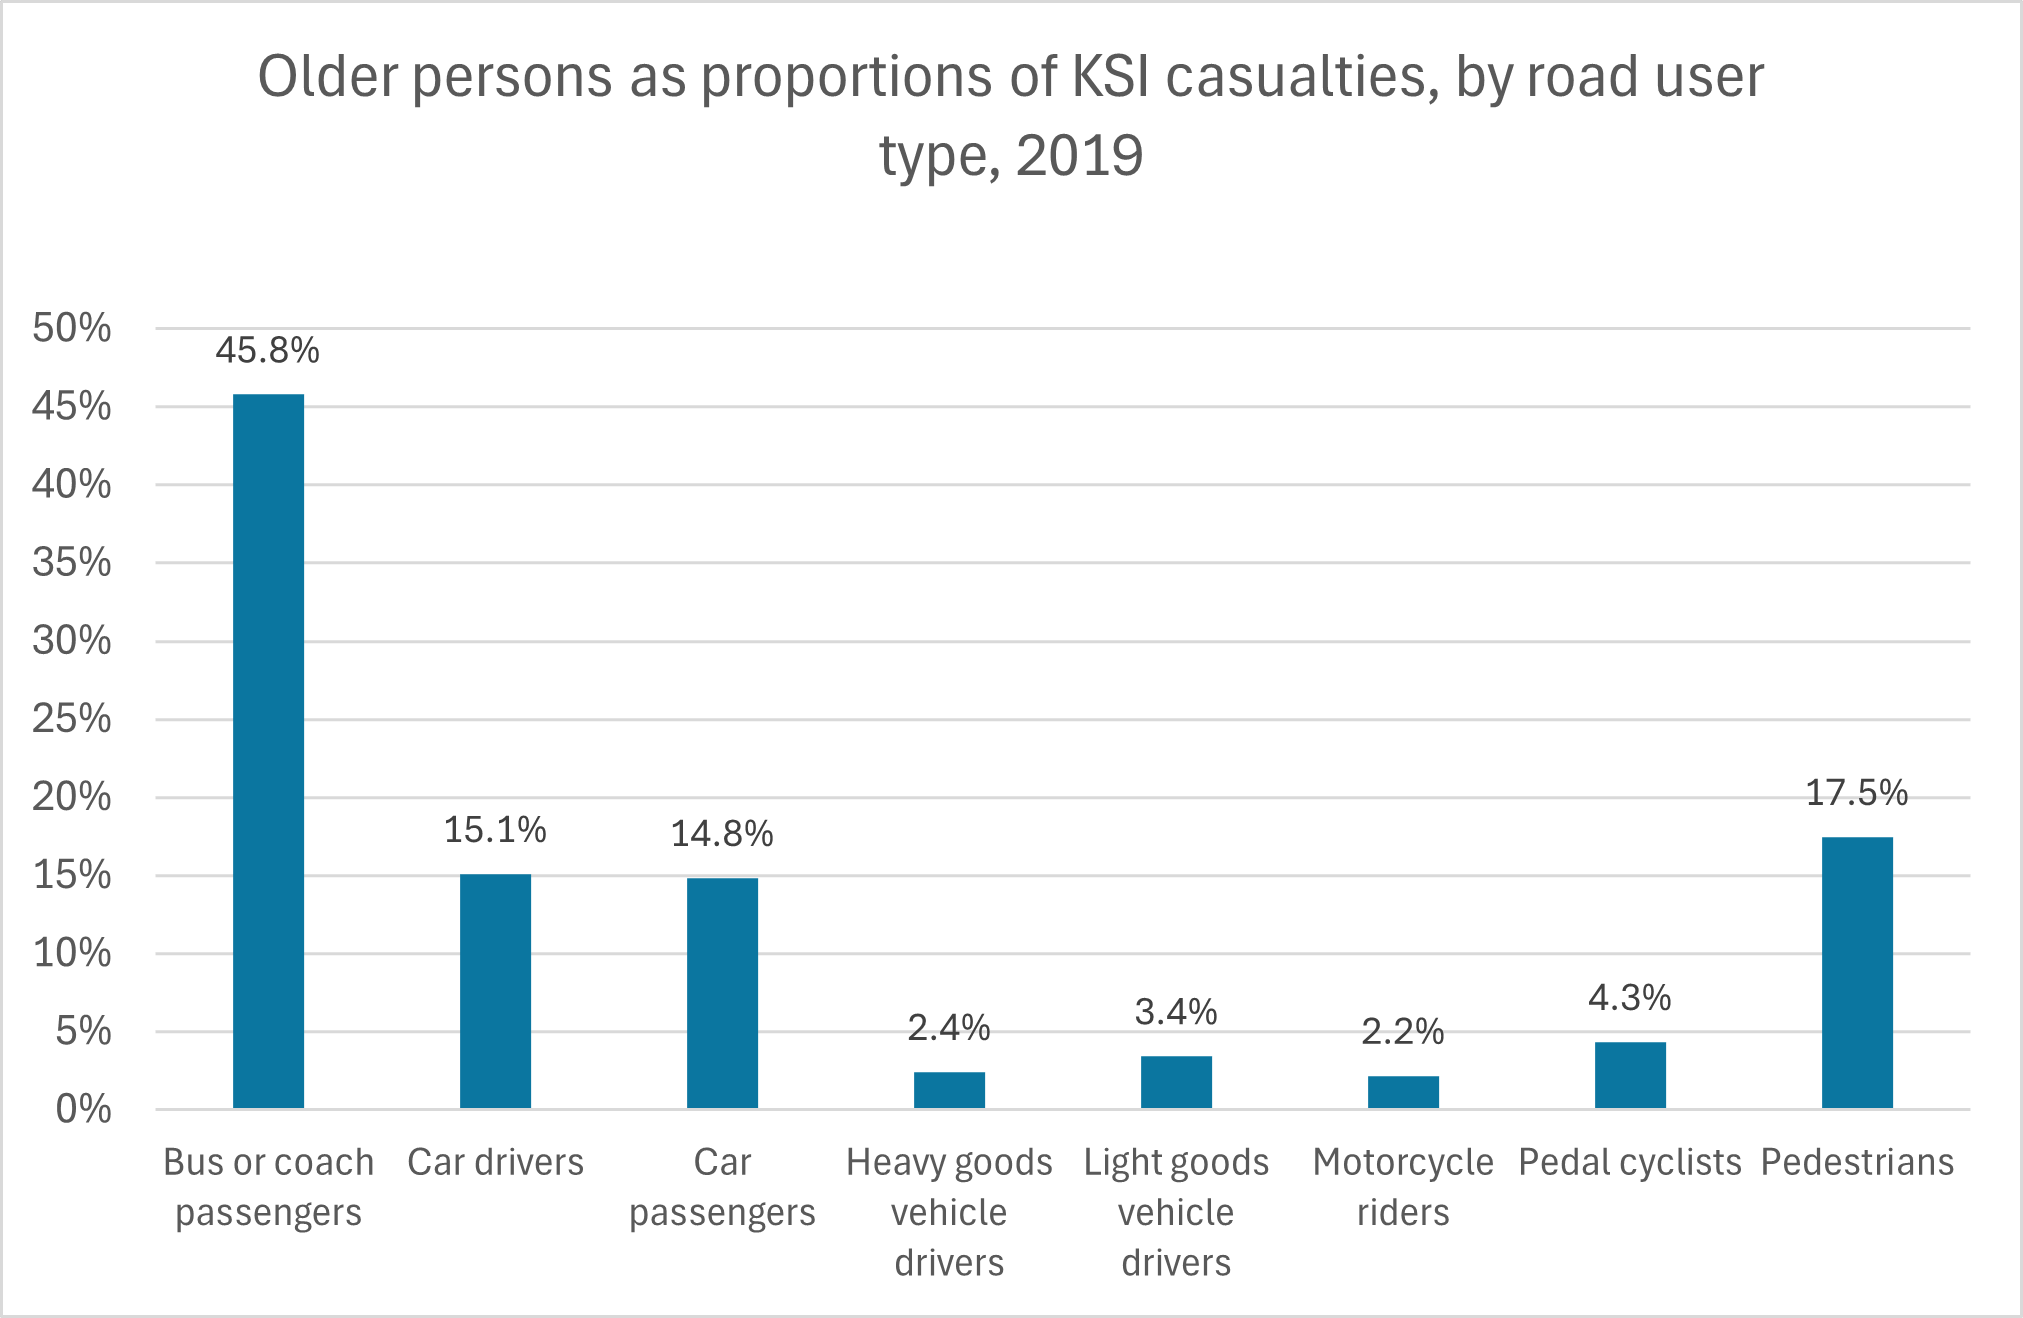
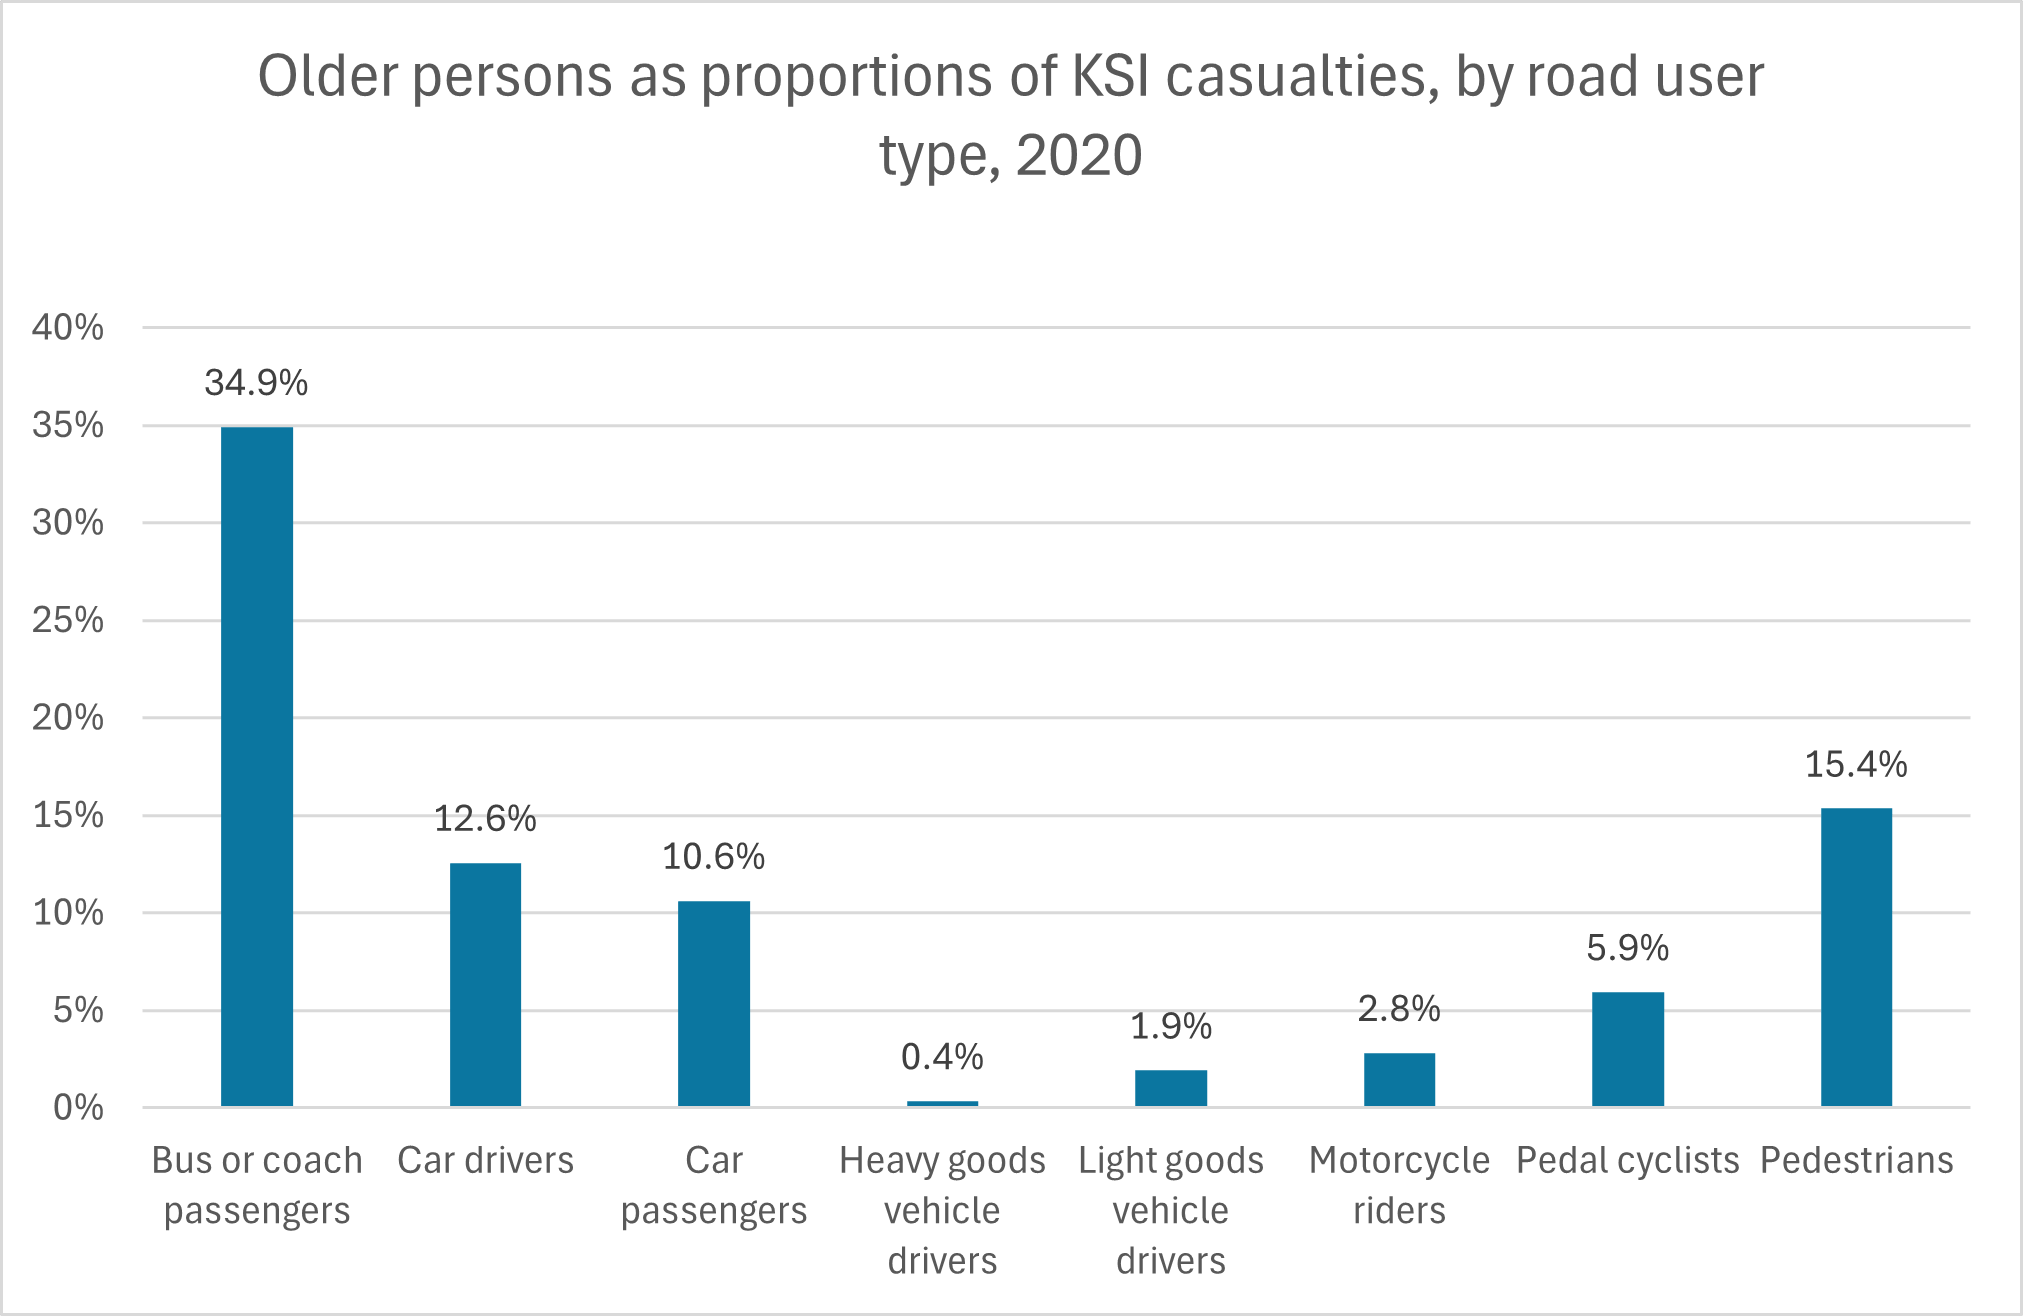
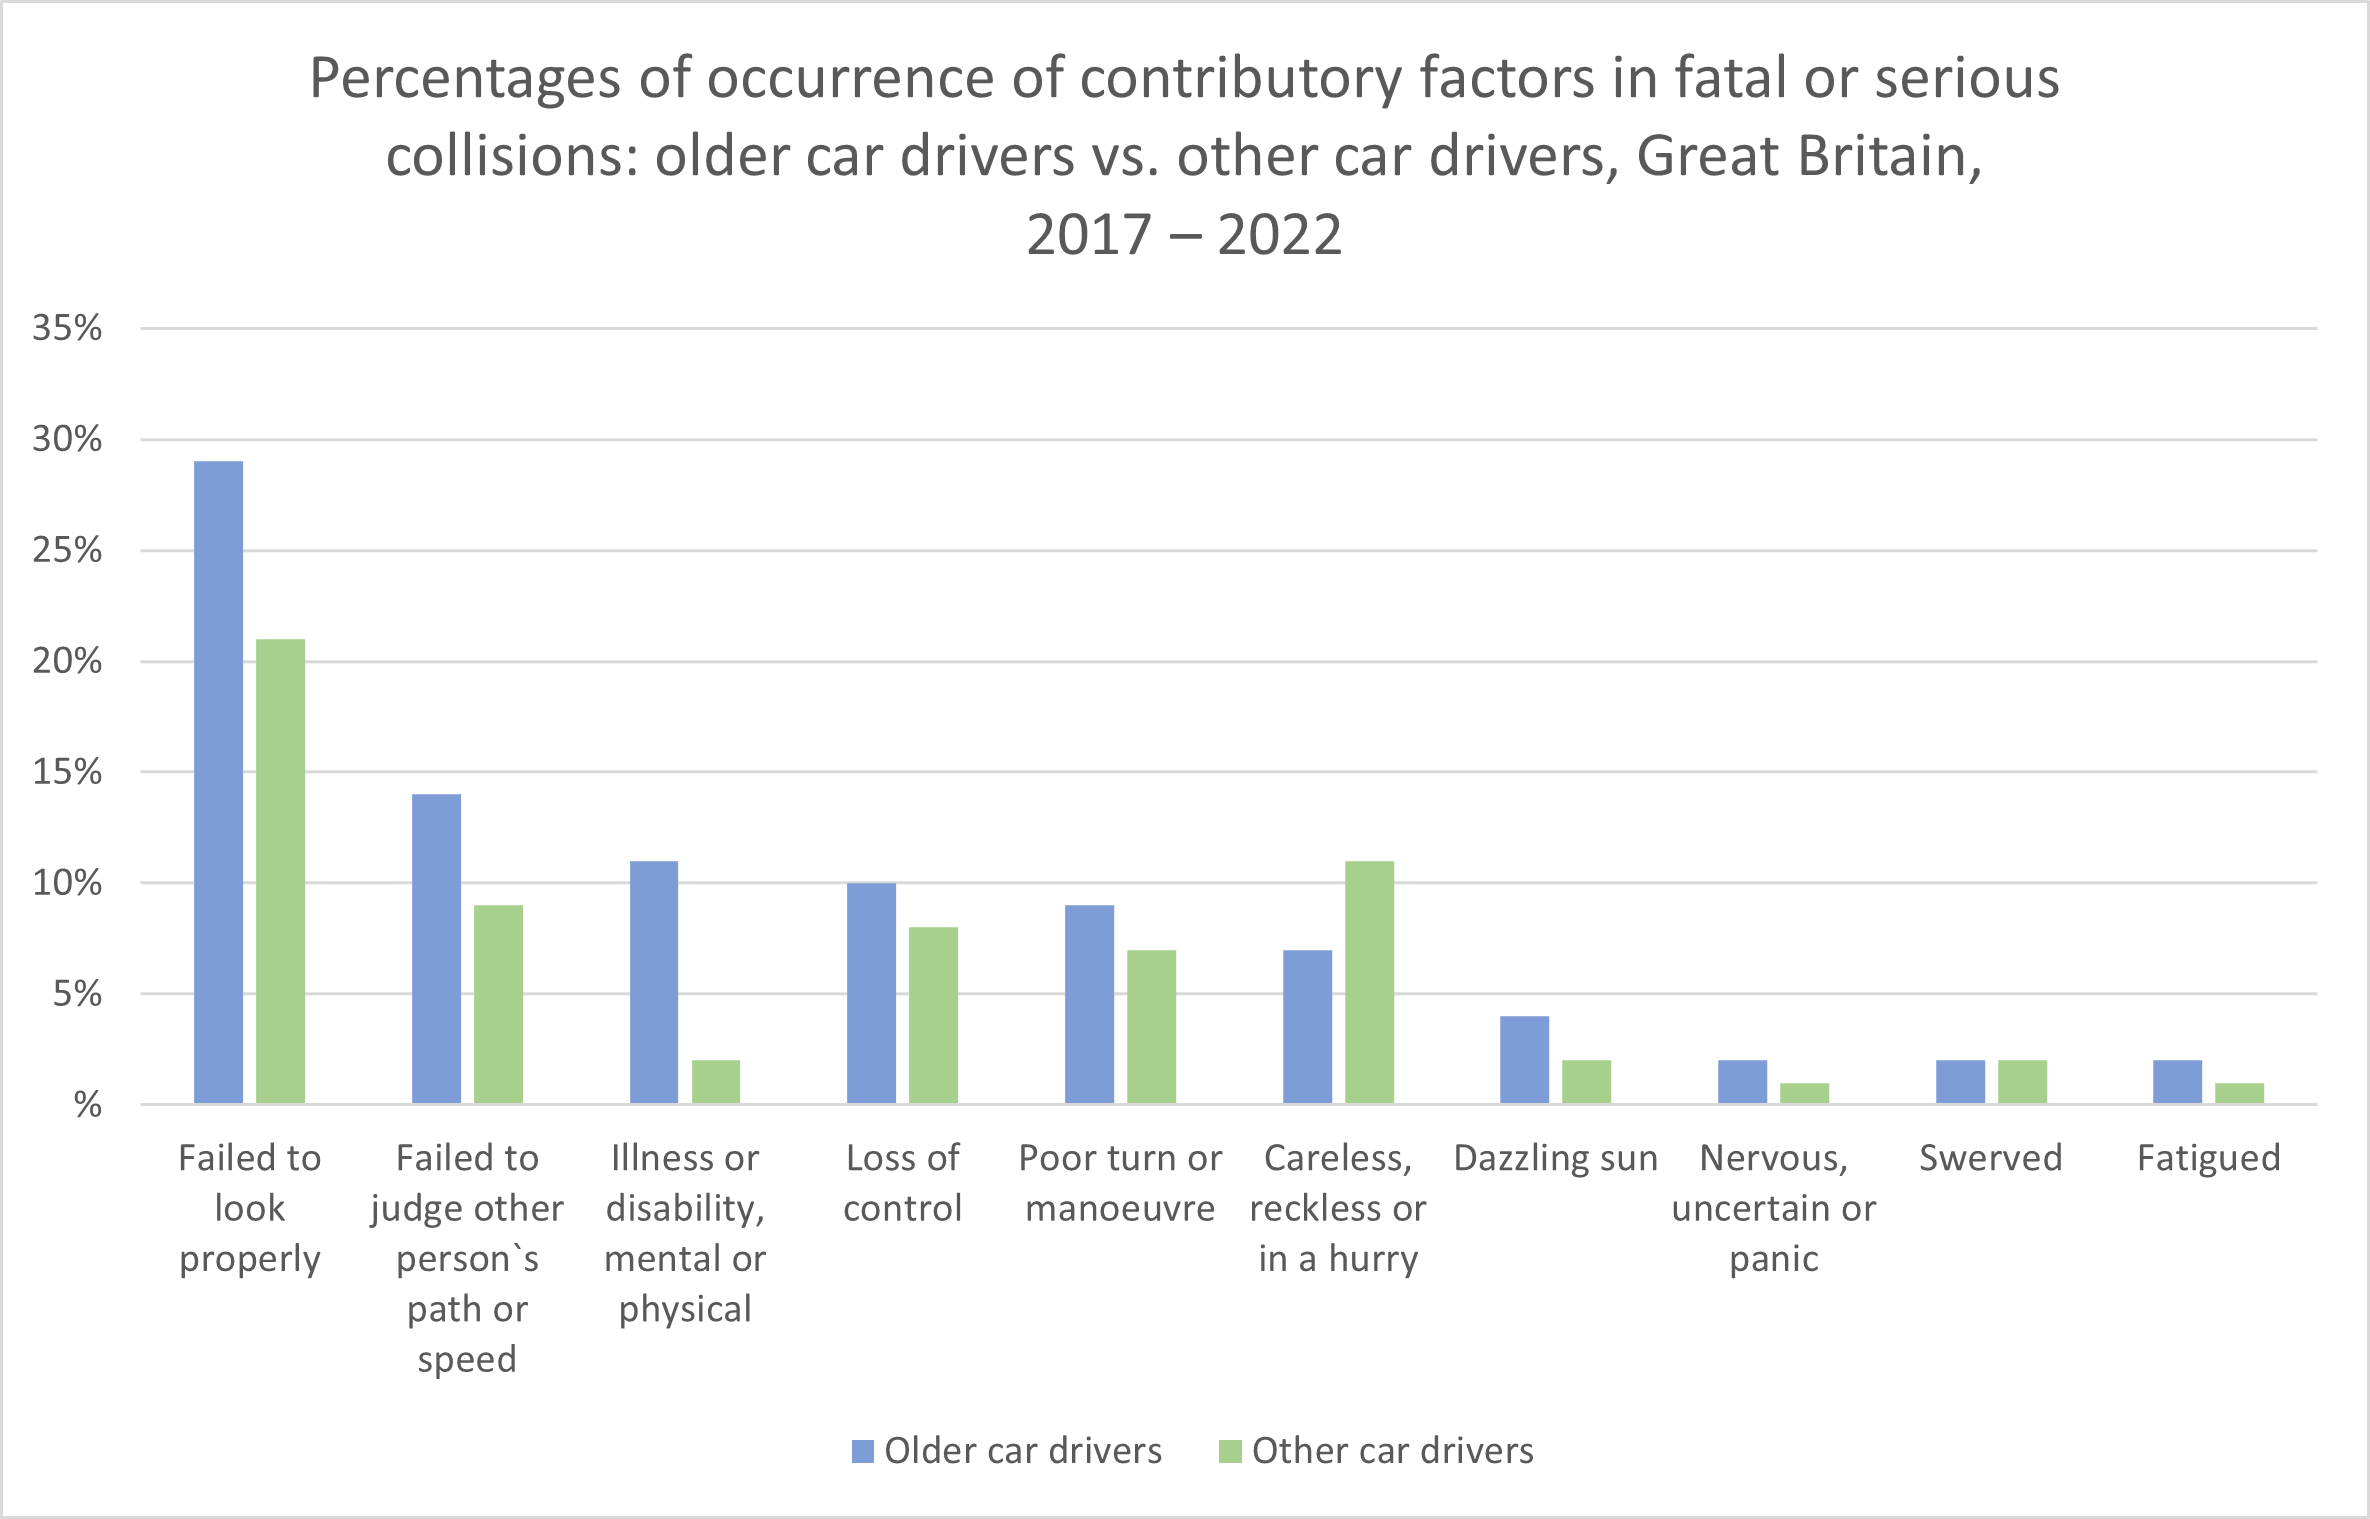
Related to Trucking
- At the end of 2022, there were approximately 537,300 licensed heavy goods vehicles (HGVs) and 4,623,100 licensed light goods vehicles in the UK. (Department for Transport (DfT) and Driver and Vehicle Licensing Agency (DVLA), December 2023)
- In 2022, heavy goods vehicles (HGVs or lorries) travelled 17.4 billion vehicle miles, representing 5.4% of total motor vehicle traffic (323.8 billion vehicle miles). (A ‘lorry’ is defined as a commercial vehicle with a maximum gross weight of 3.5 tonnes or more.) Lorry traffic was up 11.5% from 2012. From 2012 to 2019, lorry traffic had been increasing steadily to 17.2 billion vehicle miles in 2019, but it then fell by 5.8% in 2020. However, lorry traffic recovered in 2021 and 2022. See the following chart. (Department for Transport National Road Traffic Survey, July 2023)
- In 2022, HGVs registered in Great Britain lifted 1.64 billion tonnes of goods and moved 1.75 billion tonne-kilometres of goods.
- Lorry traffic in Great Britain has been closely correlated with economic changes. Lorry traffic declined by 10.3% in the 2007–2009 recession, when the UK Gross Domestic Product fell 4.6%. In 2012–2018, when UK GDP rose 15.9%, lorry traffic increased by 9.9%. (Department for Transport, 2019)
Note, however, that this correlation between lorry traffic and UK GDP appears markedly stronger for lorries with four or more axles. From 1993 to 2018, traffic of lorries with four or more axles tended to rise or fall with GDP, rising 87% in that period overall. On the other hand, traffic of lorries with fewer than four axles underwent a long-term decline in that period, falling 27.5% overall. See the following chart. (Department for Transport, 2019)
- In Great Britain, motorcycles have had the highest fatal and serious collision rates (per billion vehicle miles) by far of all motor vehicles. Over the years, motorcycles have been involved in about 74% of the fatal collisions of motor vehicles per billion vehicle miles (bvm) and about 81% of the serious collisions per bvm. Among only vehicles with four or more wheels, light goods vehicles had the lowest fatal collision rate. Heavy goods vehicles (HGVs) had a higher fatal collision rate than either light goods vehicles or passenger cars. Surprisingly, buses and coaches had a higher fatal collision rate than any of these other three classes of vehicles. See the following chart. (Department for Transport, September 2023)
- On motorways, HGVs have been involved in a disproportionate share of fatal collisions. For example, in 2019 (before the COVID pandemic), among motor vehicles with four or more wheels, HGVs made up 11.4% of motorway road traffic per billion vehicle miles (bvm) but 23.2% of fatal collisions per bvm. On ‘A’ roads, HGVs made up 5.2% of road traffic per bvm but 9.8% of fatal collisions per bvm. See the following chart. (Department for Transport, July 2023 and September 2023)
- Usually, roughly half of articulated HGV road traffic is accumulated on motorways, more than articulated HGV road traffic on any other type of road. This is especially true for articulated HGVs with 5 or more axles. For example, for 5-axle articulated HGVs in 2022, 55.7% of their road traffic was accumulated on motorways, 16.8% on principal ‘A’ roads, 25.7% on trunk ‘A’ roads, and just 1.7% on minor roads. For rigid (non-articulated) HGVs, however, road traffic on principal ‘A’ roads was roughly comparable to that on motorways and actually greater for rigid HGVs with 4 or more axles. For these trucks in 2022, 29.6% of road traffic was accumulated on motorways and 37.7% was accumulated on principal ‘A’ roads. See the following chart. (Department for Transport National Road Traffic Survey, July 2023)
- In March 2024, Glassdoor stated that the annual average base salary of an HGV driver in the UK at that time was £34,000 with a range of between £29,000 (25th percentile) and £41,000 (75th percentile), plus average annual additional compensation (from bonuses, commissions, etc.) of £1,442 with a range of between £745 and £3,000.
- Glassdoor stated that the annual average base salary of a light or delivery services truck driver in the UK in October 2022 was £30,000 with a range of between £21,000 and £54,000, plus average annual additional compensation of £4,144 with a range of between £861 and £19,947.
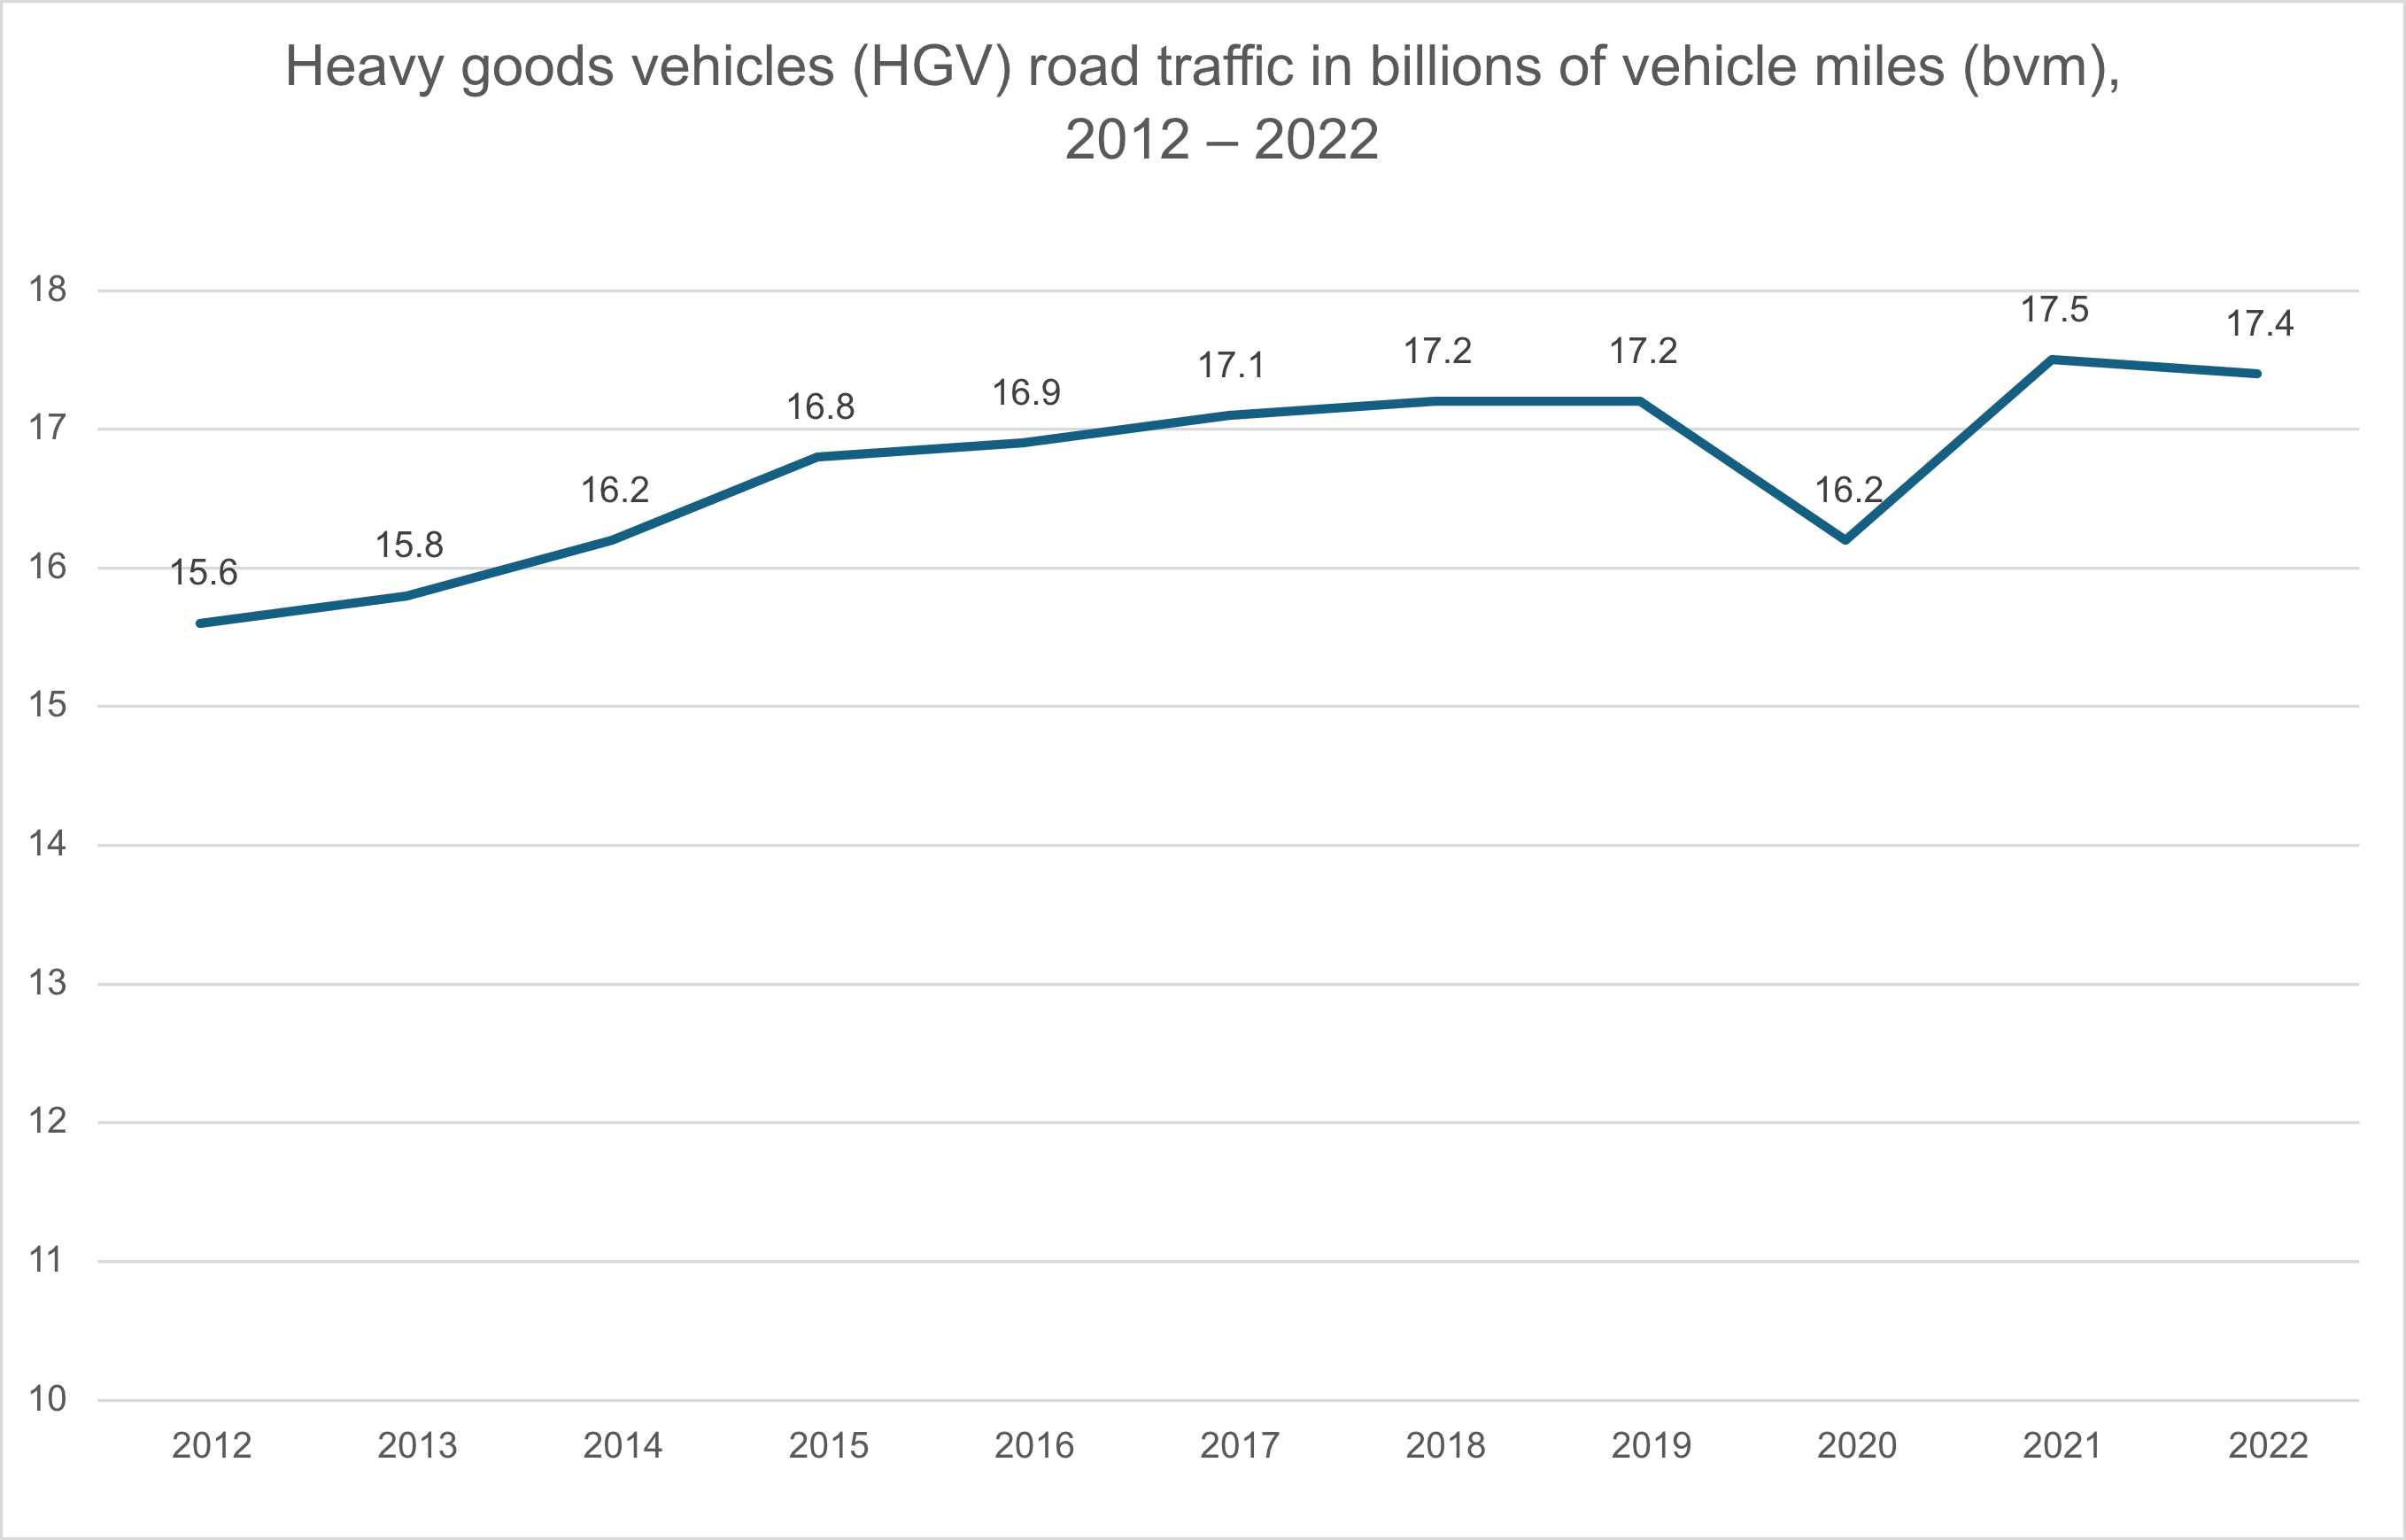
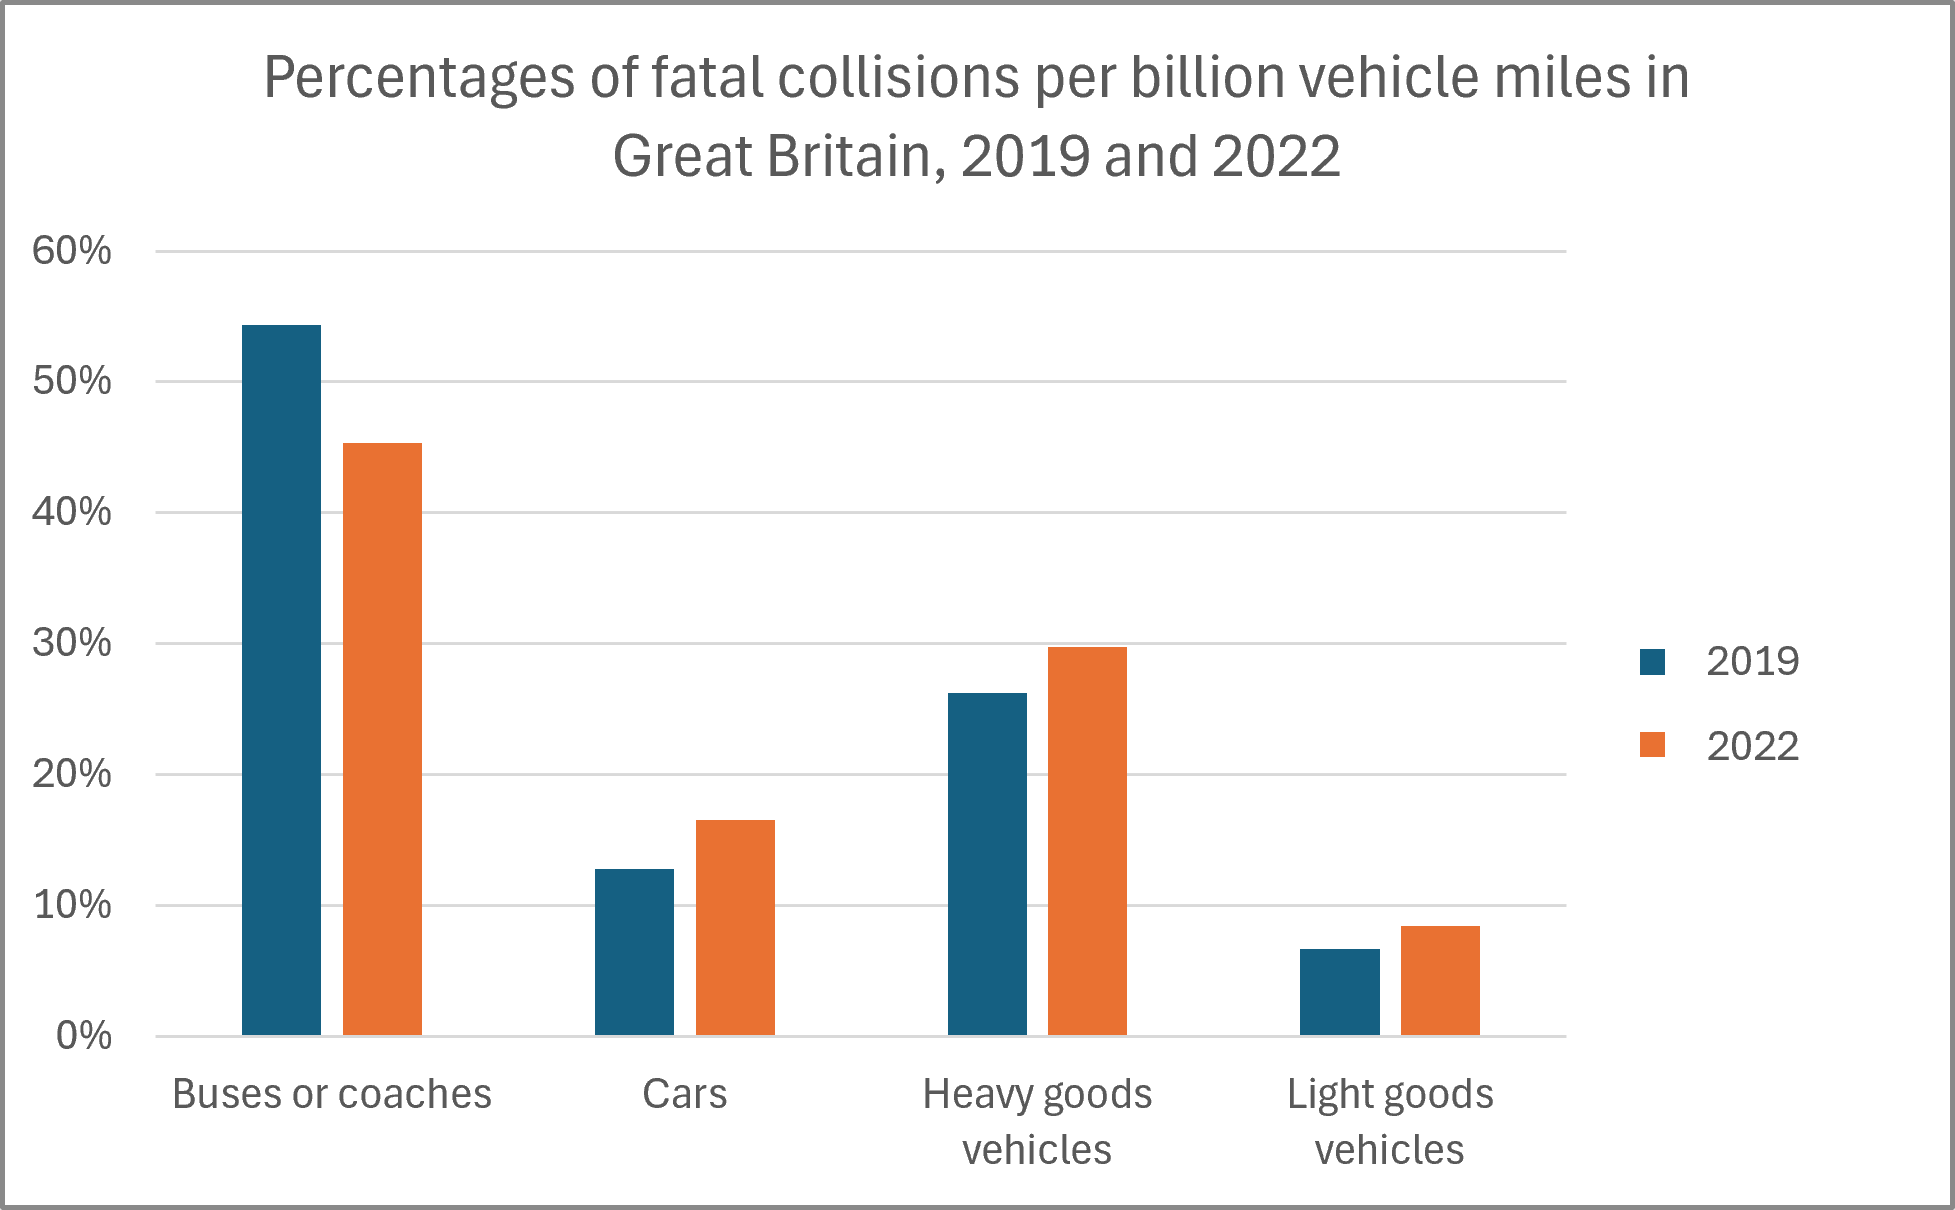
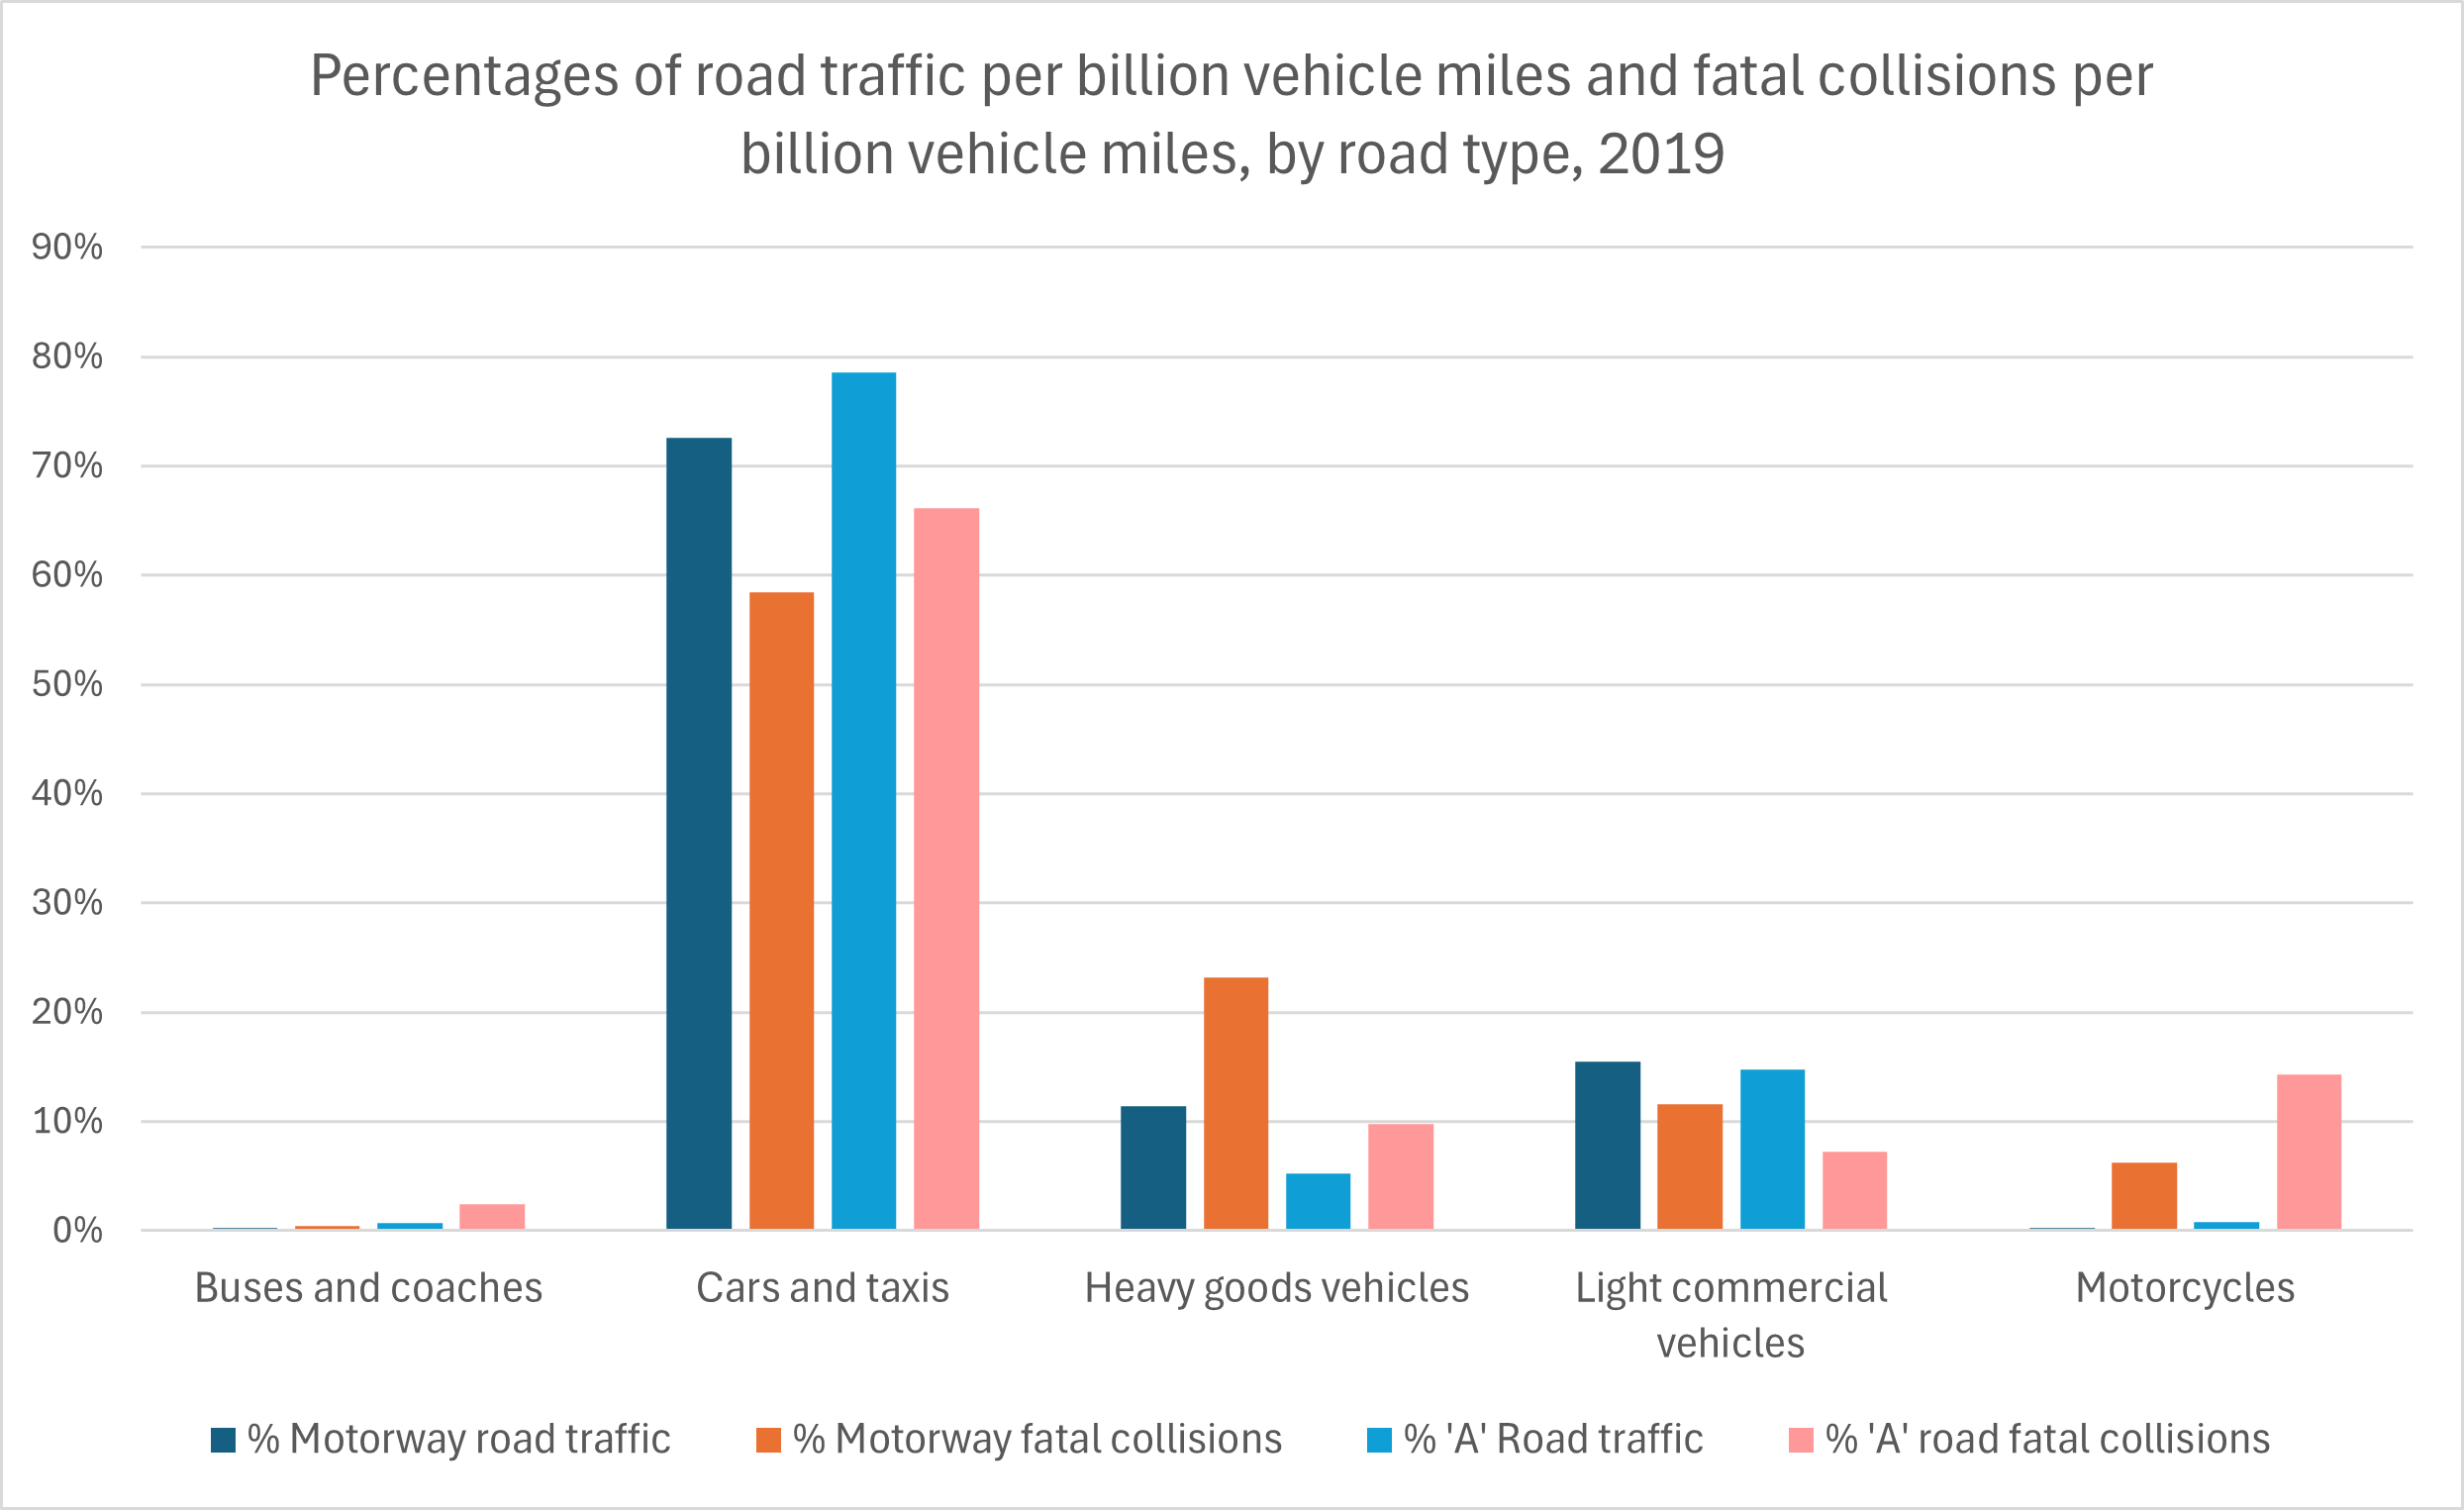
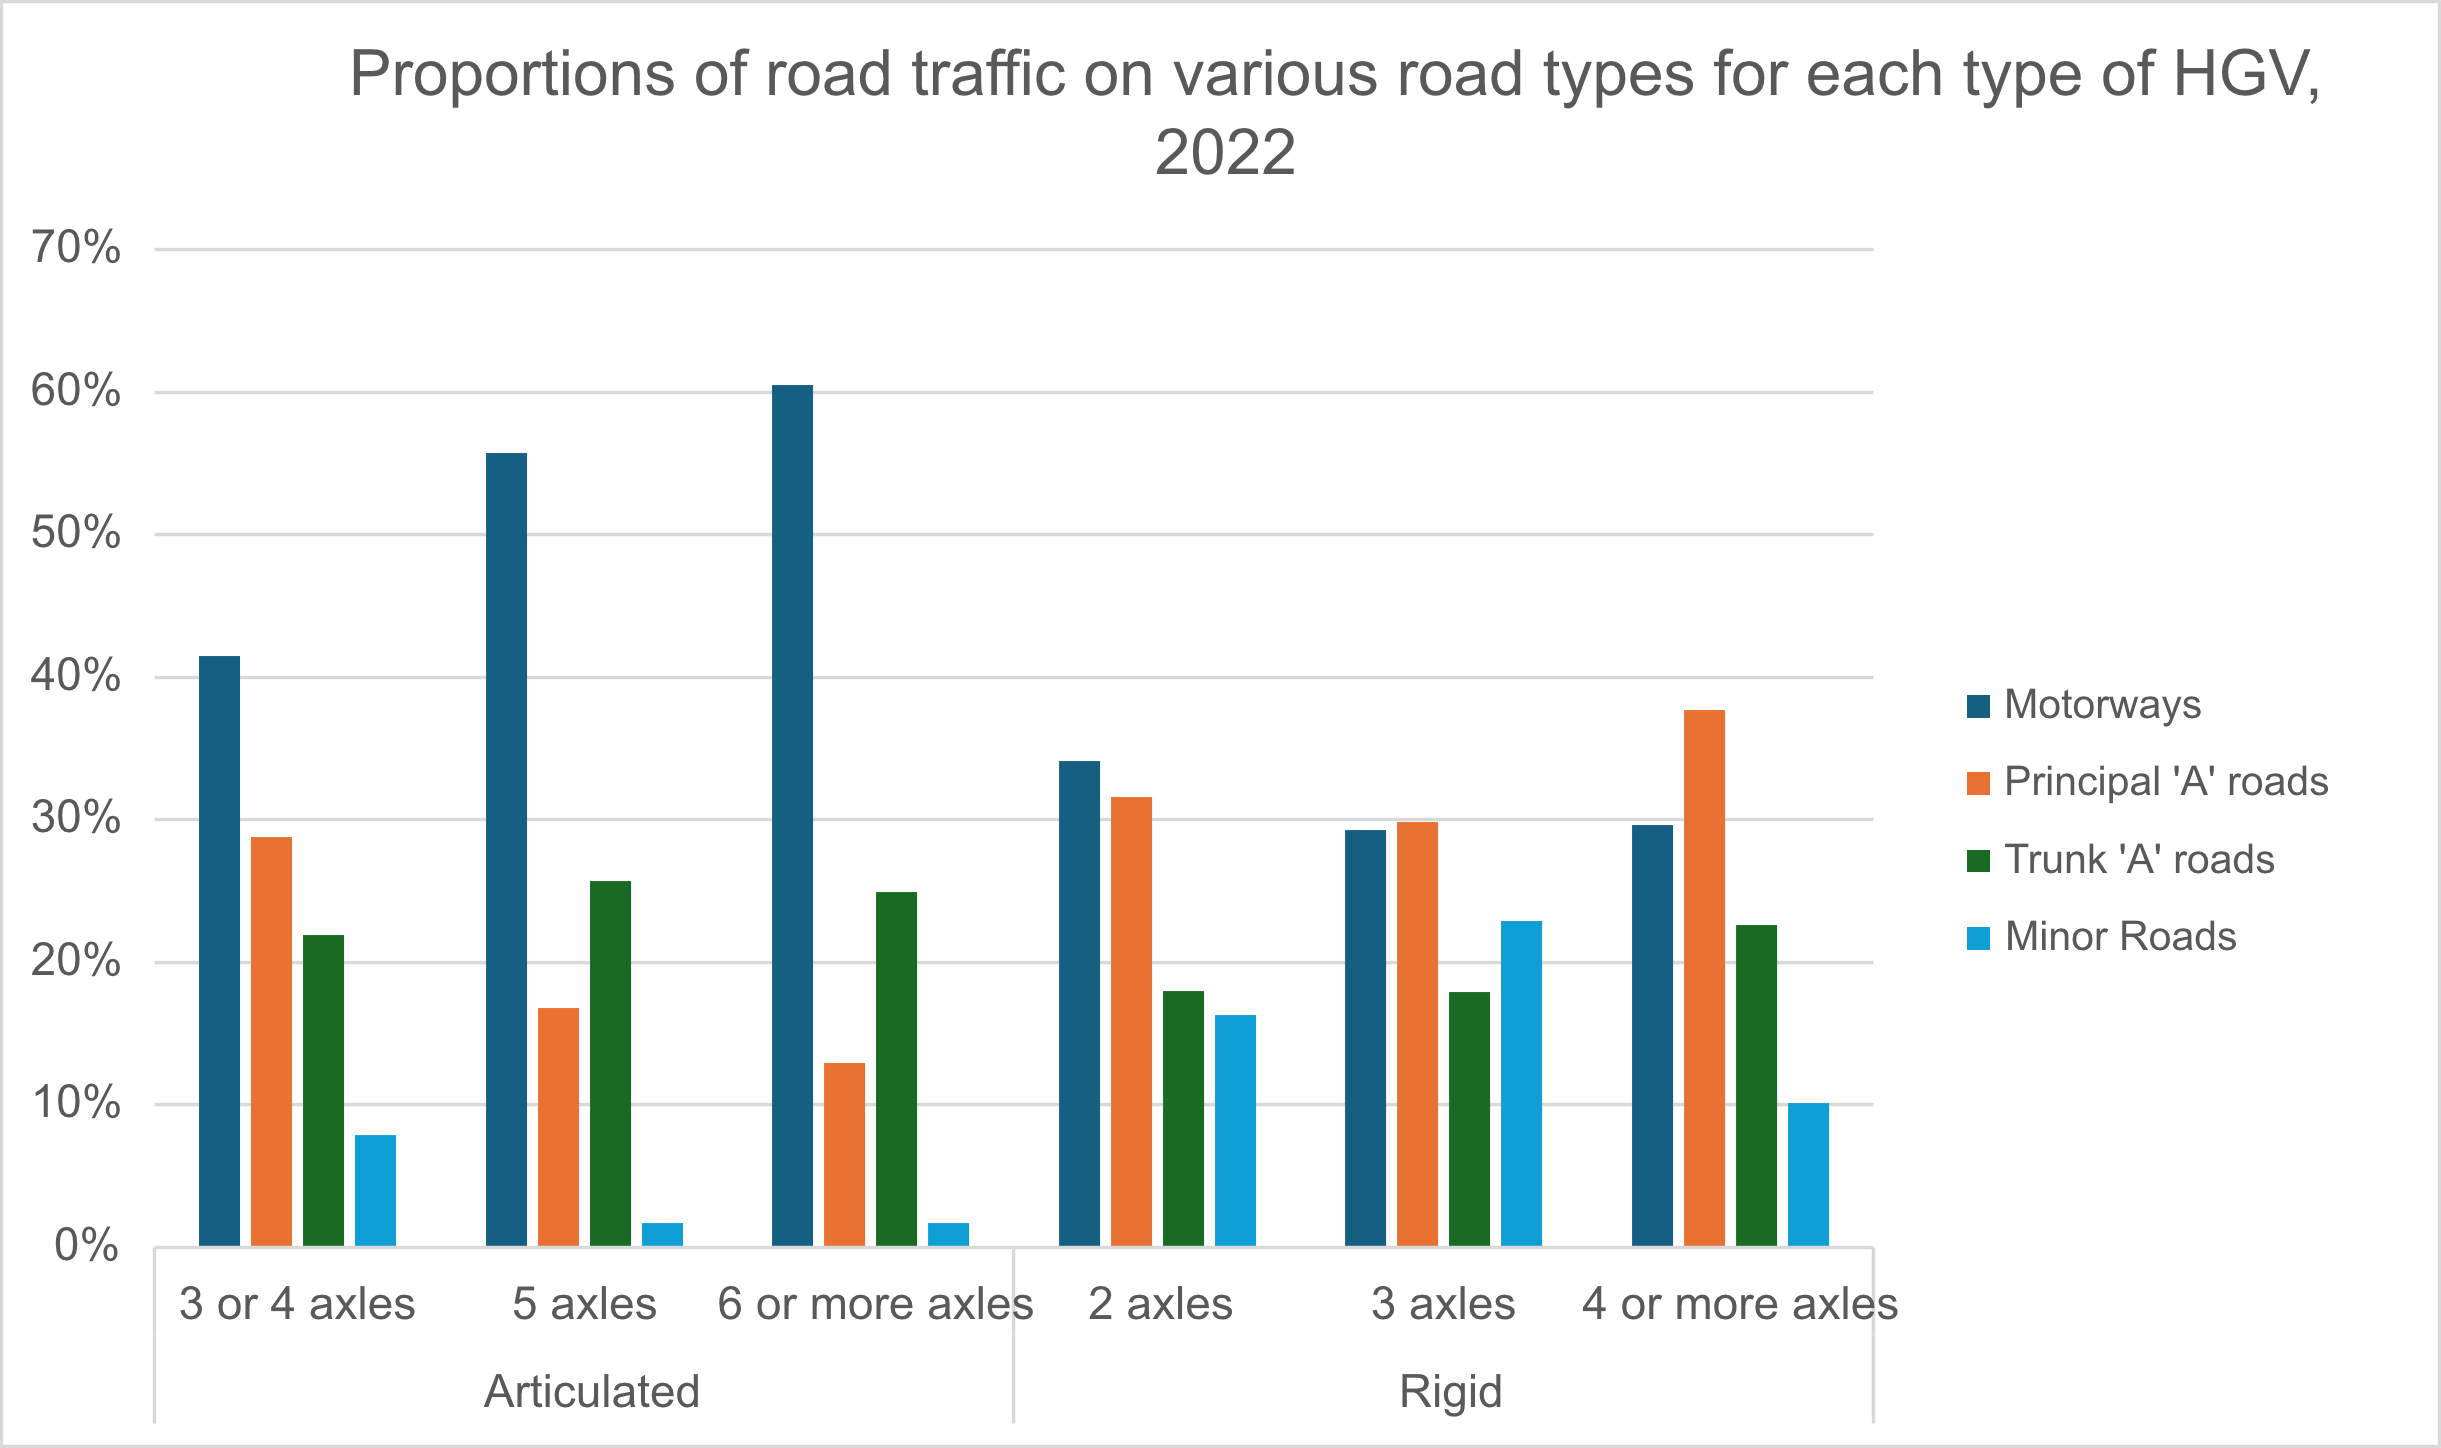
Buses Involved
- In England, buses remain the most popular form of public transport. 59% of all public transport journeys are by bus. 4.4 billion bus journeys are made each year. However, the number of bus journeys per year is down sharply from the mid-1950s, when over 13 billion bus trips were made each year. (Campaign for Better Transport, 2019)
- In recent decades, bus travel had been declining steadily even before the COVID pandemic. From 2006 to 2019, bus and coach traffic declined from 3.3 billion vehicle miles (bvm) to 2.4 bvm, and the average number of local bus journeys per head of population declined from 81 to 77 in England and from 80 to 74 in Great Britain. The COVID pandemic years dramatically accelerated these declines. By 2020, bus and coach traffic had declined to 1.6 bvm, a level not seen since 1941. By 2021, the average annual number of local bus journeys per head of population had declined to just 28 in England and 27 in Great Britain. In 2022 and 2023, bus travel started to recover from the unusually sharp declines of 2020 and 2021, but the longer-term steady decline in bus travel apparently continued. See the following two charts. (Department for Transport, July 2023 and December 2023)
- In England in 2022, persons aged 17 to 20 made the most bus trips of all age groups: an average of 92 per person for males and 105 per person for females. (National Travel Survey, Department for Transport, December 2023)
- In England in 2022, 38% of schoolchildren ages 11 to 16 travelled to and from secondary school by bus for trips from 2 to under 5 miles each. For trips of 5 miles or more, 44% of secondary school children travelled by bus as well. However, 86% of children aged 5 to 10 and 90% of children aged 11 to 16 walked to and from school for trips less than one mile in length. (National Travel Survey, Department for Transport, December 2023)
- In Great Britain, most bus and coach mileage has been accumulated on urban roads near densely populated areas. However, from 2008 to 2018, bus and coach mileage decreased by 16.2% on urban ‘A’ roads and 34.5% on urban minor roads. Bus traffic on motorways and rural roads also declined. These changes are at least partly due to decreases in local bus mileage outside London over the last decade. See the following chart. (Department for Transport, 2019)
- Londoners still rely on bus transport, but in England outside London, the average number of bus journeys per person per year declined from 54 in 2009 to 46 in 2017. In the period April 2022 to March 2023, bus passenger journeys in London accounted for 52.2% of all passenger journeys made by local buses in England. There were 1.8 billion passenger journeys made by local buses in London in the year ending March 2023, an increase of 19.6% compared with the year ending March 2022. In London, bus use increased from 2005 to 2013 before beginning a gradual decline. (Campaign for Better Transport, 2019; Department for Transport, November 2023)
- Unlike Canada or the United States, Britain does not have a fleet of specially equipped school buses. Instead, a quarter of a million schoolchildren ride transit buses, contracted coaches, mini-buses or taxis to school each school day. (School Bus Fleet, 2019)
- In 2014, in England, 5% of elementary-school children and 29% of secondary-school children regularly took the bus to school. See the following charts.
- In 2022, buses and coaches accounted for 0.7% of motor vehicle miles travelled but were involved in 11.5% of the fatal collisions per billion vehicle miles (bvm). As noted in the previous section Trucking Statistics, buses and coaches had a higher rate of fatal collisions per bvm than either heavy goods vehicles or light goods vehicles. (Department for Transport, 2019)
- In Great Britain in 2023, 83.9% of the vehicles operated by local bus operators were buses, 11.9% were coaches, and 4.2% were minibuses. Since 2005, the proportion of buses has increased, and the proportion of coaches has decreased. The proportion of coaches had been declining even before the pandemic years of 2000 and 2021, but this trend was further exacerbated in those years. See the following chart. (Department for Transport, November 2023)
- In Great Britain in 2023, 76.8% of buses still run on diesel fuel. In most individual areas of Great Britain, most buses still run on diesel fuel as well. The major exception is London, where only 46.0% of buses run on diesel fuel. The other buses in Britain use a variety of other fuels, of which diesel-hybrid is evidently the most popular, especially in London. See the following chart. (Department for Transport Annual Survey, November 2023)
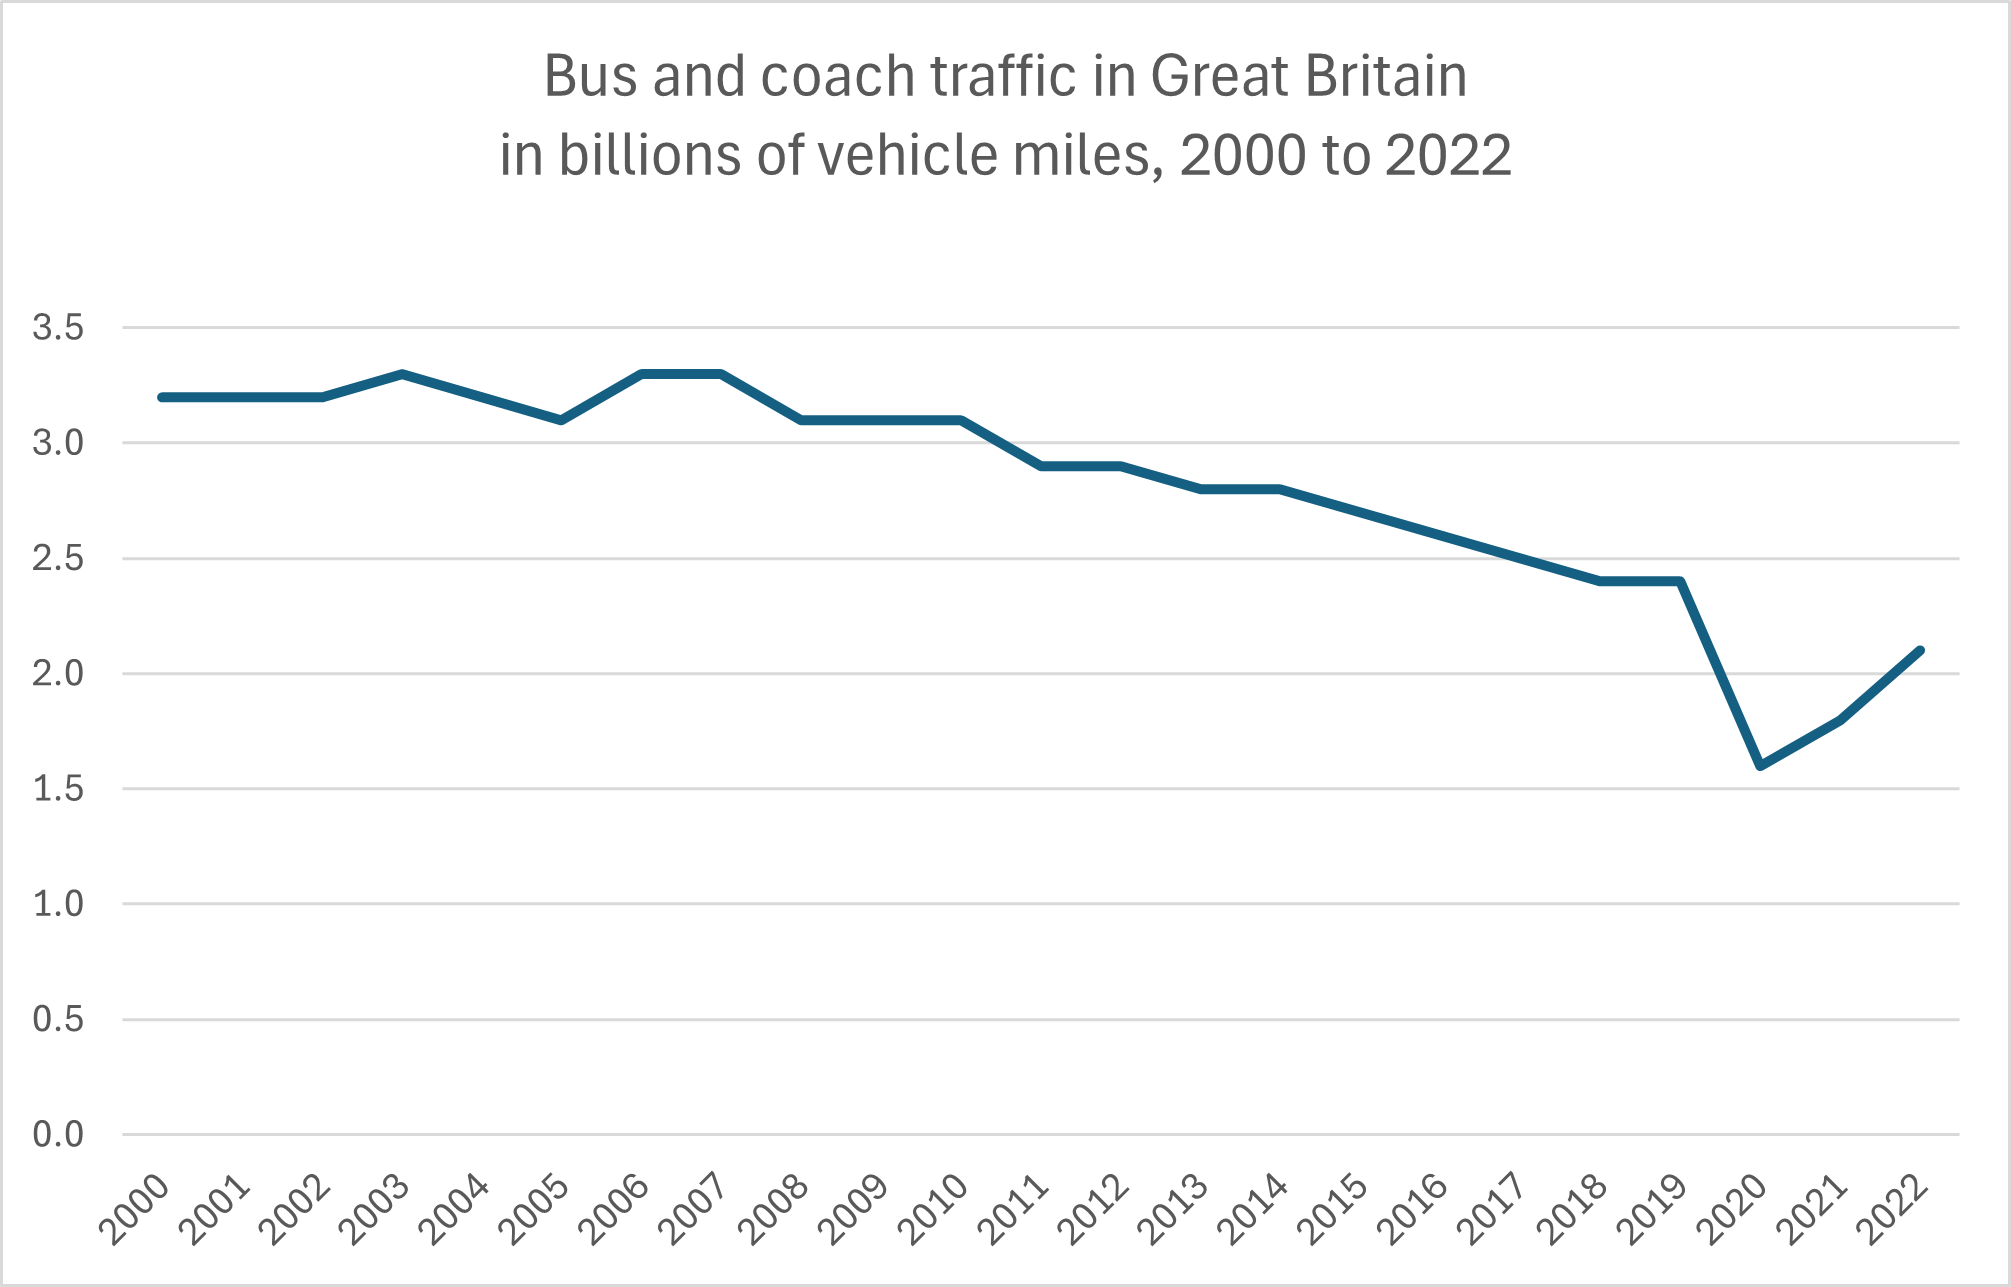
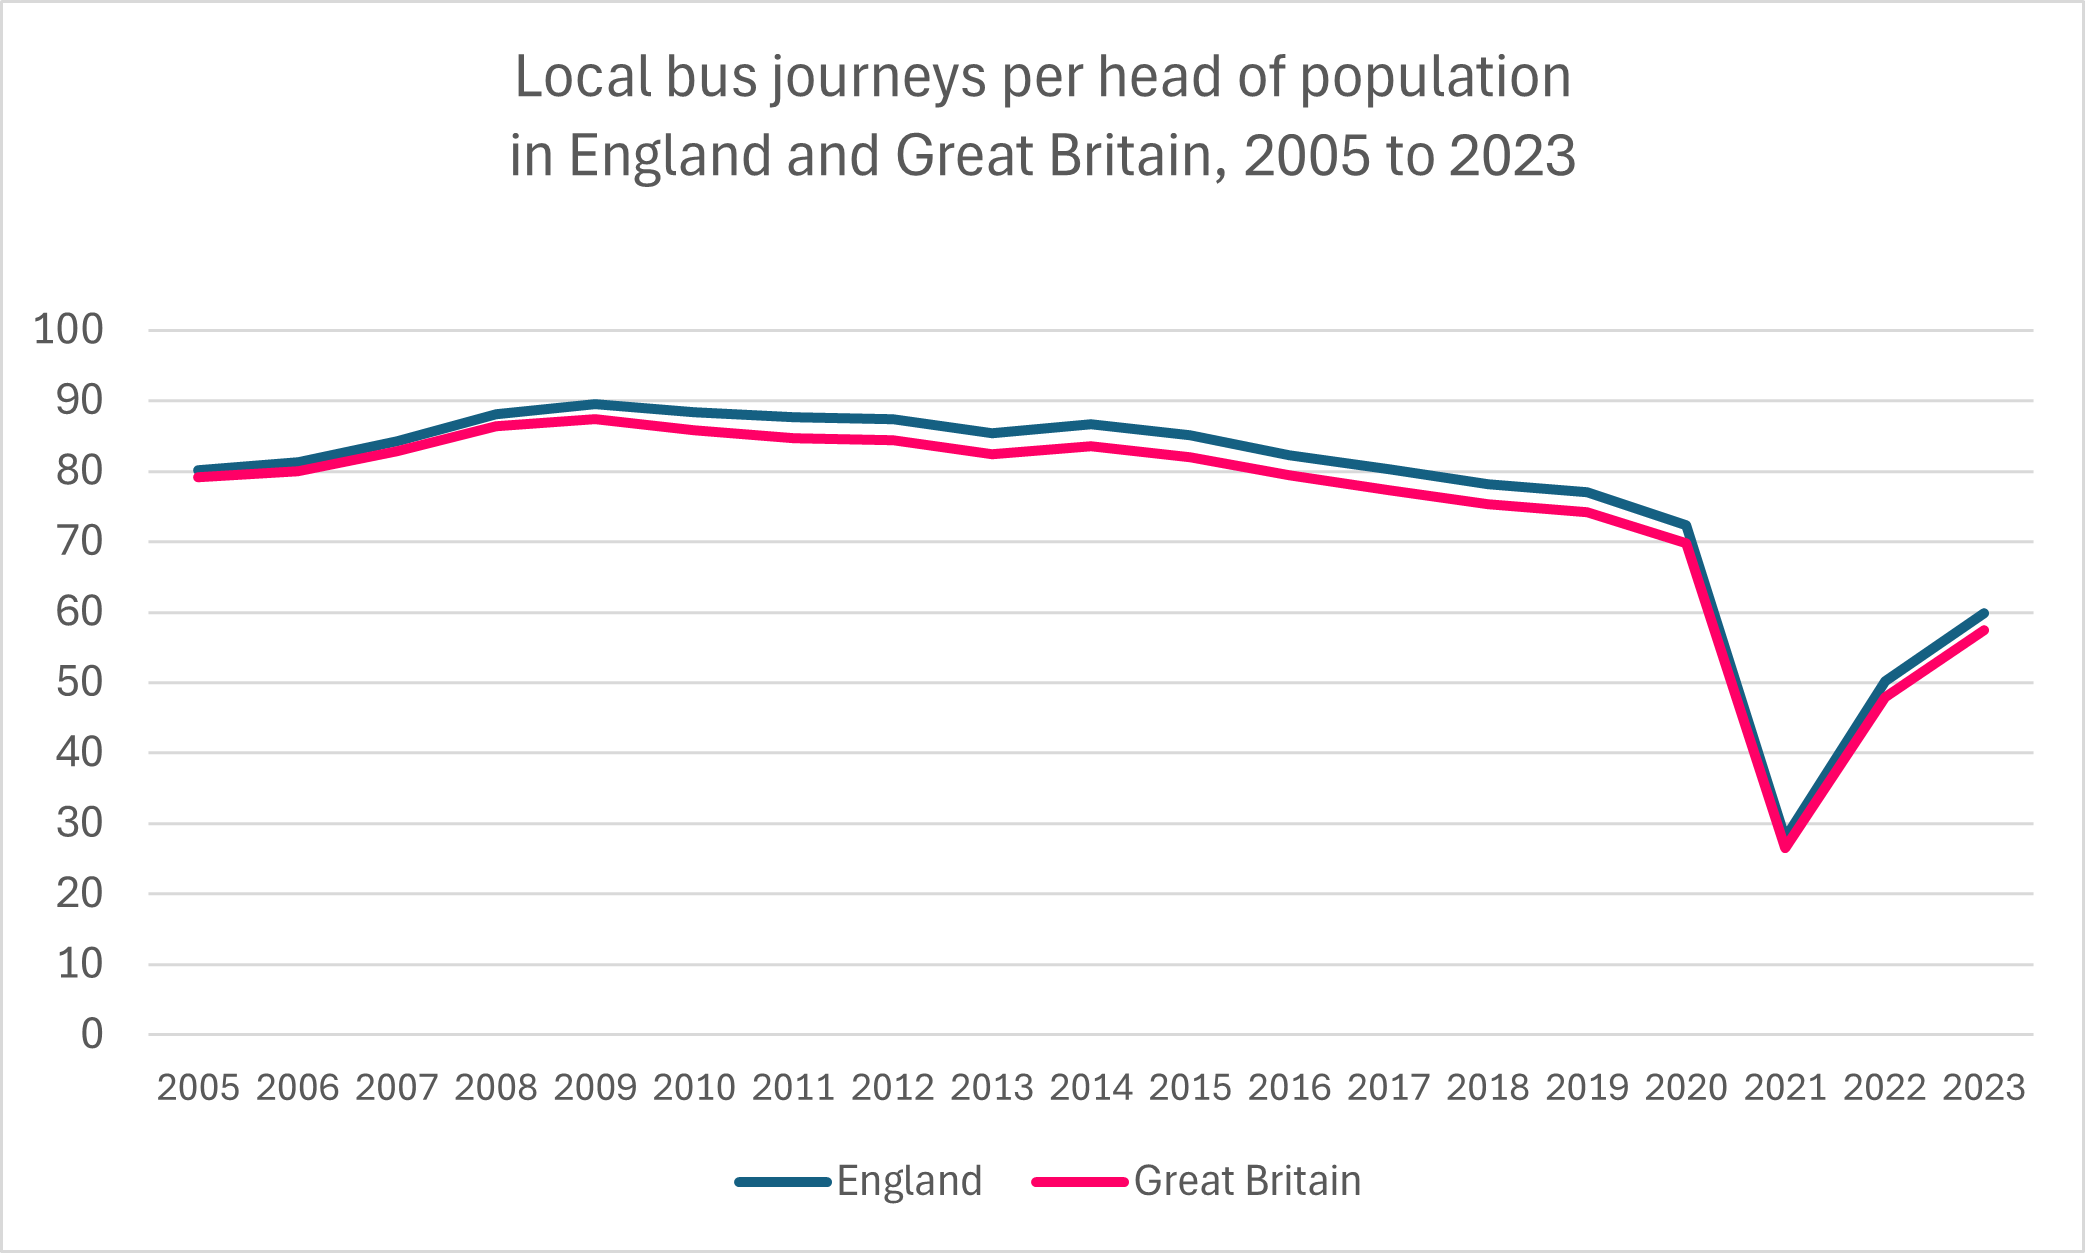
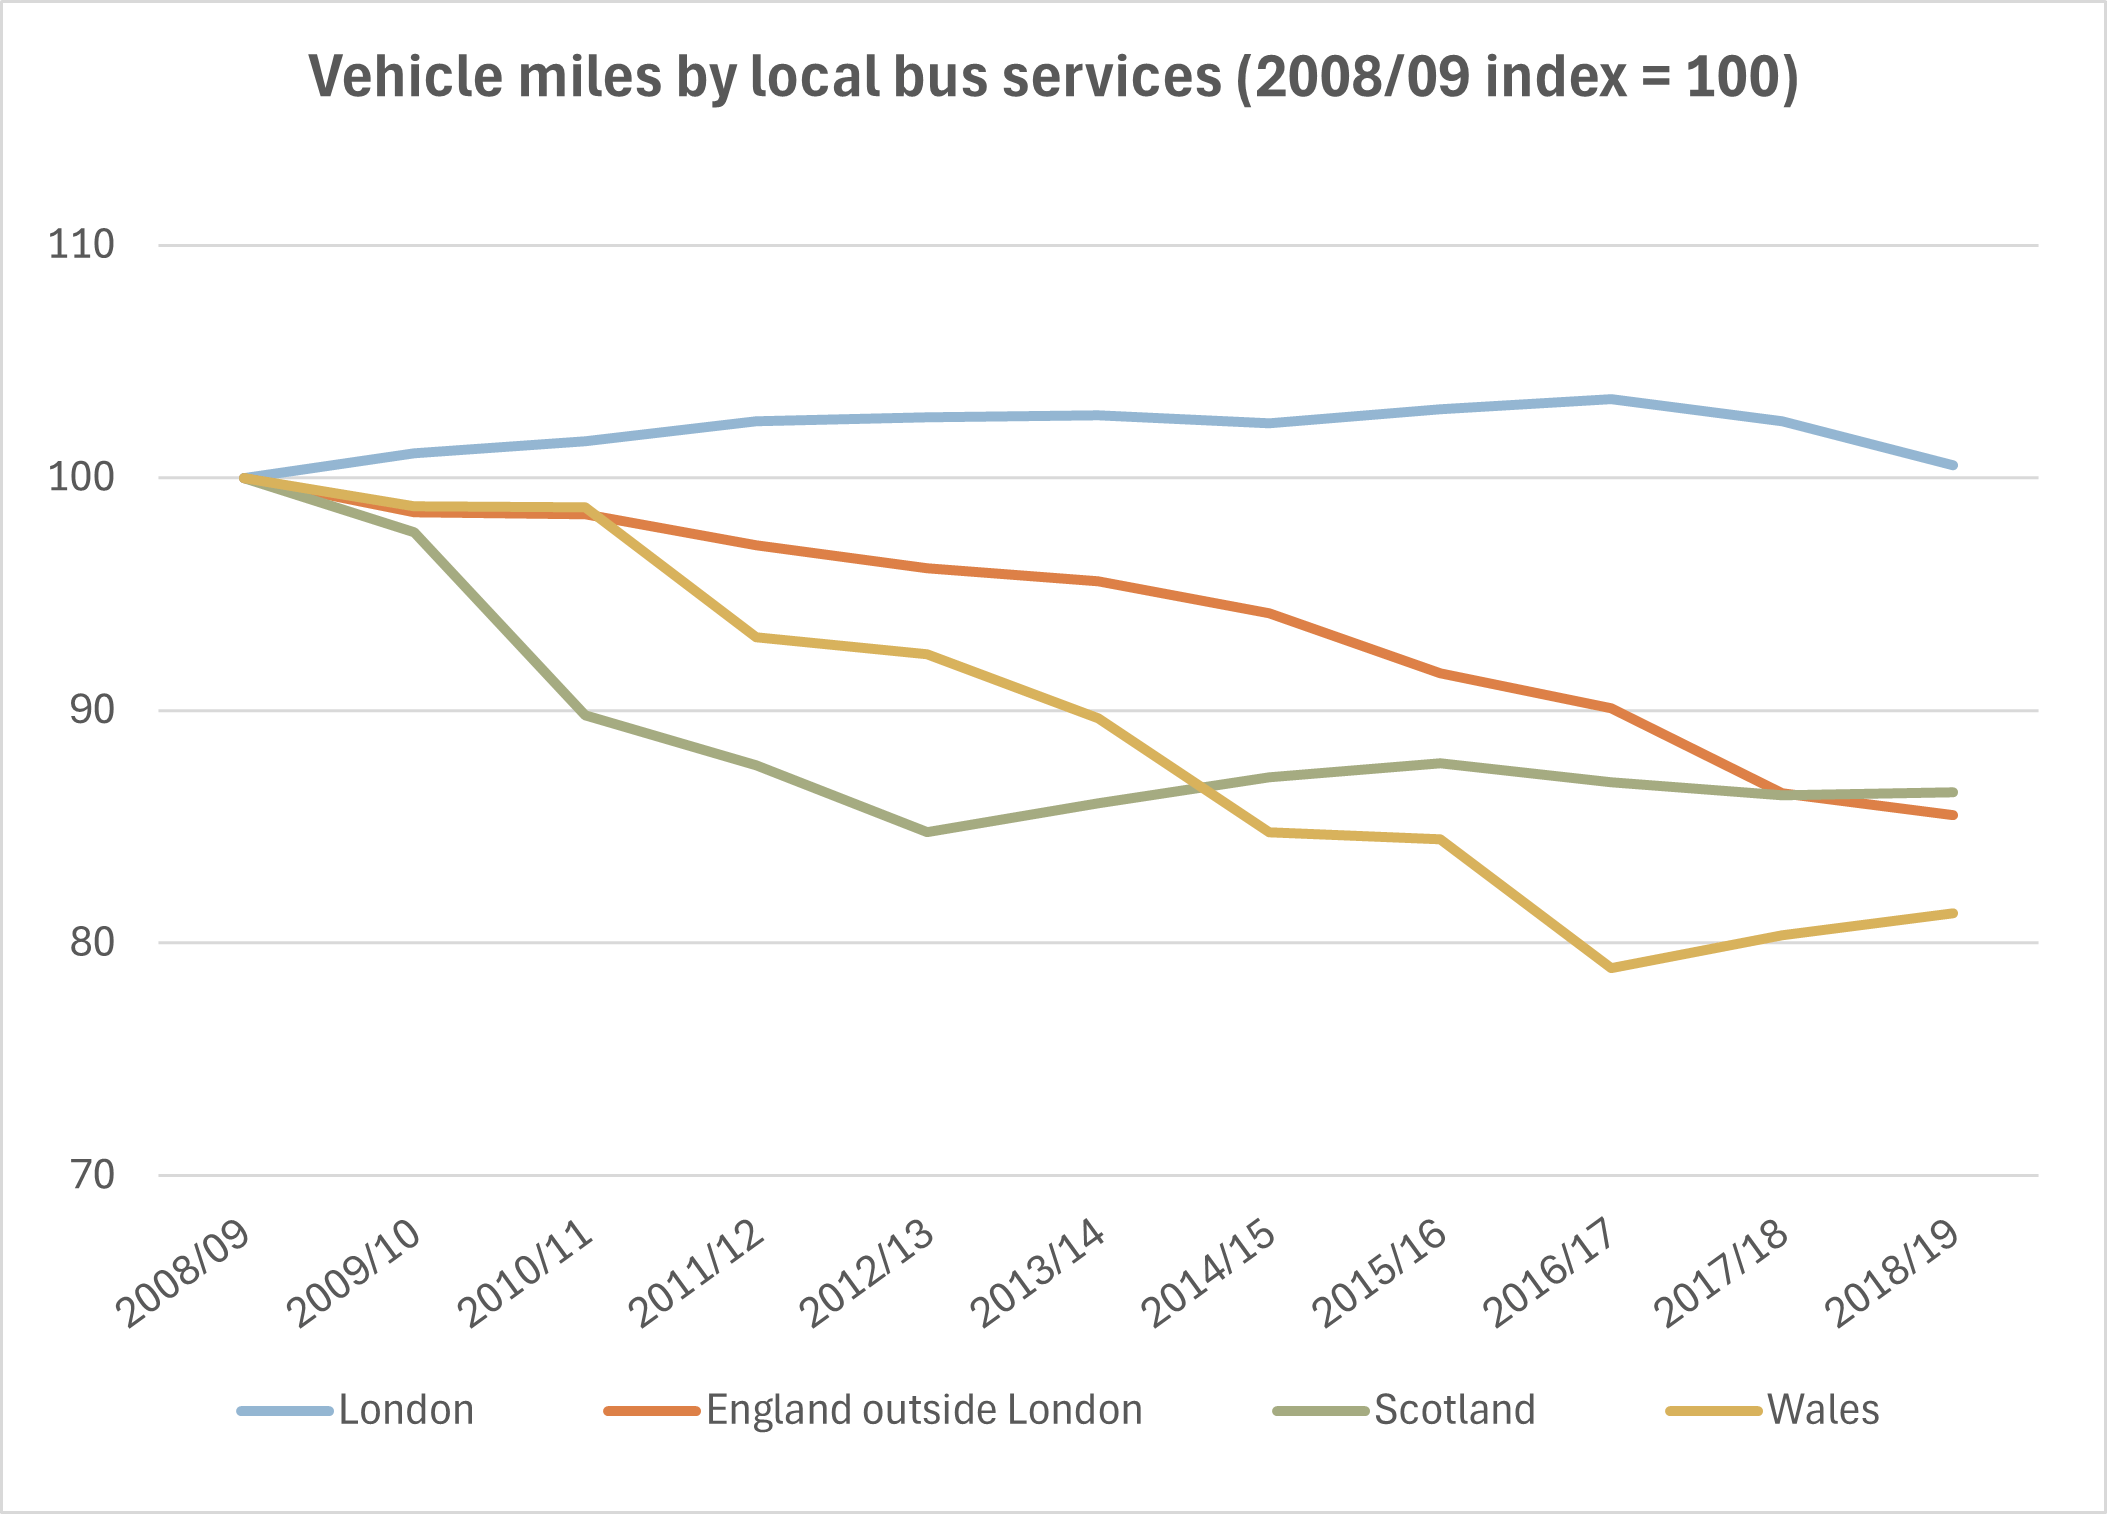
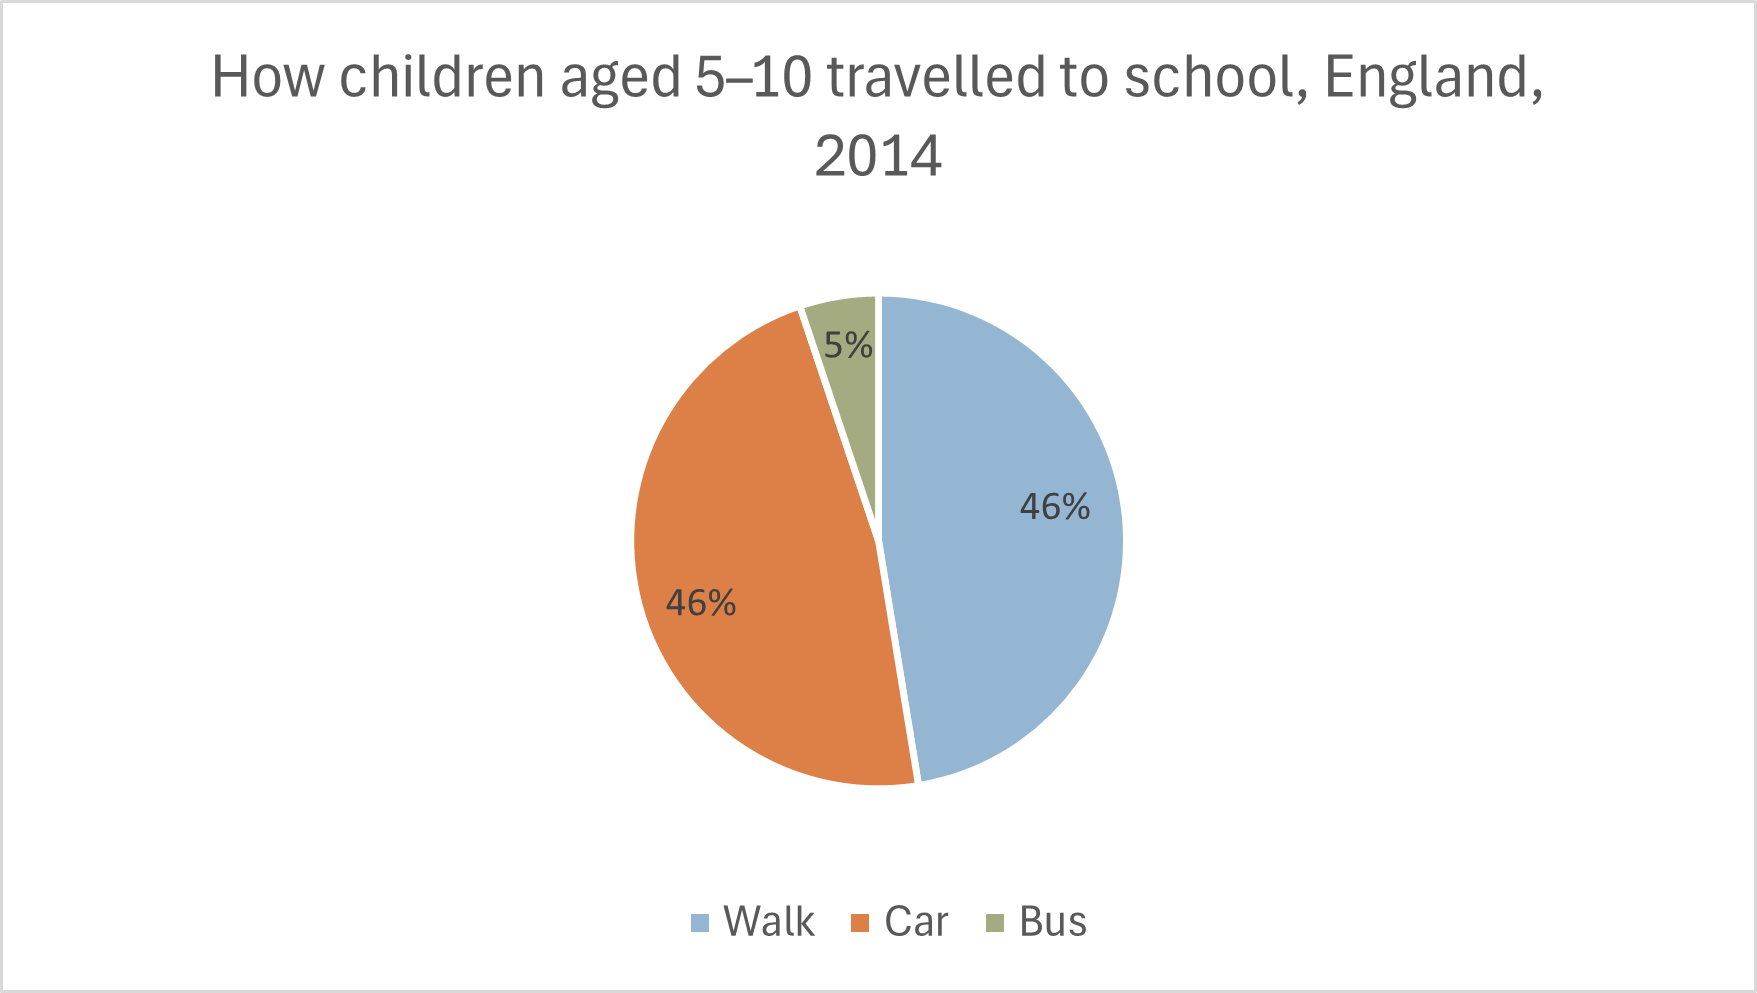
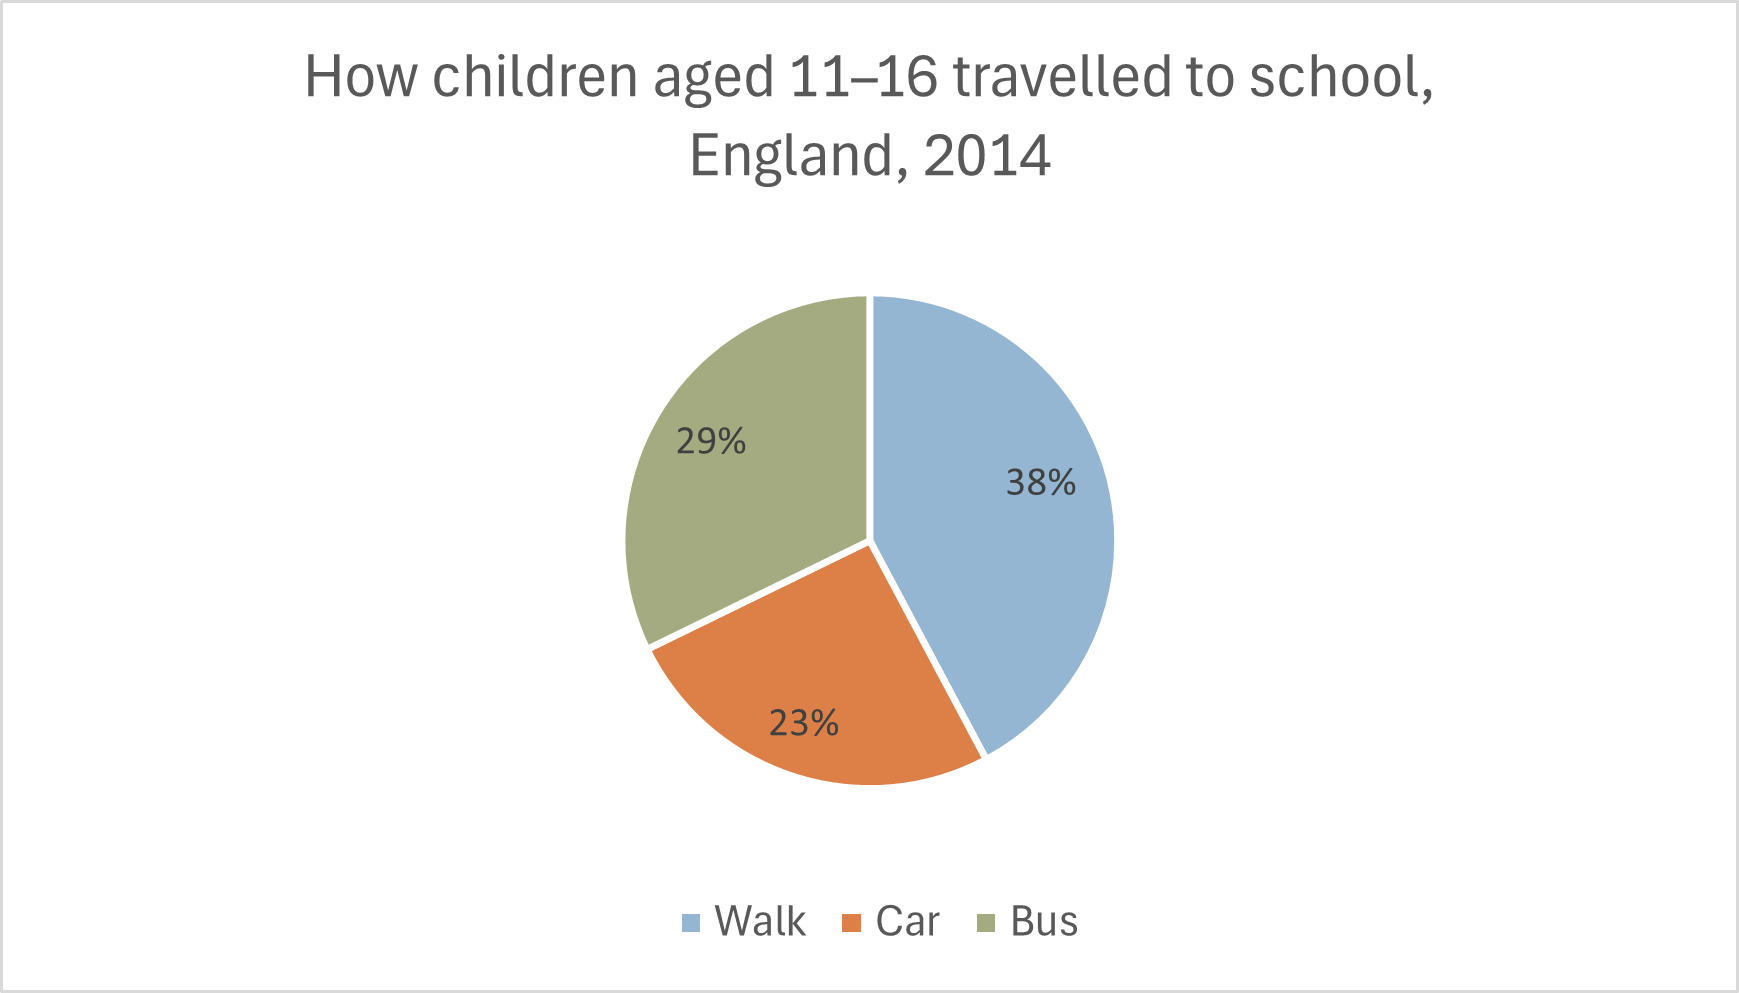
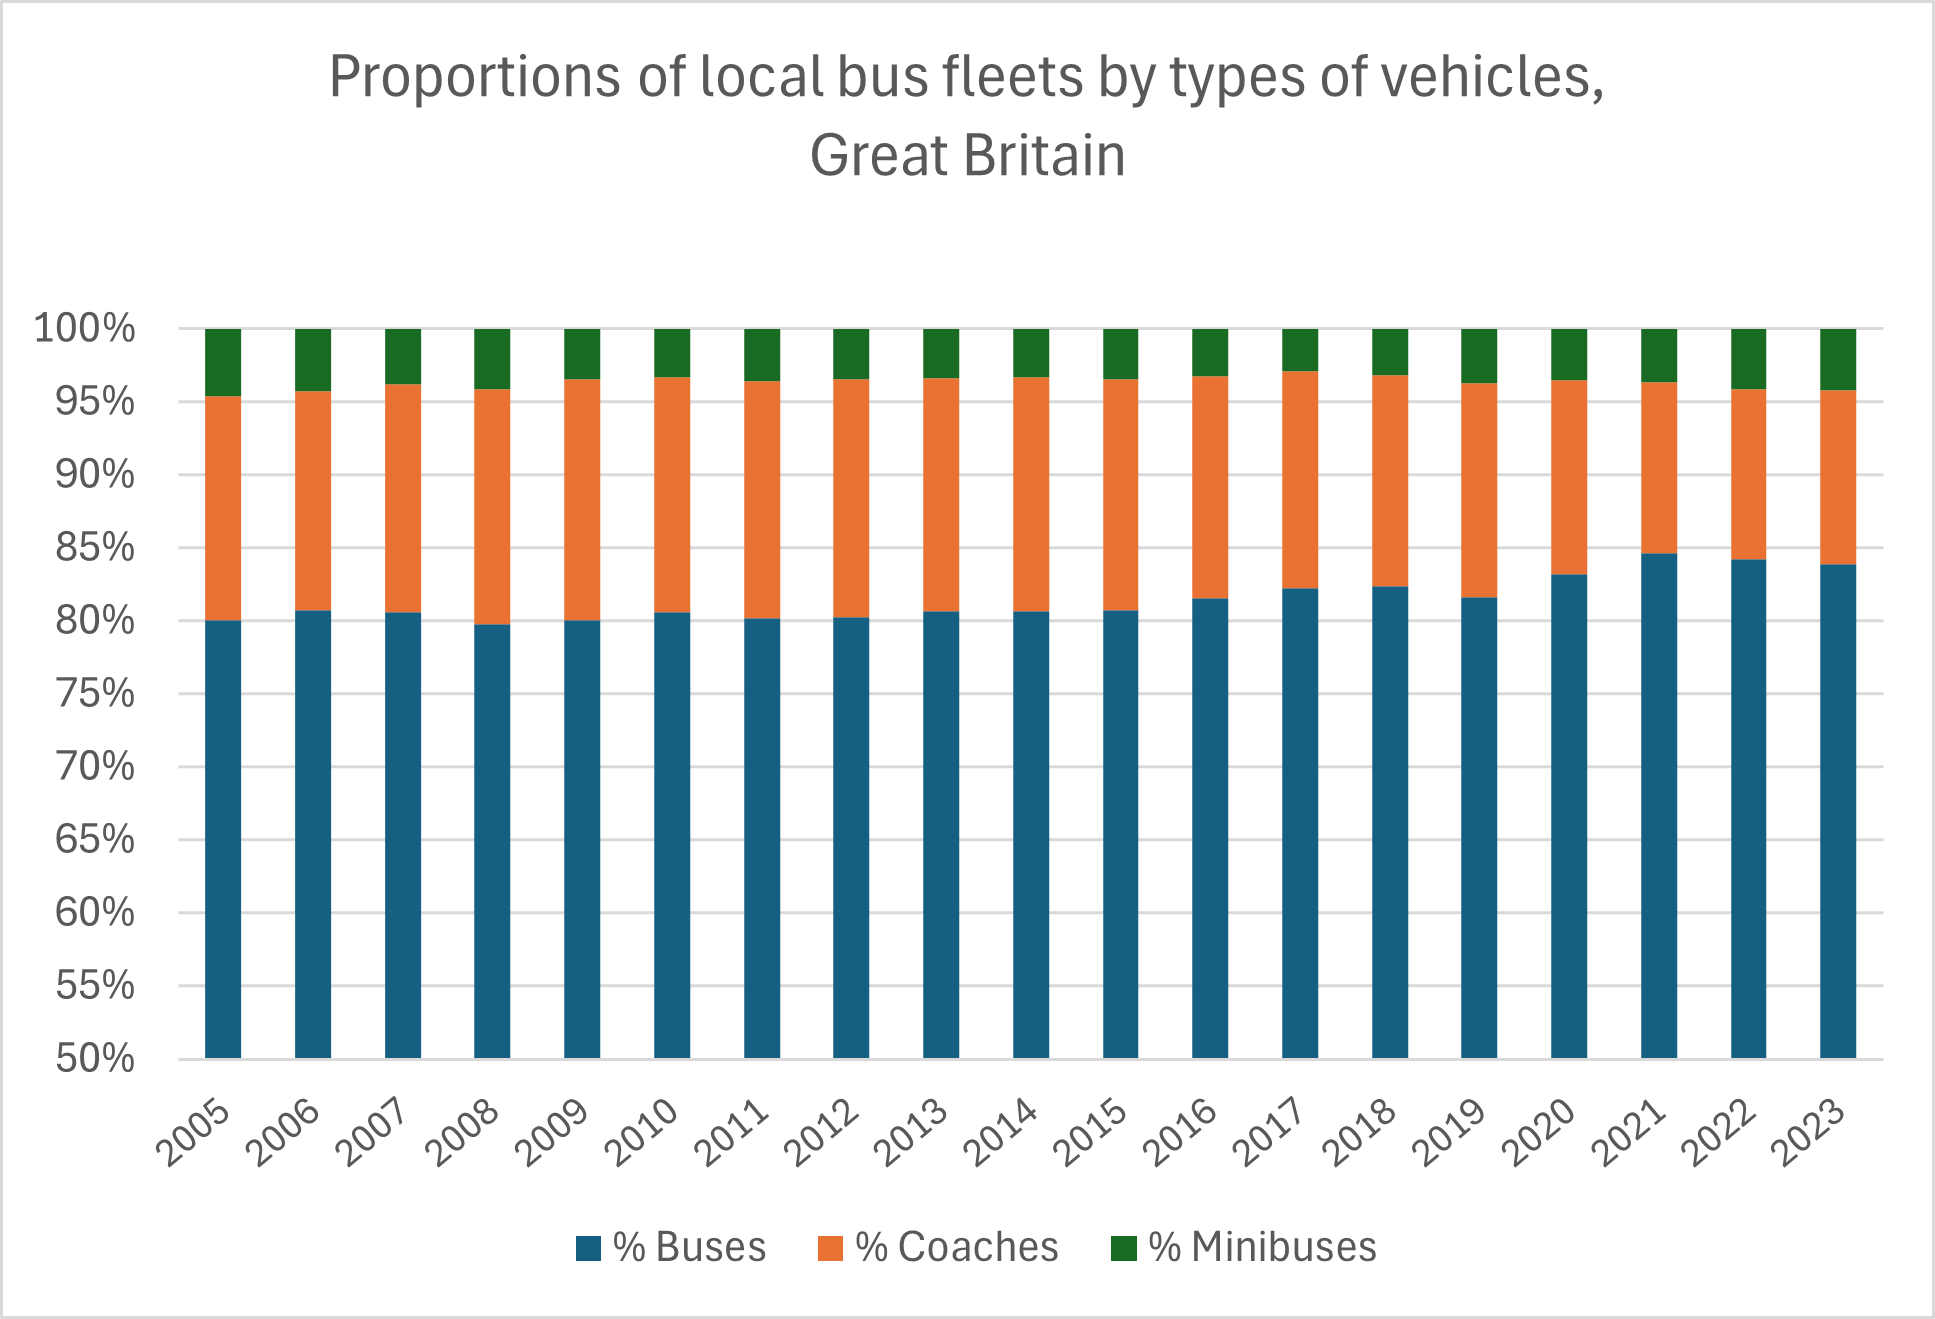
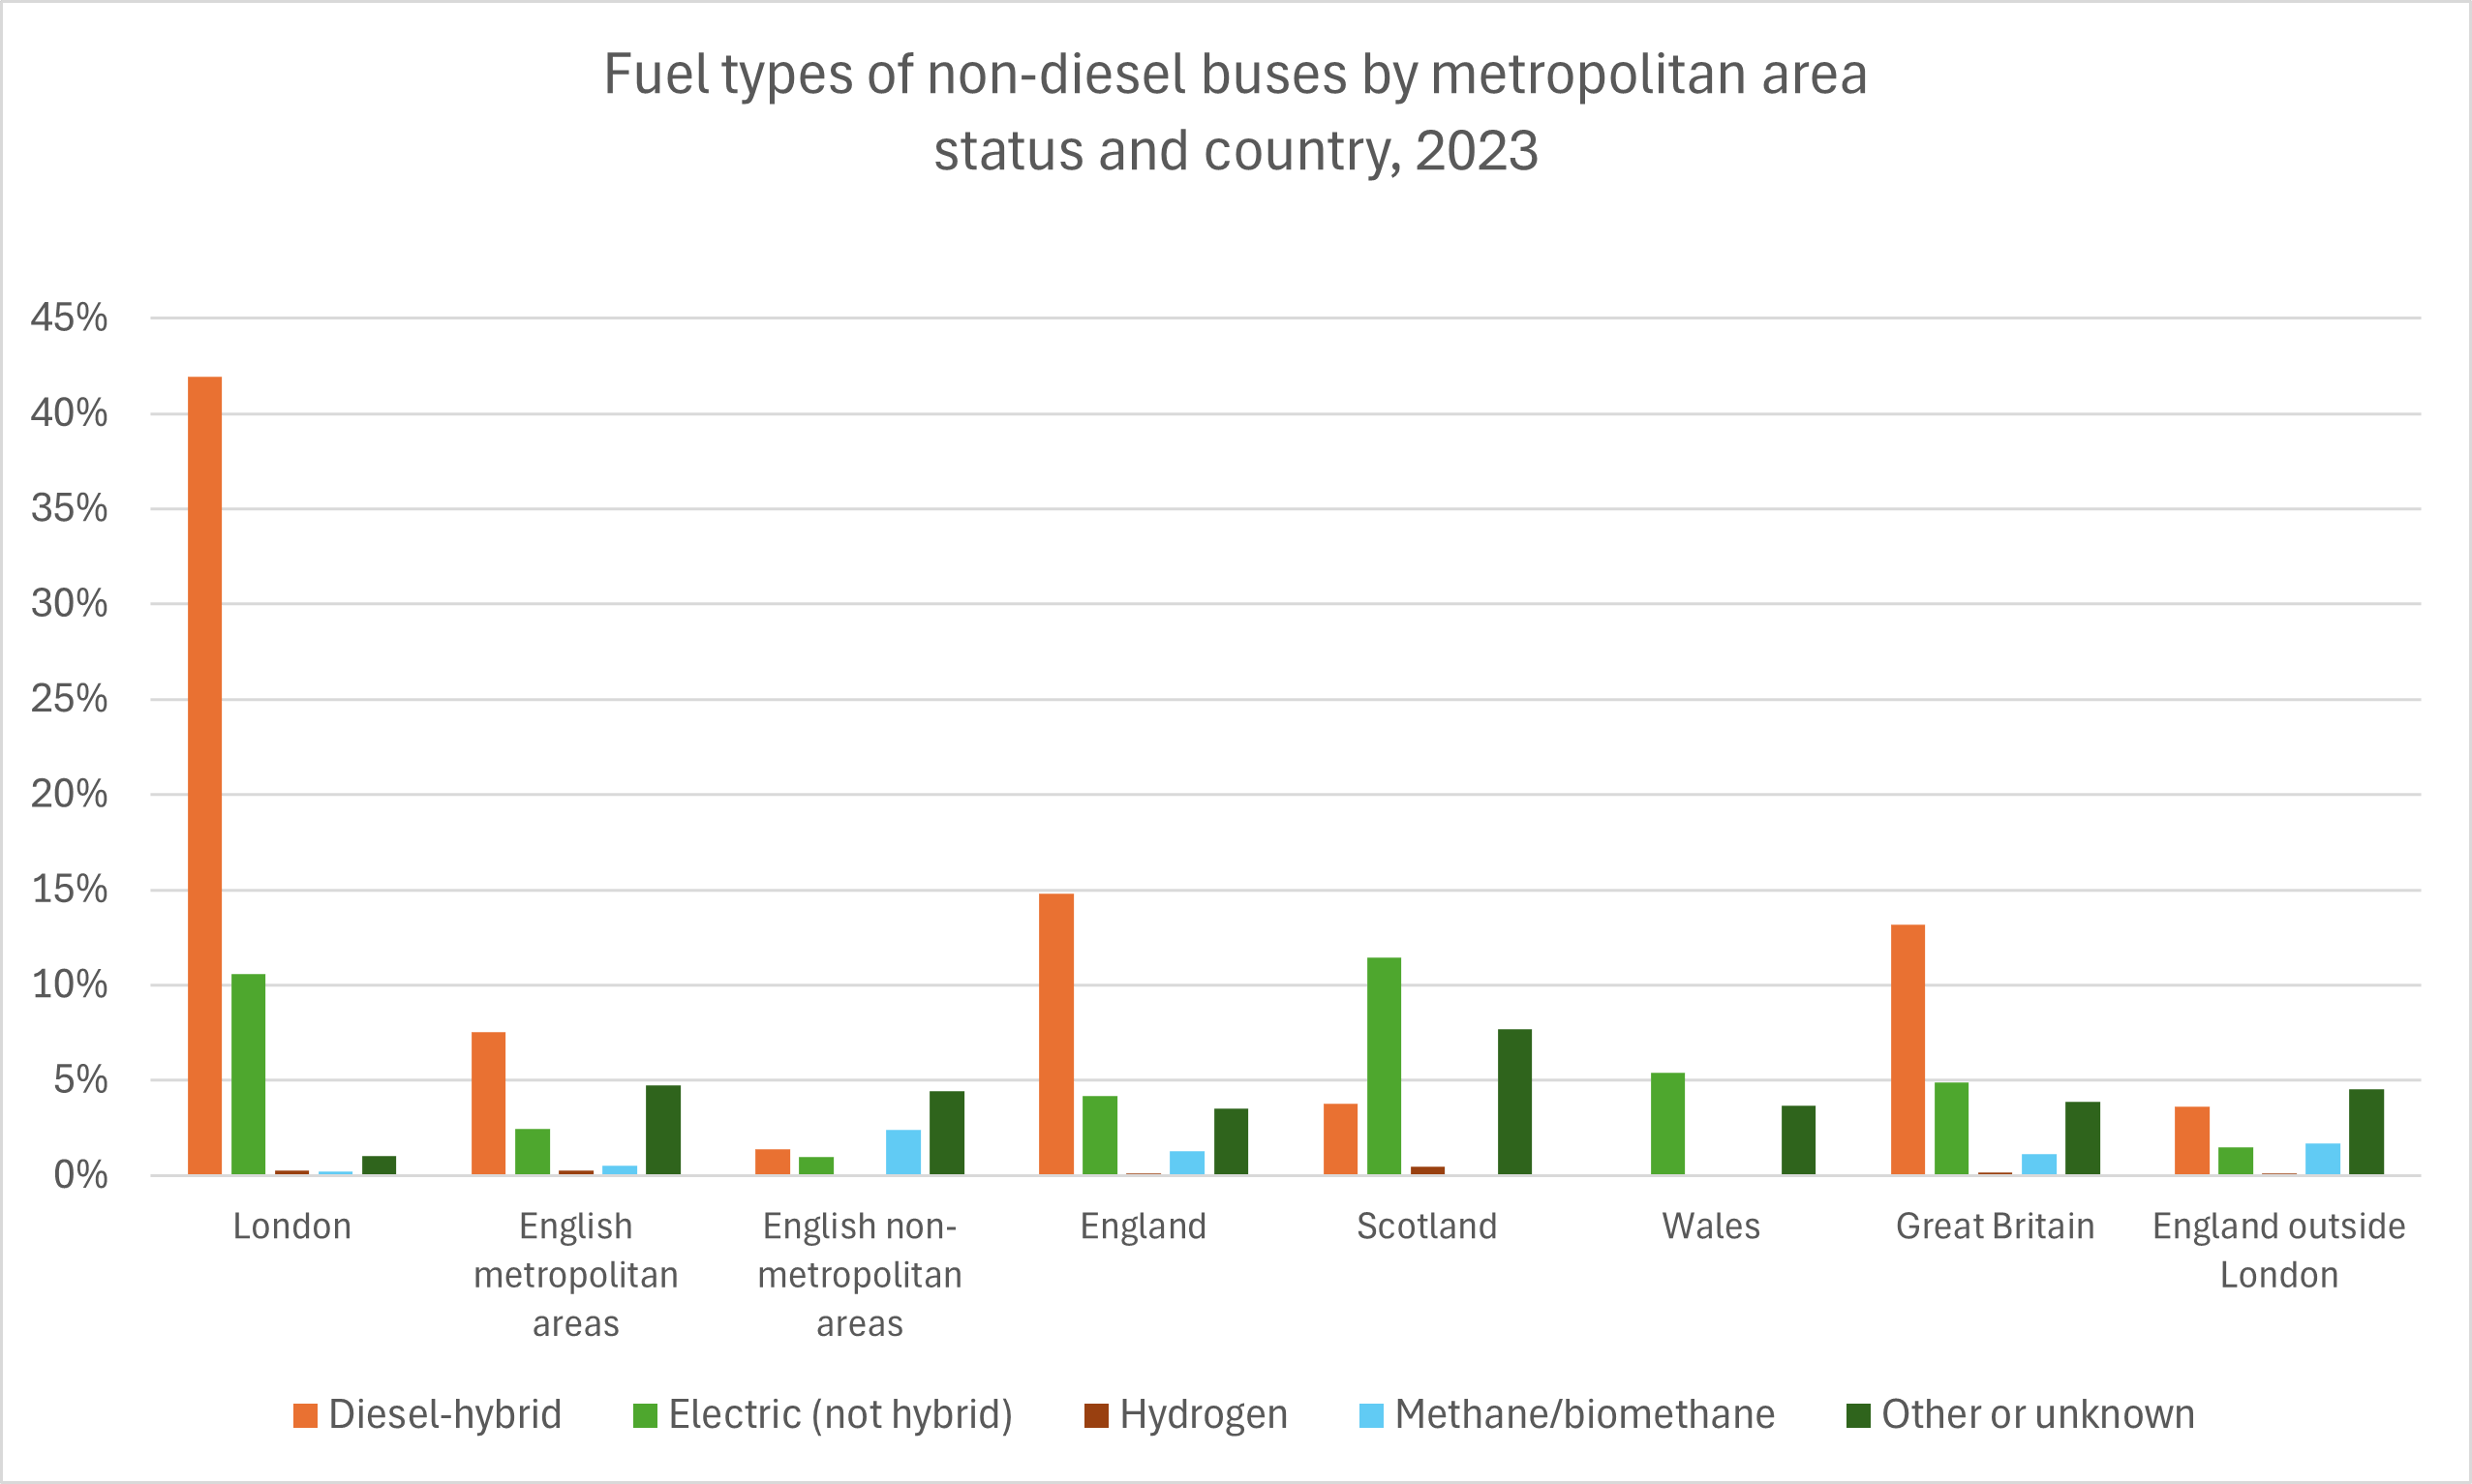
Taxi and Private Hire Vehicles
Note: In the United Kingdom, a “taxi” (also known as a “hackney carriage”) is a vehicle that can either be hired immediately (such as by being hailed in the street) or pre-booked. A “private hire vehicle” (also known as a “minicab”) must be pre-booked. The Department for Transport statistics include ridesharing vehicles (such as Uber) within the category of private hire vehicles. (Department for Transport, 2017)
- Note: In the United Kingdom, a ‘taxi’ (also known as a ‘hackney carriage’) is a vehicle that can either be hired immediately (such as by being hailed in the street) or pre-booked. A ‘private hire vehicle’ (also known as a ‘minicab’) must be pre-booked. The Department for Transport statistics include ridesharing vehicles (such as Uber) within the category of private hire vehicles. (Department for Transport, 2017)
- In England, the total number of licensed taxis and private hire vehicles increased from 184,500 in 2005 to 298,600 in 2020, a new record. In 2021 during the COVID pandemic, the total number of these vehicles fell to 251,100, the lowest level since 2015, before largely recovering to 289,400 in 2023. In 2023, 80.2% of these licensed vehicles were private hire vehicles; the rest were taxis. The number of drivers licensed to drive taxis or private hire vehicles followed a similar pattern: The number of drivers increased from 242,100 in 2005 to 364,700 in 2020, also a new record. Then it fell to 342,100 in 2021 before largely recovering to 346,300 in 2023. See the following chart. (Department for Transport, July 2023; Taxi and PHV Licensing Authorities, July 2023)
- From 2015 to 2017, the number of licensed private hire vehicles in England increased by 23.6%. In London, licensed private hire vehicles increased by 39% to 87,400.
- In England in 2023, there was an average of 5.1 licensed taxi and private hire vehicles (PHVs) per 1,000 people: 1.0 licensed taxis and 4.1 licensed PHVs per 1,000 people. In London, the average was 11.9 licensed vehicles per 1,000 people: 1.7 taxis and 10.2 PHVs. In mainly rural areas, there were 1.0 licensed taxis and 1.5 licensed PHVs. Generally, the total number of available licensed taxis and PHVs per 1,000 people tends to be higher in urban areas, and the preponderance of PHVs relative to taxis also tends to be greater in urban areas. See the following chart. (Department for Transport, July 2023; Taxi and PHV Licensing Authorities, July 2023)
- In England in March 2023, the three most common fuel types of taxis were diesel (74.3%), range extended electric (13.5%), and hybrid electric (6.6%). The three most common fuel types of private hire vehicles (PHVs) were diesel (46.6%), hybrid electric (31.6%), and plug-in hybrid electric (8.8%). (Department for Transport (DfT) and Driver and Vehicle Licensing Agency (DVLA), July 2023)
- In March 2024, the average annual salary of a taxi driver in the UK was £23,645 or a wage of £11 per hour, plus an average annual bonus of £468. The annual salary range was between £18,018 (25th percentile) and £27,476 (75th percentile). The average annual salary is expected to rise to £30,527 by 2029, a 29% increase. Taxi drivers in London got paid significantly more: £30,595 per year or a wage of £15 per hour, plus an annual bonus of £606. The annual salary range in London was between £23,313 and £35,551. (Economic Research Institute, March 2024)
- In January 2024, Glassdoor stated the base pay annual salary range for private higher vehicle drivers at that time was £21,000 to £34,000 with an average of £30,000, plus additional annual cash compensation of between £861 and £19,847 with an average of £4,144.
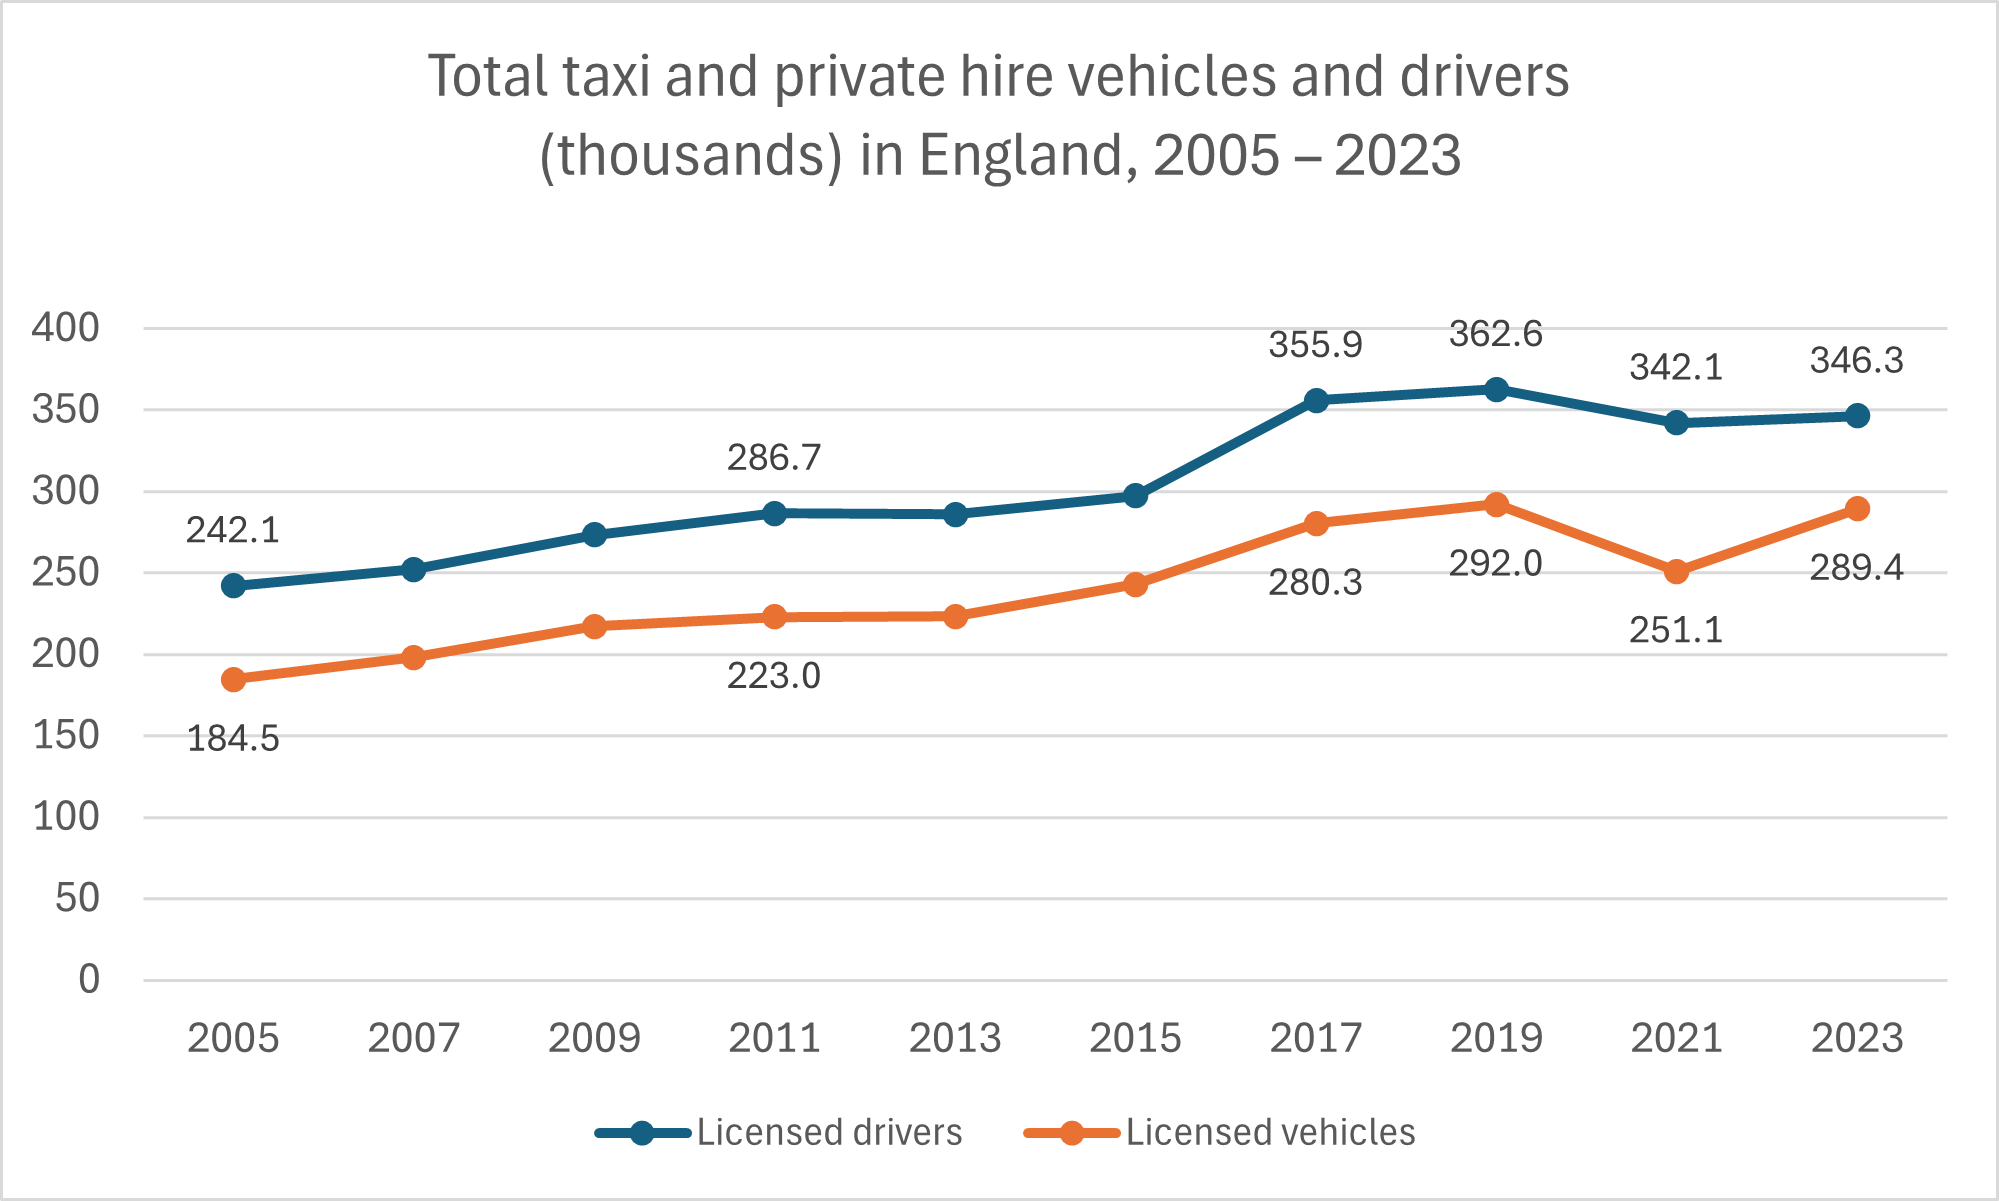
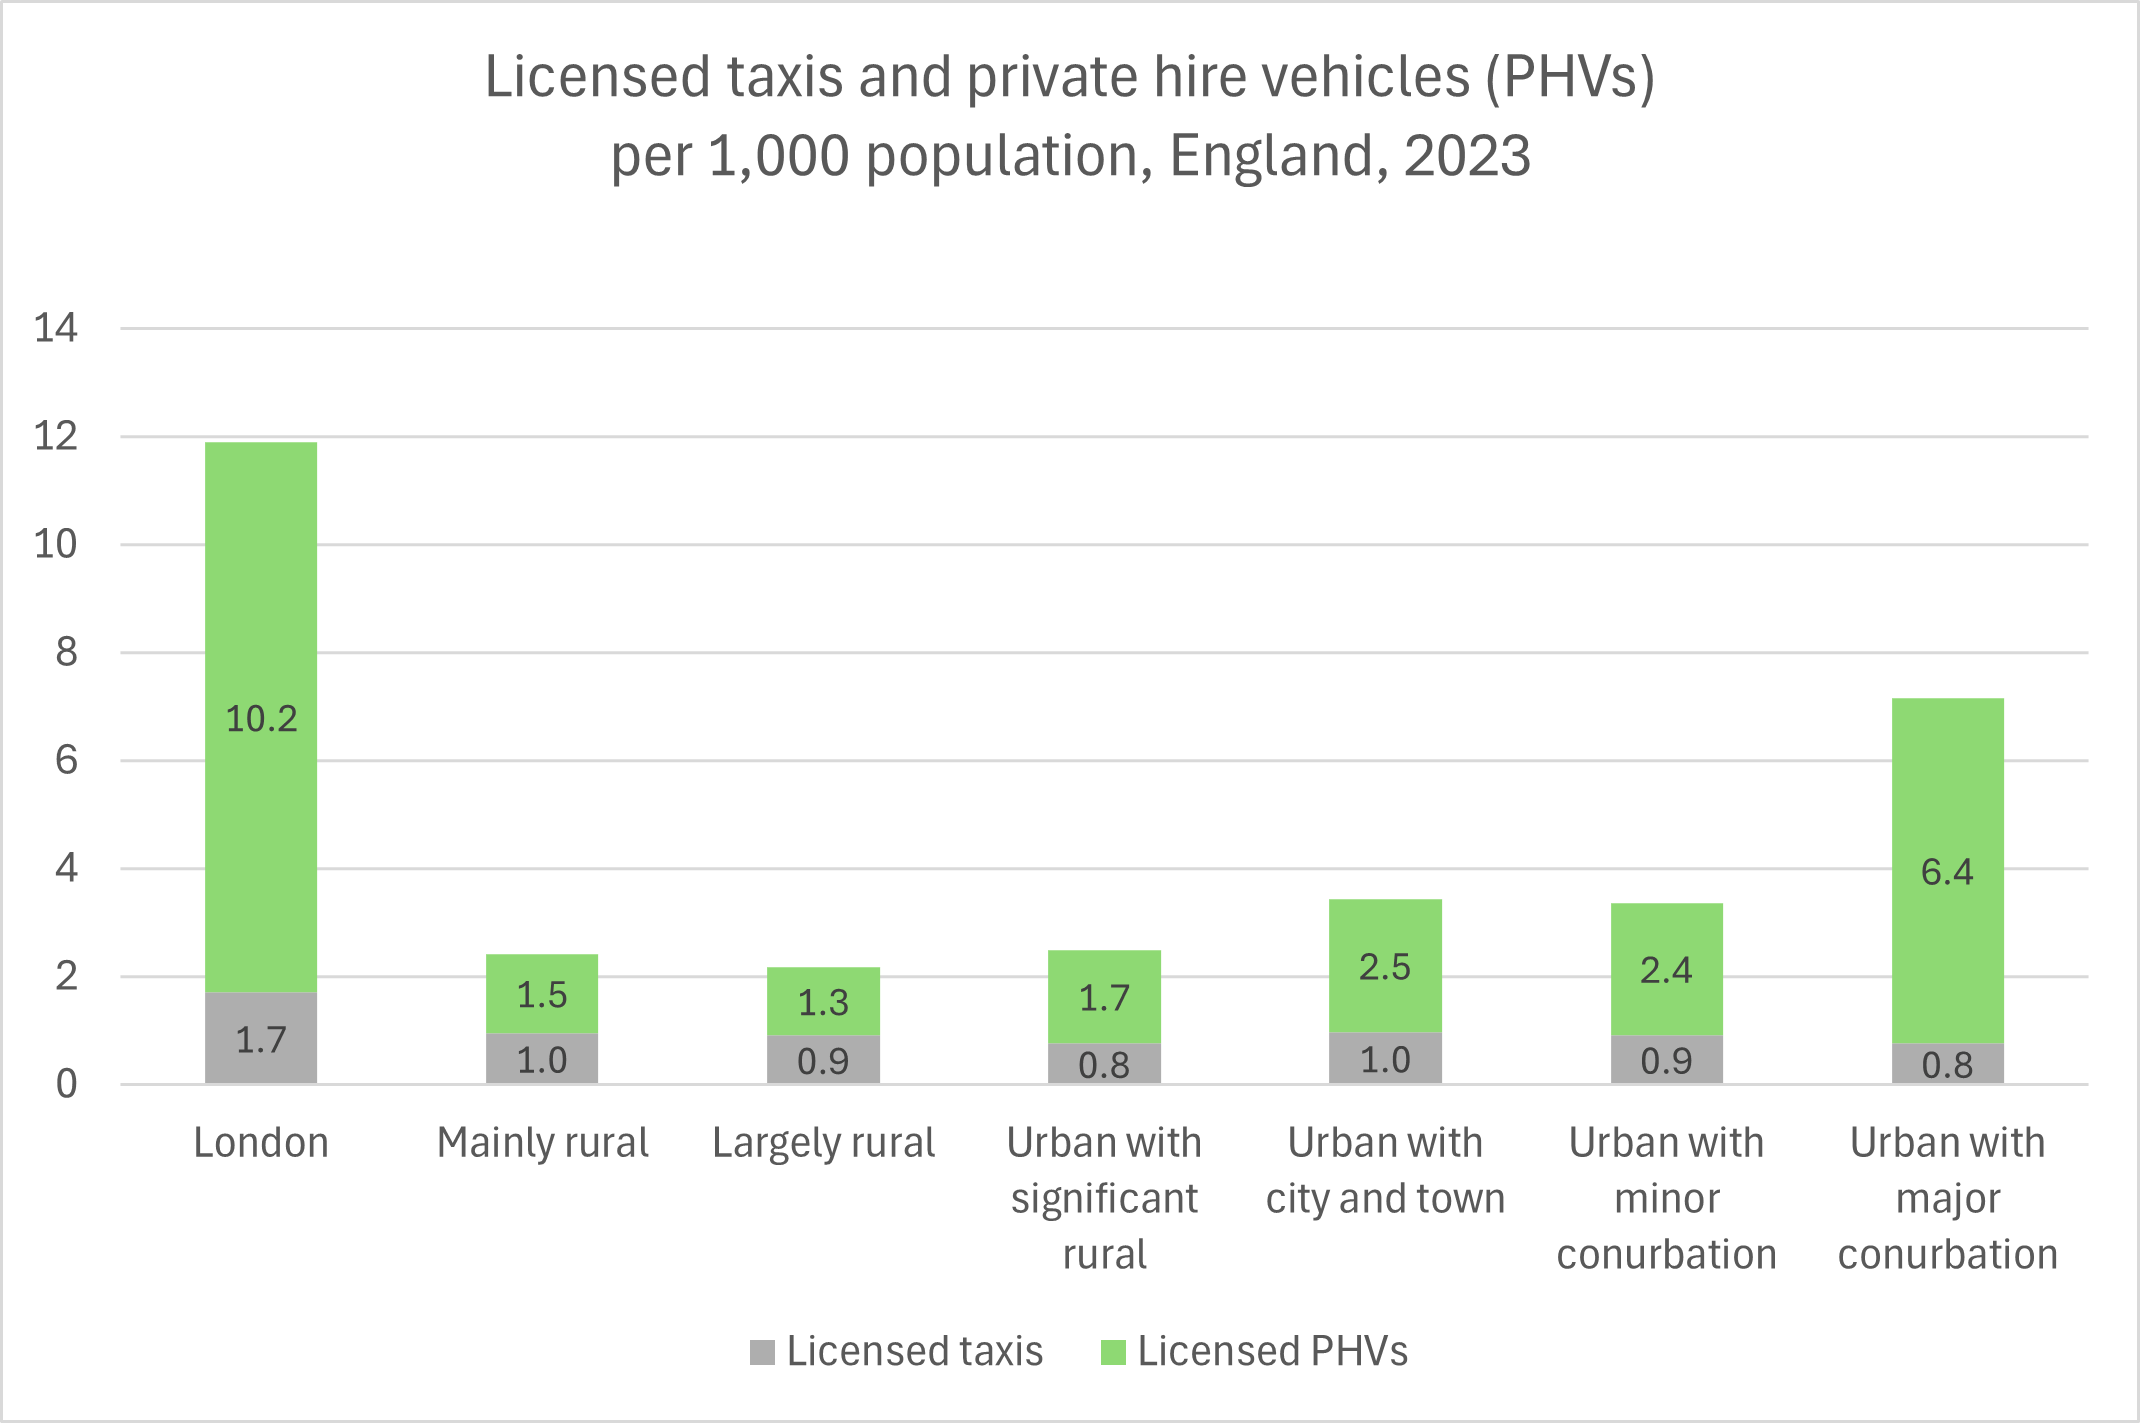
- In previous sections, we noted that the years 2020 and 2021 were evidently associated with a variety of sudden and sharp changes in travel, transport, and road user behaviour. Some of these changes exacerbated prior longer-term trends, whereas other changes reversed longer-term trends. Changes in public attitudes towards travel because of the COVID-19 pandemic were likely responsible.
- To begin with, UK households were spending less overall, and the proportions of what they were spending on had shifted. In 2020 Q2, total household expenditure was about 24% less than it had been in 2019 Q2. Spending on some sectors related to travel declined much further, shifting the mix of total household spending. As examples, expenditure on the transport sector declined by 65%, and expenditure on the restaurants and hotels sector declined by a remarkable 81%. Before the COVID pandemic, total household expenditure and spending on these two sectors had been rising rather steadily for years. See the following chart. (Office for National Statistics, December 2023)
- Secondly, a series of four UK-wide surveys (each involving about 4,000 participants) and associated follow-up in-depth qualitative interviews conducted by the Department for Transport during the pandemic showed how and why public attitudes towards travel had changed. The 2020 lockdowns, of course, greatly affected travel and the public’s attitude towards it. 53% of those in work said they worked from home, compared with only 38% before the pandemic who said their employers allowed it. 82% did fewer shopping trips than before the pandemic, and 59% purchased products online that they would have purchased in-store before the pandemic. 35% cancelled their upcoming plane flights, and 34% cancelled their planned long-distance car trips. 20% cancelled their plans to travel by train for leisure. And 70% of respondents said they would not be comfortable traveling by public transport. (Department for Transport, June 2020)
- Follow-up qualitative interviews of selected respondents from 21 September 2020 to 7 October 2020 found that traditional issues surrounding public transport, such as speed, cost, availability, and reliability were still the most important concerns of the respondents. However, the pandemic had made these interviewees more conscious of their surroundings than they had been before the pandemic. As COVID restrictions eased, public transport became more crowded again and social distancing became more difficult, which respondents feared could increase the risk of transmitting COVID. Participants who had started driving more than before the pandemic said they saw the car as a personal safe space. Other participants had started walking to destinations instead of taking public transport. (Department for Transport, October 2020)
- On the other hand, respondents viewed active transport (walking and pedal cycling) more favourably than before. During the first lockdown, 78% of them walked for exercise, 29% engaged in jogging or running for exercise, and 21% of them cycled. As we noted in the section Driver Demographics, walking did increase significantly during the pandemic, while use of public transport (especially buses) decreased sharply. (Department for Transport, October 2020)
- As restrictions eased and COVID anxiety eased somewhat, people became more willing to consider public transport than they had earlier in the pandemic, but still less willing than before the pandemic. For example, from April/May 2020 to June/July 2020, confidence in taking the bus increased from 19% to 30%, but far more people were still reluctant to take the bus than they had been in 2019. This may be why, as noted in the section Driver Demographics, bus travel has not recovered as well from the 2020 and 2021 pandemic years as car travel has. (Department for Transport, July – August 2020)
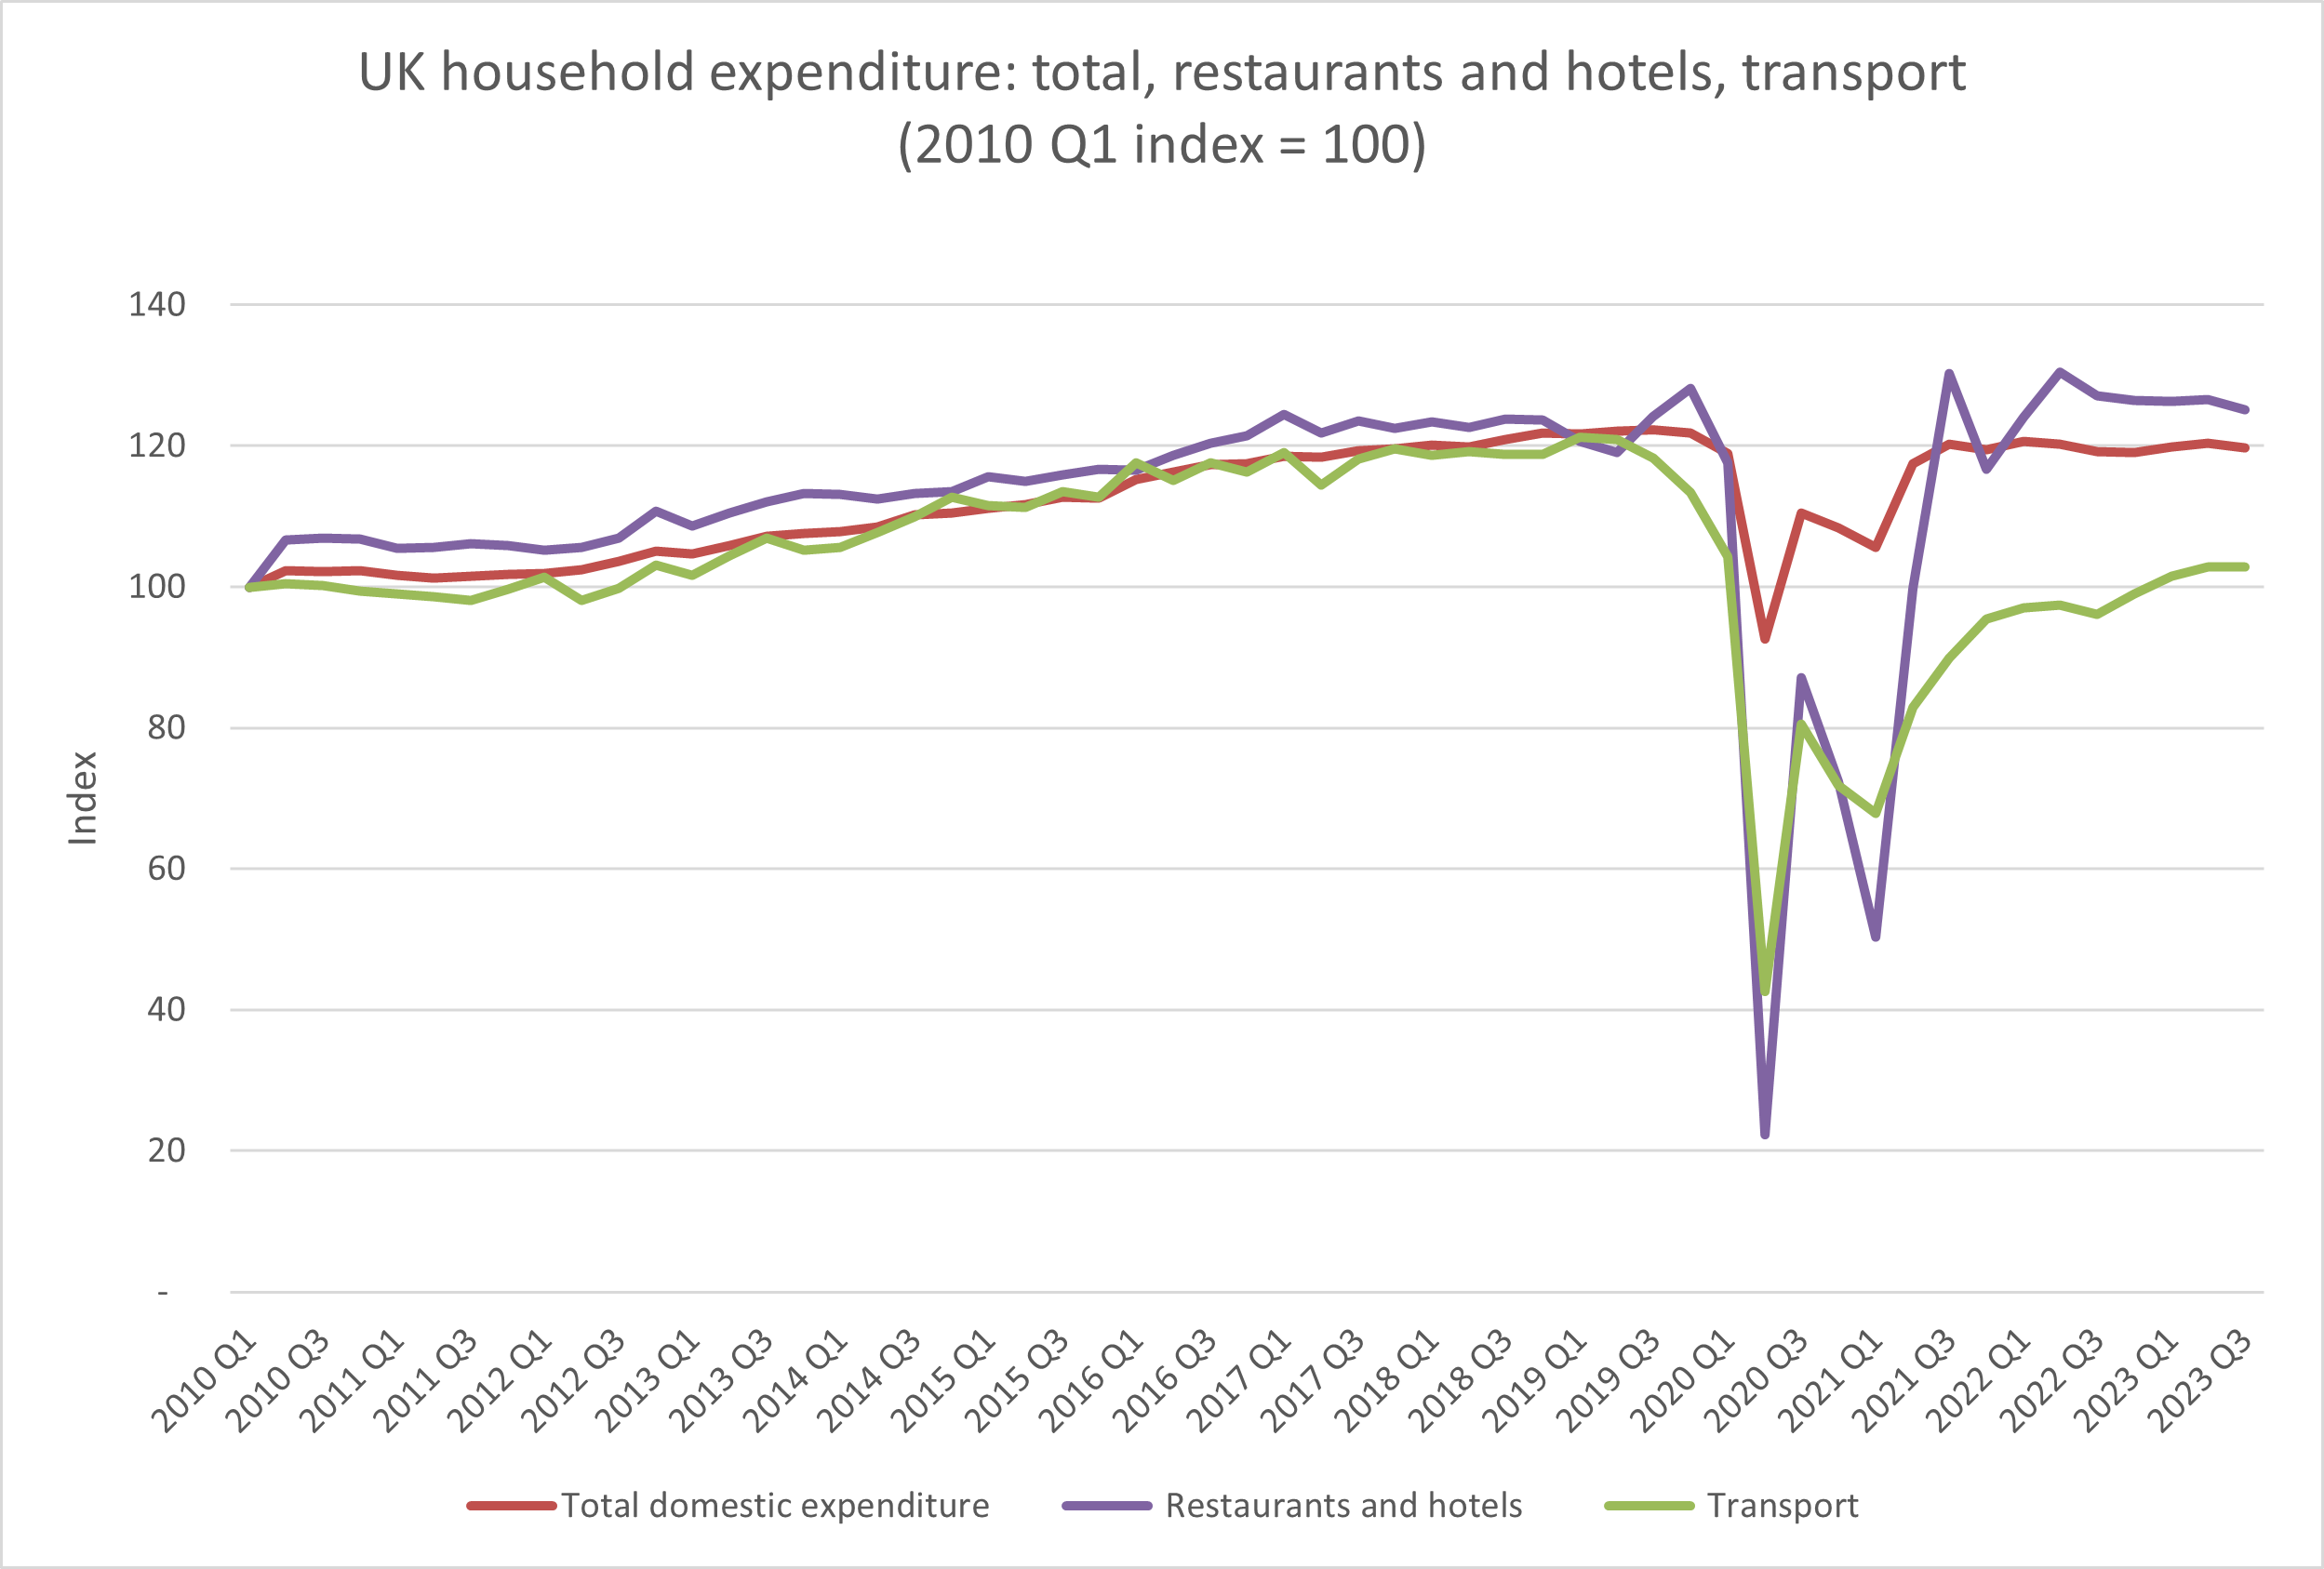
Seatbelt and Child Restraints
- A roadside observation survey of drivers in October 2021 found that on weekdays, 94.8% of drivers in Great Britain were wearing a seatbelt, compared with 94.6% in England and Wales, and 94.9% in Scotland. (In England and Wales in October 2002, 89.9% of drivers had been observed wearing seatbelts.) For front-seat passengers, seatbelt usage in Great Britain and England and Wales was lower than for drivers, but it was a bit higher for front-seat passengers in Scotland. Seatbelt usage by rear-seat passengers (including both adults and children) was lower still. See the following chart. (Department for Transport and Scotland Transport, July 2022)
- Among vehicle occupants, the biggest increase in seatbelt usage since 2002 was among rear-seat adult passengers. In England and Wales, seatbelt usage among rear-seat adult passengers rose from only 57.1% in October 2002 to 83.8% in October 2021. (97.4% of rear-seat child passengers were restrained.) (Department for Transport and Scotland Transport, July 2022)
- A study in 2006 found that 30% of car drivers who were killed in accidents in recent years were not wearing their seatbelts. Rear-seat passengers made up 13% of the casualties (deaths and injuries) in accidents, but unbelted rear-seat passengers made up 28% of the casualties. (Transport Research Laboratory, 2008).
- Car occupants not wearing seatbelts continue to be overrepresented among road fatalities. In the period 2018 – 2022, 24% of car occupants (24% of drivers, 26% of passengers) killed in crashes were not wearing seatbelts. These basic figures were affected by the gender and age of the occupant and the time of day. 30% of killed male occupants were unrestrained, compared with 14% of killed female occupants. 34% of killed occupants aged 17 to 29 were unrestrained. At night, 41% of car occupants who died were not wearing seatbelts. See the following chart. (Department for Transport, Road Safety Statistics, September 2023)
- In 2018, 26% of car occupants who were killed in accidents in Great Britain had not been using seatbelts. (Department for Transport, 2019)
- Wearing a seatbelt reduces your risk of dying in a road crash by up to 50%. (Brake, 2021)
- The Department for Transport estimated that the mandatory wearing of seatbelts has saved about 2,000 lives each year.
- If you are not wearing a seatbelt, you are 30 times more likely to be ejected from your vehicle during a crash. (Your chance of death is much higher if you are ejected from your vehicle.) (Driver Knowledge, 2019)
- One study found that in modern cars with front-seat safety devices such as airbags, the risk of a restrained passenger dying in a crash was no greater in the front seat than in the rear seat. Furthermore, unrestrained rear-seat passengers were nearly eight times as likely to sustain a serious injury in a crash as restrained rear-seat passengers. (IIHS and The Children’s Hospital of Philadelphia, United States, 2015)
- The World Health Organization stated in 2023 that the use of child restraints leads to a 71% reduction in deaths among infants. The use of child restraint systems can reduce deaths among children under 4 years of age by at least 60%. For children aged 8 through 12, booster seats can reduce the chance of injury by 19% more than wearing seatbelts alone.
- Unfortunately, a check of over 3,000 child car seats in 2015 found that 71% of them were either incompatible or fitted incorrectly. Specifically, 77% of the 1,632 seats checked in England and 62% of the 1,282 seats checked in Scotland were incorrectly fitted. (Good Egg Safety, 2015)
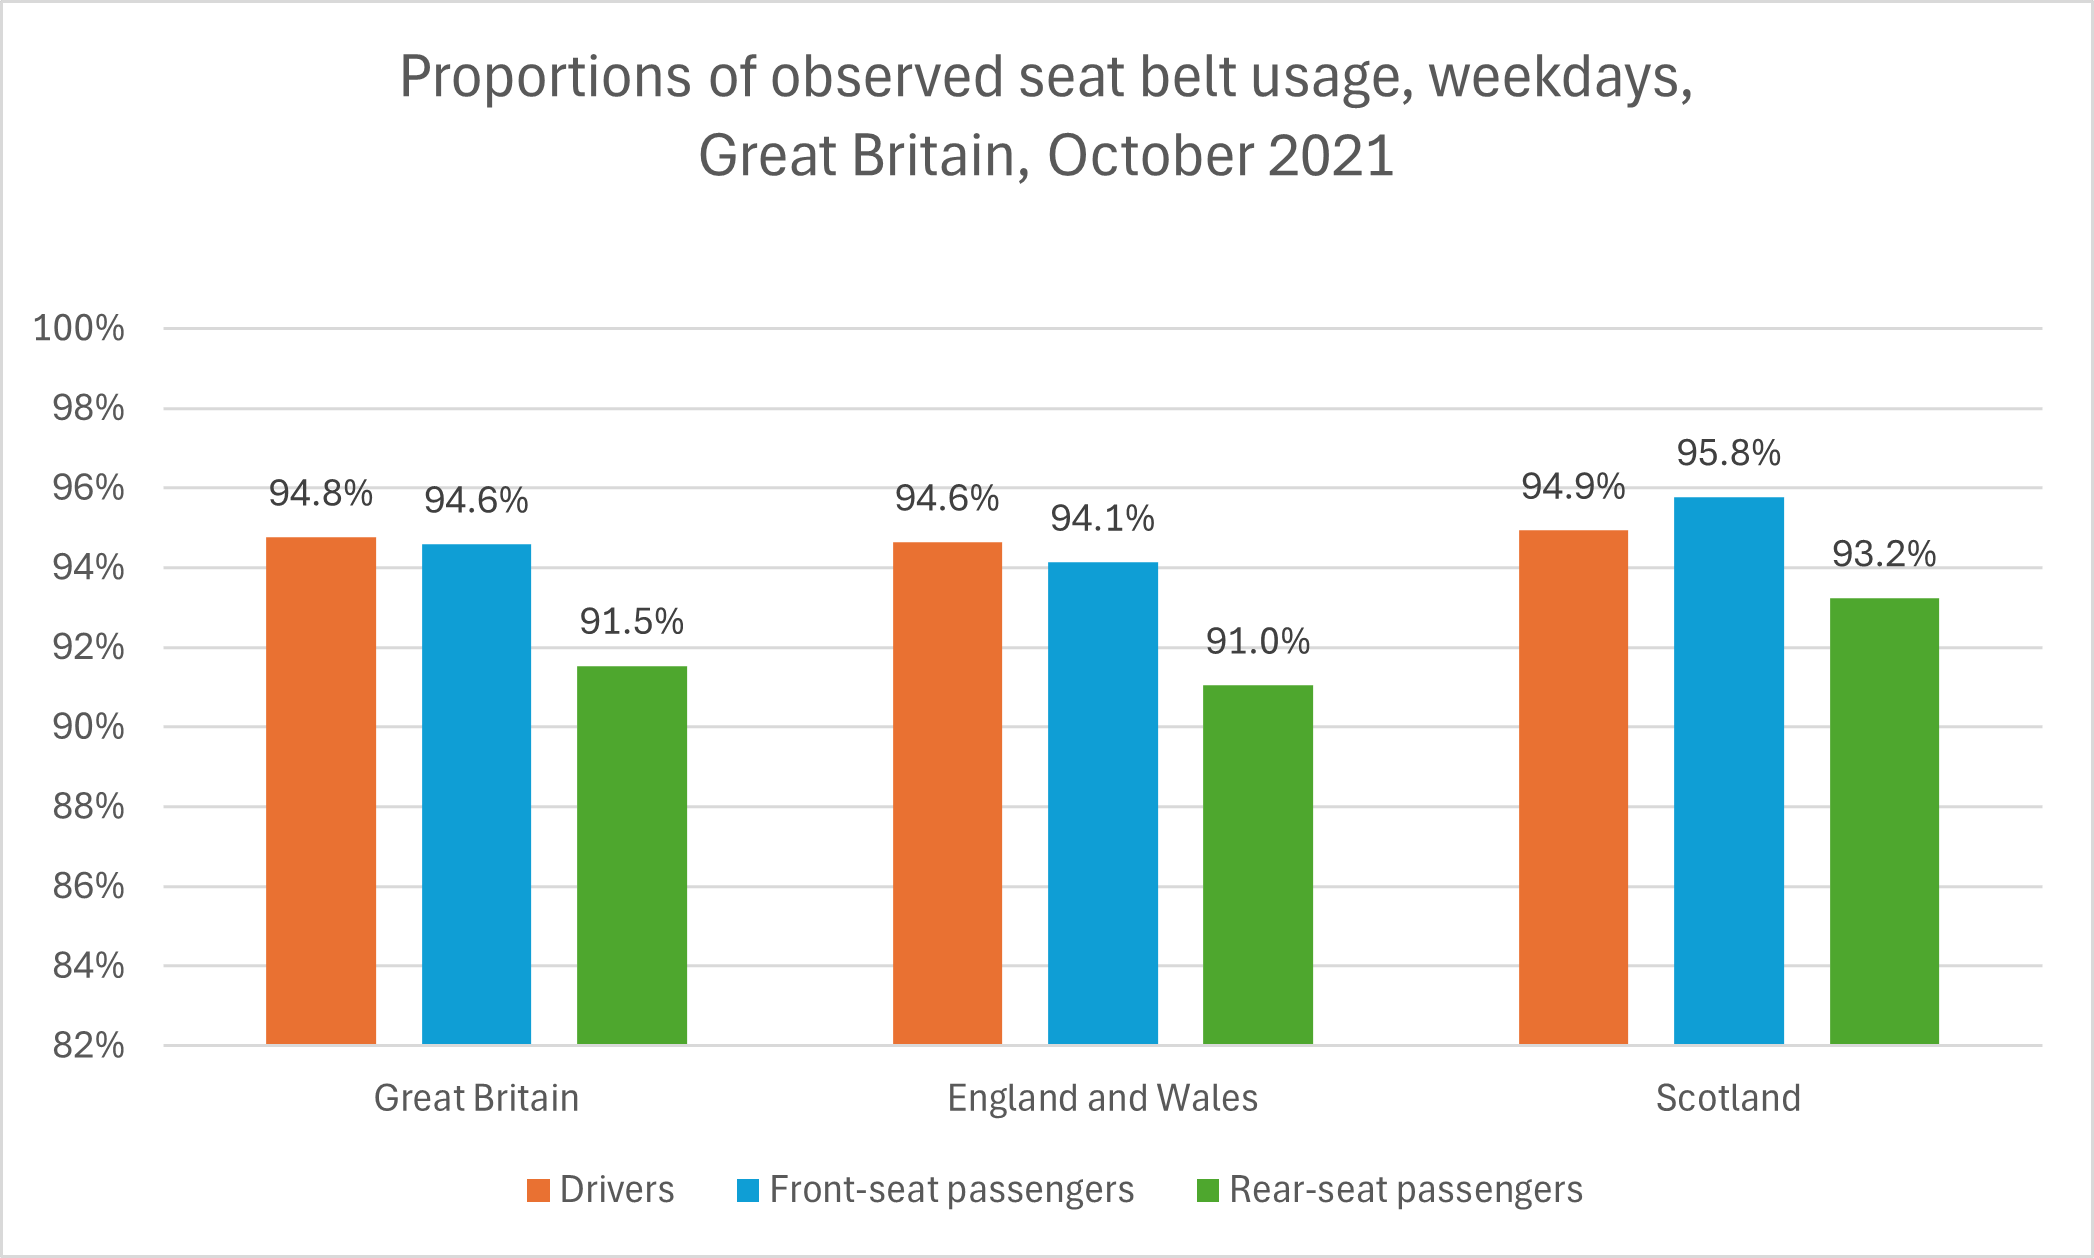
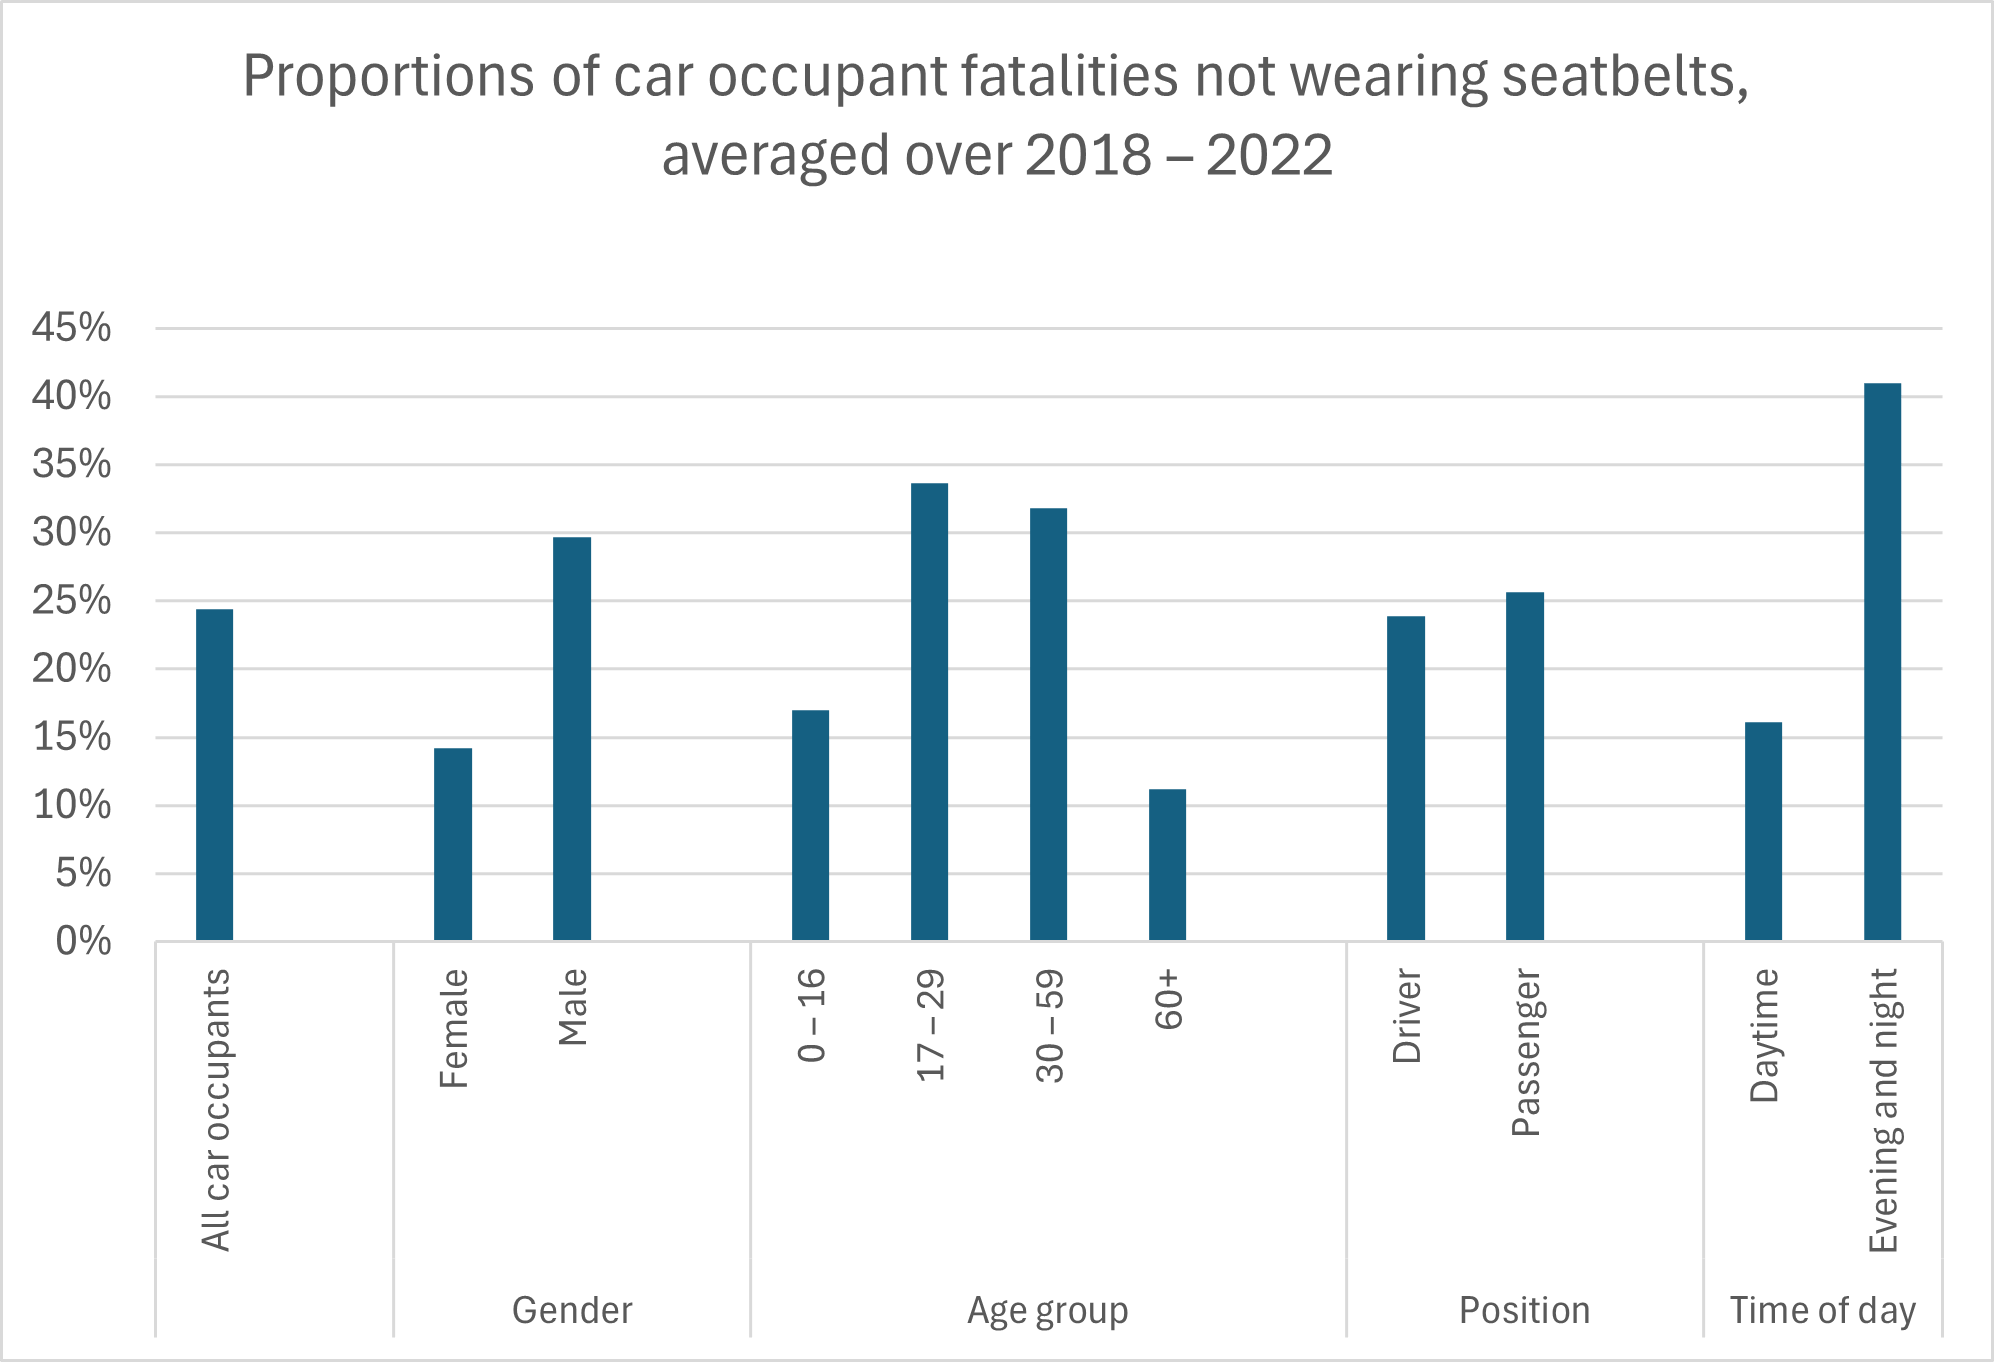
Related to Airbags
- Typically, an airbag will deploy if the impact speed is greater than 20 mph and in the general direction of the airbag. (The Royal Society for the Prevention of Accidents, 2017)
- According to the Insurance Institute for Highway Safety, the fatality-reducing effectiveness for airbags is 14% when no seat belt is used and 11% when a seat belt is used in conjunction with airbags. Side airbags, which protect the head, chest, and abdomen, reduce driver deaths by an estimated 37%. (Insurance Institute for Highway Safety, 2019)
- Studies indicate that there may be a correlation between height, weight, and driver injuries from airbags. Shorter (under 160 cm or 5’3”) and lighter (under 55 kg or 121 lb) drivers who sit closer to the steering wheel suffer more injuries from airbags. (The Royal Society for the Prevention of Accidents, 2017)
- In general, European airbags hold 35 litres of gas propellant and fully inflate within 25 milliseconds, which means that they expand at anything up to 160 mph. American airbags, usually holding 60 litres of gas, inflate even faster. (The Royal Society for the Prevention of Accidents, 2017)
Other Vehicle Safety Equipment
- One study has found that electronic stability control (ESC) has reduced the risk of being involved in a crash by 7% (95% confidence limits 3–10%), the risk of being injured in a crash by 9% (3–14%), and the risk of being killed in a crash by 56% (39–68%). (IIHS, 2004)
- In the United States in 2015, electronic stability control (ESC) saved an estimated 857 lives among passenger car occupants and an estimated 1,091 light truck and van occupants. From 2000 to 2015, ESC saved an estimated 7,024 lives. Note that these estimates are only for vehicles with ESC as standard equipment. More lives might have been saved in other vehicles that had been equipped with ESC as an available option. (NHTSA, March 2017)
A study of fatal crashes conducted by TRL in 2014 concluded that 34% of deaths on England’s strategic road network could have been prevented if every vehicle had been equipped with an automatic emergency braking system (AEB). AEB senses the chance of a collision ahead and automatically applies the brakes. That same TRL study also concluded that 14% of the deaths could have been prevented if every vehicle had been equipped with advisory intelligent speed adaptation (ISA). ISA provides an automatic measure of control over whether a vehicle exceeds the speed limit. (Advisory ISA just warns the driver that he or she is exceeding the speed limit; mandatory ISA automatically prevents the vehicle from exceeding the speed limit.)
- A 2015 study by The European New Car Assessment Programme (Euro NCAP) and Australasian NCAP found that AEB reduced real-world rear-end crashes by 38%. (RAC Foundation, March 2018)
- Studies showed that forward collision warning (FCW) reduces rear-end crashes by 23%, while FCW with AEB reduces them by 39%. Studies also showed that FCW with AEB reduces the rate of rear-end crashes with injuries by 42%. (IIHS, 2016)
- A 2020 study found that if all new vehicles were equipped with alcohol detection technology, as many as 9,000 lives could be saved each year. An alcohol detection device measures the driver's blood alcohol concentration (BAC) and prevents the vehicle from starting if the driver's BAC is at or above 0.08%. (IIHS, 2020) (IIHS, 2020)
Motorcycles
- About 80% of all motorcyclist fatalities and 70% of motorcyclist serious injuries involve head injuries. (Department for Transport, 2019)
- According to the United Nations Motorcycle Helmet Study (2016), wearing an appropriate helmet improves a motorcyclist’s chances of survival in a traffic crash by 42% and avoids 69% of injuries to riders.
- Europe found that motorcycle antilock braking systems (ABS) significantly reduced the risk of crashes involving injury to the rider. The effectiveness of motorcycle ABS in reducing injury crashes ranged from 24% (95% confidence interval (CI), 12–36%) in Italy to 29% (95% CI, 20–38%) in Spain, and 34% (95% CI, 16–52%) in Sweden. The reductions in severe and fatal crashes were even greater, at 34% (95% CI, 24–44%) in Spain and 42% (95% CI, 23–61%) in Sweden. (Swedish Transport Administration (STA), 2014)
- The rate of fatal motorcycle crashes is 22% lower for motorcycles with optional anti-lock braking systems (ABS) than for those same models of motorcycle without ABS. (IIHS, 2021)
- ABS was a standard feature on 61% of motorcycles in the 2022 model year, and an optional feature on another 18%. (IIHS, 2023)
- Among motorcyclists (drivers, not passengers) killed in the United States in 2021, 60% were wearing helmets, 37% were not, and the rest were unknown. (IIHS, May 2023)
- In motorcycle crashes in the United States in 2016, wearing a helmet reduced the likelihood of death by 37% for the operator and 41% for the passenger. (NHTSA, 2018)
- Australia found that wearing protective clothing significantly reduced the risk of injury to the rider in a motorcycle crash. Motorcyclists were significantly less likely to be admitted to the hospital if they crashed wearing motorcycle jackets (relative risk = 0.79, 95% confidence interval: 0.69–0.91), pants (RR = 0.49, 95% CI: 0.25–0.94), or gloves (RR = 0.41, 95% CI: 0.26–0.66). Garments that included fitted body armour significantly reduced the risk of injury to the upper body (RR = 0.77, 95% CI: 0.66–0.89), hands and wrists (RR = 0.55, 95% CI: 0.38–0.81), legs (RR = 0.60, 95% CI: 0.40–0.90), and feet and ankles (RR = 0.54, 95% CI: 0.35–0.83). Non-motorcycle boots were also associated with a reduced risk of injury compared with shoes or joggers (RR = 0.46, 95% CI: 0.28–0.75). (University of Sydney Australia et al., 2011)
Bicycles
- Wearing a helmet can reduce a pedal cyclist’s risk of head injury by an estimated 50% and the pedal cyclist’s risk of head, face, or neck injury by an estimated 33%. (IIHS, 2023)
- A 2018 meta-analysis in Europe found that the use of pedal cycle helmets reduced head injuries in crashes by 48%, serious head injuries by 60%, traumatic brain injuries by 53%, face injuries by 23%, and the total number of killed or seriously injured pedal cyclists by 34%. (Institute of Transport Economics, Norway, 2018)
Trucks
- A 2021 study estimated that for large trucks weighing at least 33,000 pounds, forward collision warning (FCW) and automatic emergency braking (AEB) systems reduce the rate of front-to-rear crashes per mile travelled by 44% and 41% respectively. (IIHS, 2021)
- IIHS estimates that equipping large trucks with FCW will reduce the rate of front-to-rear large truck crashes per mile by 44%. (IIHS, 2021)
- The Insurance Institute for Highway Safety (IIHS) estimates that equipping large trucks with electronic stability control (ESC) may prevent or mitigate as many as 31,000 crashes involving large trucks each year, including up to 20% of moderate-to-serious-injury large truck crashes and 11% of fatal large truck crashes. (IIHS, 2021)
- The Insurance Institute for Highway Safety (IIHS) estimates that equipping large trucks with collision avoidance (blind spot detection, forward collision warning/mitigation, and lane departure warning) as well as electronic stability control (ESC) could reduce crashes by 28%. (IIHS, 2021)
- NHTSA estimates that equipping large truck tractors and large buses with electronic stability control (ESC) could prevent 40-56% of untripped rollovers and 14% of loss-of-control crashes. (A tripped rollover is a rollover caused by a collision with another object, such as a curb.) (IIHS, 2021)
Autonomous Vehicles
- It is forecast that in 2025, about 63% of new cars sold worldwide will have level 2 automation or better. (Level 2 automation employs an automated acceleration and braking system, such as Adaptive Cruise Control, working in conjunction with an automated steering system, such as Lane Keeping Assist. Cars with only Level 1 automation provide either automated acceleration and braking or automated steering at a given time, but not both at the same time.) About 12% of cars sold in 2025 will feature Level 2 Advanced (also known as ‘Level 2+’) automation. There is no official definition of Level 2 Advanced automation, but it is expected to provide more advanced versions of the capabilities of Level 2 automation. A vehicle equipped with Level 2 Advanced automation may be able to detect pedestrians automatically, for example. About 4% of cars sold in 2025 will be equipped with pilot versions of Level 3 automation. A car equipped with Level 3 automation may be able to perform most (but not all) normal driving tasks without human intervention. However, human driver oversight will still be required. By 2030, some cars equipped with Level 4 automation will be available for sale. These cars will be capable of driving entirely on their own, although the driver will still be able to control the vehicle manually if desired. See the following chart. (Counterpoint, November 2022; Statista, March 2023)
- Under the most likely scenario, uptake of connected and autonomous vehicles (CAVs) in the UK has been projected to follow the predicted trend for Europe generally. Level 3 CAVs will comprise 14% of annual car sales, and Levels 4 and 5 CAVs will comprise 26% of annual car sales, with lower percentages for other vehicle types. This equates to 1.36 million CAVs sold in 2035, including 1.28 million CAV cars. For other types of CAVs with Level 3 automation or better, annual sales are expected to reach 58,000 vans, 13,000 heavy goods vehicles (HGVs), and 1,000 buses. (Department for Transport and Centre for Connected and Autonomous Vehicles, January 2021)
- In 2022, a survey of 4,027 members of the public in the UK found that there were still considerable misunderstandings of what self-driving vehicles could or could not do and what the responsibilities of the driver or passenger would be. 26% of respondents incorrectly responded that a self-driving vehicle could drive itself within a limited area with oversight from a human driver. Only 29% correctly knew that when riding in a self-driving vehicle as a public transport passenger, you are not responsible for how it drives, nor must you be fit to drive (for example, you can sleep). Only 16% correctly knew that when using a self-driving vehicle as a driver, you are allowed to use the vehicle’s entertainment system but not use a mobile phone, and you must be fit to drive throughout the journey. (Department for Transport and Centre for Connected and Autonomous Vehicles, June 2023)
- That same survey also found general discomfort with the prospect of riding in a self-driving vehicle. Only 17% of respondents were comfortable with using a self-driving vehicle even with shared responsibility for the driving task, yet 17% was the highest level of comfort expressed for any of the modes of use in the survey. Only 10% of respondents were comfortable with riding as a passenger in a self-driving ride-sharing vehicle (such as a taxi or pod). In fact, only 10% of respondents were comfortable with sharing the road with such vehicles. (Department for Transport and Centre for Connected and Autonomous Vehicles, June 2023)